plt axis plt.bar() plt.axis import figure pyplot highlight_text pypalettes plt.subplots() xlabel ylabel title legend colorbar savefig tight_layout grid set_xlim set_ylim plot scatter hist boxplot imshow cmap alpha bins tick_params annotate quiver contour barh stackplot subplots_adjust axhline axvline semilogx semilogy loglog polar streamplot hexbin pcolor tricontour errorbar clabel set_aspect violinplot set_axis_off spines text hatch plt axis plt.bar() plt.axis import figure pyplot highlight_text pypalettes plt.subplots() xlabel ylabel title legend colorbar savefig tight_layout grid set_xlim set_ylim plot scatter hist boxplot imshow cmap alpha bins tick_params annotate quiver contour barh stackplot subplots_adjust axhline axvline semilogx semilogy loglog polar streamplot hexbin pcolor tricontour errorbar clabel set_aspect violinplot set_axis_off spines text hatch plt axis plt.bar() plt.axis import figure pyplot highlight_text pypalettes plt.subplots() xlabel ylabel title legend colorbar savefig tight_layout grid set_xlim set_ylim plot scatter hist boxplot imshow cmap alpha bins tick_params annotate quiver contour barh stackplot subplots_adjust axhline axvline semilogx semilogy loglog polar streamplot hexbin pcolor tricontour errorbar clabel set_aspect violinplot set_axis_off spines text hatch plt axis plt.bar() plt.axis import figure pyplot highlight_text pypalettes plt.subplots() xlabel ylabel title legend colorbar savefig tight_layout grid set_xlim set_ylim plot scatter hist boxplot imshow cmap alpha bins tick_params annotate quiver contour barh stackplot subplots_adjust axhline axvline semilogx semilogy loglog polar streamplot hexbin pcolor tricontour errorbar clabel set_aspect violinplot set_axis_off spines text hatch plt axis plt.bar() plt.axis import figure pyplot highlight_text pypalettes plt.subplots() xlabel ylabel title legend colorbar savefig tight_layout grid set_xlim set_ylim plot scatter hist boxplot imshow cmap alpha bins tick_params annotate quiver contour barh stackplot subplots_adjust axhline axvline semilogx semilogy loglog polar streamplot hexbin pcolor tricontour errorbar clabel set_aspect violinplot set_axis_off spines text hatch plt axis plt.bar() plt.axis import figure pyplot highlight_text pypalettes plt.subplots() xlabel ylabel title legend colorbar savefig tight_layout grid set_xlim set_ylim plot scatter hist boxplot imshow cmap alpha bins tick_params annotate quiver contour barh stackplot subplots_adjust axhline axvline semilogx semilogy loglog polar streamplot hexbin pcolor tricontour errorbar clabel set_aspect violinplot set_axis_off spines text hatch plt axis plt.bar() plt.axis import figure pyplot highlight_text pypalettes plt.subplots() xlabel ylabel title legend colorbar savefig tight_layout grid set_xlim set_ylim plot scatter hist boxplot imshow cmap alpha bins tick_params annotate quiver contour barh stackplot subplots_adjust axhline axvline semilogx semilogy loglog polar streamplot hexbin pcolor tricontour errorbar clabel set_aspect violinplot set_axis_off spines text hatch plt axis plt.bar() plt.axis import figure pyplot highlight_text pypalettes plt.subplots() xlabel ylabel title legend colorbar savefig tight_layout grid set_xlim set_ylim plot scatter hist boxplot imshow cmap alpha bins tick_params annotate quiver contour barh stackplot subplots_adjust axhline axvline semilogx semilogy loglog polar streamplot hexbin pcolor tricontour errorbar clabel set_aspect violinplot set_axis_off spines text hatch plt axis plt.bar() plt.axis import figure pyplot highlight_text pypalettes plt.subplots() xlabel ylabel title legend colorbar savefig tight_layout grid set_xlim set_ylim plot scatter hist boxplot imshow cmap alpha bins tick_params annotate quiver contour barh stackplot subplots_adjust axhline axvline semilogx semilogy loglog polar streamplot hexbin pcolor tricontour errorbar clabel set_aspect violinplot set_axis_off spines text hatch plt axis plt.bar() plt.axis import figure pyplot highlight_text pypalettes plt.subplots() xlabel ylabel title legend colorbar savefig tight_layout grid set_xlim set_ylim plot scatter hist boxplot imshow cmap alpha bins tick_params annotate quiver contour barh stackplot subplots_adjust axhline axvline semilogx semilogy loglog polar streamplot hexbin pcolor tricontour errorbar clabel set_aspect violinplot set_axis_off spines text hatch plt axis plt.bar() plt.axis import figure pyplot highlight_text pypalettes plt.subplots() xlabel ylabel title legend colorbar savefig tight_layout grid set_xlim set_ylim plot scatter hist boxplot imshow cmap alpha bins tick_params annotate quiver contour barh stackplot subplots_adjust axhline axvline semilogx semilogy loglog polar streamplot hexbin pcolor tricontour errorbar clabel set_aspect violinplot set_axis_off spines text hatch plt axis plt.bar() plt.axis import figure pyplot highlight_text pypalettes plt.subplots() xlabel ylabel title legend colorbar savefig tight_layout grid set_xlim set_ylim plot scatter hist boxplot imshow cmap alpha bins tick_params annotate quiver contour barh stackplot subplots_adjust axhline axvline semilogx semilogy loglog polar streamplot hexbin pcolor tricontour errorbar clabel set_aspect violinplot set_axis_off spines text hatch plt axis plt.bar() plt.axis import figure pyplot highlight_text pypalettes plt.subplots() xlabel ylabel title legend colorbar savefig tight_layout grid set_xlim set_ylim plot scatter hist boxplot imshow cmap alpha bins tick_params annotate quiver contour barh stackplot subplots_adjust axhline axvline semilogx semilogy loglog polar streamplot hexbin pcolor tricontour errorbar clabel set_aspect violinplot set_axis_off spines text hatch plt axis plt.bar() plt.axis import figure pyplot highlight_text pypalettes plt.subplots() xlabel ylabel title legend colorbar savefig tight_layout grid set_xlim set_ylim plot scatter hist boxplot imshow cmap alpha bins tick_params annotate quiver contour barh stackplot subplots_adjust axhline axvline semilogx semilogy loglog polar streamplot hexbin pcolor tricontour errorbar clabel set_aspect violinplot set_axis_off spines text hatch plt axis plt.bar() plt.axis import figure pyplot highlight_text pypalettes plt.subplots() xlabel ylabel title legend colorbar savefig tight_layout grid set_xlim set_ylim plot scatter hist boxplot imshow cmap alpha bins tick_params annotate quiver contour barh stackplot subplots_adjust axhline axvline semilogx semilogy loglog polar streamplot hexbin pcolor tricontour errorbar clabel set_aspect violinplot set_axis_off spines text hatch plt axis plt.bar() plt.axis import figure pyplot highlight_text pypalettes plt.subplots() xlabel ylabel title legend colorbar savefig tight_layout grid set_xlim set_ylim plot scatter hist boxplot imshow cmap alpha bins tick_params annotate quiver contour barh stackplot subplots_adjust axhline axvline semilogx semilogy loglog polar streamplot hexbin pcolor tricontour errorbar clabel set_aspect violinplot set_axis_off spines text hatch plt axis plt.bar() plt.axis import figure pyplot highlight_text pypalettes plt.subplots() xlabel ylabel title legend colorbar savefig tight_layout grid set_xlim set_ylim plot scatter hist boxplot imshow cmap alpha bins tick_params annotate quiver contour barh stackplot subplots_adjust axhline axvline semilogx semilogy loglog polar streamplot hexbin pcolor tricontour errorbar clabel set_aspect violinplot set_axis_off spines text hatch plt axis plt.bar() plt.axis import figure pyplot highlight_text pypalettes plt.subplots() xlabel ylabel title legend colorbar savefig tight_layout grid set_xlim set_ylim plot scatter hist boxplot imshow cmap alpha bins tick_params annotate quiver contour barh stackplot subplots_adjust axhline axvline semilogx semilogy loglog polar streamplot hexbin pcolor tricontour errorbar clabel set_aspect violinplot set_axis_off spines text hatch plt axis plt.bar() plt.axis import figure pyplot highlight_text pypalettes plt.subplots() xlabel ylabel title legend colorbar savefig tight_layout grid set_xlim set_ylim plot scatter hist boxplot imshow cmap alpha bins tick_params annotate quiver contour barh stackplot subplots_adjust axhline axvline semilogx semilogy loglog polar streamplot hexbin pcolor tricontour errorbar clabel set_aspect violinplot set_axis_off spines text hatch plt axis plt.bar() plt.axis import figure pyplot highlight_text pypalettes plt.subplots() xlabel ylabel title legend colorbar savefig tight_layout grid set_xlim set_ylim plot scatter hist boxplot imshow cmap alpha bins tick_params annotate quiver contour barh stackplot subplots_adjust axhline axvline semilogx semilogy loglog polar streamplot hexbin pcolor tricontour errorbar clabel set_aspect violinplot set_axis_off spines text hatch plt axis plt.bar() plt.axis import figure pyplot highlight_text pypalettes plt.subplots() xlabel ylabel title legend colorbar savefig tight_layout grid set_xlim set_ylim plot scatter hist boxplot imshow cmap alpha bins tick_params annotate quiver contour barh stackplot subplots_adjust axhline axvline semilogx semilogy loglog polar streamplot hexbin pcolor tricontour errorbar clabel set_aspect violinplot set_axis_off spines text hatch plt axis plt.bar() plt.axis import figure pyplot highlight_text pypalettes plt.subplots() xlabel ylabel title legend colorbar savefig tight_layout grid set_xlim set_ylim plot scatter hist boxplot imshow cmap alpha bins tick_params annotate quiver contour barh stackplot subplots_adjust axhline axvline semilogx semilogy loglog polar streamplot hexbin pcolor tricontour errorbar clabel set_aspect violinplot set_axis_off spines text hatch plt axis plt.bar() plt.axis import figure pyplot highlight_text pypalettes plt.subplots() xlabel ylabel title legend colorbar savefig tight_layout grid set_xlim set_ylim plot scatter hist boxplot imshow cmap alpha bins tick_params annotate quiver contour barh stackplot subplots_adjust axhline axvline semilogx semilogy loglog polar streamplot hexbin pcolor tricontour errorbar clabel set_aspect violinplot set_axis_off spines text hatch plt axis plt.bar() plt.axis import figure pyplot highlight_text pypalettes plt.subplots() xlabel ylabel title legend colorbar savefig tight_layout grid set_xlim set_ylim plot scatter hist boxplot imshow cmap alpha bins tick_params annotate quiver contour barh stackplot subplots_adjust axhline axvline semilogx semilogy loglog polar streamplot hexbin pcolor tricontour errorbar clabel set_aspect violinplot set_axis_off spines text hatch plt axis plt.bar() plt.axis import figure pyplot highlight_text pypalettes plt.subplots() xlabel ylabel title legend colorbar savefig tight_layout grid set_xlim set_ylim plot scatter hist boxplot imshow cmap alpha bins tick_params annotate quiver contour barh stackplot subplots_adjust axhline axvline semilogx semilogy loglog polar streamplot hexbin pcolor tricontour errorbar clabel set_aspect violinplot set_axis_off spines text hatch plt axis plt.bar() plt.axis import figure pyplot highlight_text pypalettes plt.subplots() xlabel ylabel title legend colorbar savefig tight_layout grid set_xlim set_ylim plot scatter hist boxplot imshow cmap alpha bins tick_params annotate quiver contour barh stackplot subplots_adjust axhline axvline semilogx semilogy loglog polar streamplot hexbin pcolor tricontour errorbar clabel set_aspect violinplot set_axis_off spines text hatch plt axis plt.bar() plt.axis import figure pyplot highlight_text pypalettes plt.subplots() xlabel ylabel title legend colorbar savefig tight_layout grid set_xlim set_ylim plot scatter hist boxplot imshow cmap alpha bins tick_params annotate quiver contour barh stackplot subplots_adjust axhline axvline semilogx semilogy loglog polar streamplot hexbin pcolor tricontour errorbar clabel set_aspect violinplot set_axis_off spines text hatch plt axis plt.bar() plt.axis import figure pyplot highlight_text pypalettes plt.subplots() xlabel ylabel title legend colorbar savefig tight_layout grid set_xlim set_ylim plot scatter hist boxplot imshow cmap alpha bins tick_params annotate quiver contour barh stackplot subplots_adjust axhline axvline semilogx semilogy loglog polar streamplot hexbin pcolor tricontour errorbar clabel set_aspect violinplot set_axis_off spines text hatch plt axis plt.bar() plt.axis import figure pyplot highlight_text pypalettes plt.subplots() xlabel ylabel title legend colorbar savefig tight_layout grid set_xlim set_ylim plot scatter hist boxplot imshow cmap alpha bins tick_params annotate quiver contour barh stackplot subplots_adjust axhline axvline semilogx semilogy loglog polar streamplot hexbin pcolor tricontour errorbar clabel set_aspect violinplot set_axis_off spines text hatch plt axis plt.bar() plt.axis import figure pyplot highlight_text pypalettes plt.subplots() xlabel ylabel title legend colorbar savefig tight_layout grid set_xlim set_ylim plot scatter hist boxplot imshow cmap alpha bins tick_params annotate quiver contour barh stackplot subplots_adjust axhline axvline semilogx semilogy loglog polar streamplot hexbin pcolor tricontour errorbar clabel set_aspect violinplot set_axis_off spines text hatch plt axis plt.bar() plt.axis import figure pyplot highlight_text pypalettes plt.subplots() xlabel ylabel title legend colorbar savefig tight_layout grid set_xlim set_ylim plot scatter hist boxplot imshow cmap alpha bins tick_params annotate quiver contour barh stackplot subplots_adjust axhline axvline semilogx semilogy loglog polar streamplot hexbin pcolor tricontour errorbar clabel set_aspect violinplot set_axis_off spines text hatch plt axis plt.bar() plt.axis import figure pyplot highlight_text pypalettes plt.subplots() xlabel ylabel title legend colorbar savefig tight_layout grid set_xlim set_ylim plot scatter hist boxplot imshow cmap alpha bins tick_params annotate quiver contour barh stackplot subplots_adjust axhline axvline semilogx semilogy loglog polar streamplot hexbin pcolor tricontour errorbar clabel set_aspect violinplot set_axis_off spines text hatch plt axis plt.bar() plt.axis import figure pyplot highlight_text pypalettes plt.subplots() xlabel ylabel title legend colorbar savefig tight_layout grid set_xlim set_ylim plot scatter hist boxplot imshow cmap alpha bins tick_params annotate quiver contour barh stackplot subplots_adjust axhline axvline semilogx semilogy loglog polar streamplot hexbin pcolor tricontour errorbar clabel set_aspect violinplot set_axis_off spines text hatch plt axis plt.bar() plt.axis import figure pyplot highlight_text pypalettes plt.subplots() xlabel ylabel title legend colorbar savefig tight_layout grid set_xlim set_ylim plot scatter hist boxplot imshow cmap alpha bins tick_params annotate quiver contour barh stackplot subplots_adjust axhline axvline semilogx semilogy loglog polar streamplot hexbin pcolor tricontour errorbar clabel set_aspect violinplot set_axis_off spines text hatch plt axis plt.bar() plt.axis import figure pyplot highlight_text pypalettes plt.subplots() xlabel ylabel title legend colorbar savefig tight_layout grid set_xlim set_ylim plot scatter hist boxplot imshow cmap alpha bins tick_params annotate quiver contour barh stackplot subplots_adjust axhline axvline semilogx semilogy loglog polar streamplot hexbin pcolor tricontour errorbar clabel set_aspect violinplot set_axis_off spines text hatch plt axis plt.bar() plt.axis import figure pyplot highlight_text pypalettes plt.subplots() xlabel ylabel title legend colorbar savefig tight_layout grid set_xlim set_ylim plot scatter hist boxplot imshow cmap alpha bins tick_params annotate quiver contour barh stackplot subplots_adjust axhline axvline semilogx semilogy loglog polar streamplot hexbin pcolor tricontour errorbar clabel set_aspect violinplot set_axis_off spines text hatch plt axis plt.bar() plt.axis import figure pyplot highlight_text pypalettes plt.subplots() xlabel ylabel title legend colorbar savefig tight_layout grid set_xlim set_ylim plot scatter hist boxplot imshow cmap alpha bins tick_params annotate quiver contour barh stackplot subplots_adjust axhline axvline semilogx semilogy loglog polar streamplot hexbin pcolor tricontour errorbar clabel set_aspect violinplot set_axis_off spines text hatch plt axis plt.bar() plt.axis import figure pyplot highlight_text pypalettes plt.subplots() xlabel ylabel title legend colorbar savefig tight_layout grid set_xlim set_ylim plot scatter hist boxplot imshow cmap alpha bins tick_params annotate quiver contour barh stackplot subplots_adjust axhline axvline semilogx semilogy loglog polar streamplot hexbin pcolor tricontour errorbar clabel set_aspect violinplot set_axis_off spines text hatch plt axis plt.bar() plt.axis import figure pyplot highlight_text pypalettes plt.subplots() xlabel ylabel title legend colorbar savefig tight_layout grid set_xlim set_ylim plot scatter hist boxplot imshow cmap alpha bins tick_params annotate quiver contour barh stackplot subplots_adjust axhline axvline semilogx semilogy loglog polar streamplot hexbin pcolor tricontour errorbar clabel set_aspect violinplot set_axis_off spines text hatch plt axis plt.bar() plt.axis import figure pyplot highlight_text pypalettes plt.subplots() xlabel ylabel title legend colorbar savefig tight_layout grid set_xlim set_ylim plot scatter hist boxplot imshow cmap alpha bins tick_params annotate quiver contour barh stackplot subplots_adjust axhline axvline semilogx semilogy loglog polar streamplot hexbin pcolor tricontour errorbar clabel set_aspect violinplot set_axis_off spines text hatch plt axis plt.bar() plt.axis import figure pyplot highlight_text pypalettes plt.subplots() xlabel ylabel title legend colorbar savefig tight_layout grid set_xlim set_ylim plot scatter hist boxplot imshow cmap alpha bins tick_params annotate quiver contour barh stackplot subplots_adjust axhline axvline semilogx semilogy loglog polar streamplot hexbin pcolor tricontour errorbar clabel set_aspect violinplot set_axis_off spines text hatch plt axis plt.bar() plt.axis import figure pyplot highlight_text pypalettes plt.subplots() xlabel ylabel title legend colorbar savefig tight_layout grid set_xlim set_ylim plot scatter hist boxplot imshow cmap alpha bins tick_params annotate quiver contour barh stackplot subplots_adjust axhline axvline semilogx semilogy loglog polar streamplot hexbin pcolor tricontour errorbar clabel set_aspect violinplot set_axis_off spines text hatch plt axis plt.bar() plt.axis import figure pyplot highlight_text pypalettes plt.subplots() xlabel ylabel title legend colorbar savefig tight_layout grid set_xlim set_ylim plot scatter hist boxplot imshow cmap alpha bins tick_params annotate quiver contour barh stackplot subplots_adjust axhline axvline semilogx semilogy loglog polar streamplot hexbin pcolor tricontour errorbar clabel set_aspect violinplot set_axis_off spines text hatch plt axis plt.bar() plt.axis import figure pyplot highlight_text pypalettes plt.subplots() xlabel ylabel title legend colorbar savefig tight_layout grid set_xlim set_ylim plot scatter hist boxplot imshow cmap alpha bins tick_params annotate quiver contour barh stackplot subplots_adjust axhline axvline semilogx semilogy loglog polar streamplot hexbin pcolor tricontour errorbar clabel set_aspect violinplot set_axis_off spines text hatch plt axis plt.bar() plt.axis import figure pyplot highlight_text pypalettes plt.subplots() xlabel ylabel title legend colorbar savefig tight_layout grid set_xlim set_ylim plot scatter hist boxplot imshow cmap alpha bins tick_params annotate quiver contour barh stackplot subplots_adjust axhline axvline semilogx semilogy loglog polar streamplot hexbin pcolor tricontour errorbar clabel set_aspect violinplot set_axis_off spines text hatch plt axis plt.bar() plt.axis import figure pyplot highlight_text pypalettes plt.subplots() xlabel ylabel title legend colorbar savefig tight_layout grid set_xlim set_ylim plot scatter hist boxplot imshow cmap alpha bins tick_params annotate quiver contour barh stackplot subplots_adjust axhline axvline semilogx semilogy loglog polar streamplot hexbin pcolor tricontour errorbar clabel set_aspect violinplot set_axis_off spines text hatch plt axis plt.bar() plt.axis import figure pyplot highlight_text pypalettes plt.subplots() xlabel ylabel title legend colorbar savefig tight_layout grid set_xlim set_ylim plot scatter hist boxplot imshow cmap alpha bins tick_params annotate quiver contour barh stackplot subplots_adjust axhline axvline semilogx semilogy loglog polar streamplot hexbin pcolor tricontour errorbar clabel set_aspect violinplot set_axis_off spines text hatch plt axis plt.bar() plt.axis import figure pyplot highlight_text pypalettes plt.subplots() xlabel ylabel title legend colorbar savefig tight_layout grid set_xlim set_ylim plot scatter hist boxplot imshow cmap alpha bins tick_params annotate quiver contour barh stackplot subplots_adjust axhline axvline semilogx semilogy loglog polar streamplot hexbin pcolor tricontour errorbar clabel set_aspect violinplot set_axis_off spines text hatch plt axis plt.bar() plt.axis import figure pyplot highlight_text pypalettes plt.subplots() xlabel ylabel title legend colorbar savefig tight_layout grid set_xlim set_ylim plot scatter hist boxplot imshow cmap alpha bins tick_params annotate quiver contour barh stackplot subplots_adjust axhline axvline semilogx semilogy loglog polar streamplot hexbin pcolor tricontour errorbar clabel set_aspect violinplot set_axis_off spines text hatch plt axis plt.bar() plt.axis import figure pyplot highlight_text pypalettes plt.subplots() xlabel ylabel title legend colorbar savefig tight_layout grid set_xlim set_ylim plot scatter hist boxplot imshow cmap alpha bins tick_params annotate quiver contour barh stackplot subplots_adjust axhline axvline semilogx semilogy loglog polar streamplot hexbin pcolor tricontour errorbar clabel set_aspect violinplot set_axis_off spines text hatch plt axis plt.bar() plt.axis import figure pyplot highlight_text pypalettes plt.subplots() xlabel ylabel title legend colorbar savefig tight_layout grid set_xlim set_ylim plot scatter hist boxplot imshow cmap alpha bins tick_params annotate quiver contour barh stackplot subplots_adjust axhline axvline semilogx semilogy loglog polar streamplot hexbin pcolor tricontour errorbar clabel set_aspect violinplot set_axis_off spines text hatch plt axis plt.bar() plt.axis import figure pyplot highlight_text pypalettes plt.subplots() xlabel ylabel title legend colorbar savefig tight_layout grid set_xlim set_ylim plot scatter hist boxplot imshow cmap alpha bins tick_params annotate quiver contour barh stackplot subplots_adjust axhline axvline semilogx semilogy loglog polar streamplot hexbin pcolor tricontour errorbar clabel set_aspect violinplot set_axis_off spines text hatch plt axis plt.bar() plt.axis import figure pyplot highlight_text pypalettes plt.subplots() xlabel ylabel title legend colorbar savefig tight_layout grid set_xlim set_ylim plot scatter hist boxplot imshow cmap alpha bins tick_params annotate quiver contour barh stackplot subplots_adjust axhline axvline semilogx semilogy loglog polar streamplot hexbin pcolor tricontour errorbar clabel set_aspect violinplot set_axis_off spines text hatch plt axis plt.bar() plt.axis import figure pyplot highlight_text pypalettes plt.subplots() xlabel ylabel title legend colorbar savefig tight_layout grid set_xlim set_ylim plot scatter hist boxplot imshow cmap alpha bins tick_params annotate quiver contour barh stackplot subplots_adjust axhline axvline semilogx semilogy loglog polar streamplot hexbin pcolor tricontour errorbar clabel set_aspect violinplot set_axis_off spines text hatch plt axis plt.bar() plt.axis import figure pyplot highlight_text pypalettes plt.subplots() xlabel ylabel title legend colorbar savefig tight_layout grid set_xlim set_ylim plot scatter hist boxplot imshow cmap alpha bins tick_params annotate quiver contour barh stackplot subplots_adjust axhline axvline semilogx semilogy loglog polar streamplot hexbin pcolor tricontour errorbar clabel set_aspect violinplot set_axis_off spines text hatch plt axis plt.bar() plt.axis import figure pyplot highlight_text pypalettes plt.subplots() xlabel ylabel title legend colorbar savefig tight_layout grid set_xlim set_ylim plot scatter hist boxplot imshow cmap alpha bins tick_params annotate quiver contour barh stackplot subplots_adjust axhline axvline semilogx semilogy loglog polar streamplot hexbin pcolor tricontour errorbar clabel set_aspect violinplot set_axis_off spines text hatch plt axis plt.bar() plt.axis import figure pyplot highlight_text pypalettes plt.subplots() xlabel ylabel title legend colorbar savefig tight_layout grid set_xlim set_ylim plot scatter hist boxplot imshow cmap alpha bins tick_params annotate quiver contour barh stackplot subplots_adjust axhline axvline semilogx semilogy loglog polar streamplot hexbin pcolor tricontour errorbar clabel set_aspect violinplot set_axis_off spines text hatch plt axis plt.bar() plt.axis import figure pyplot highlight_text pypalettes plt.subplots() xlabel ylabel title legend colorbar savefig tight_layout grid set_xlim set_ylim plot scatter hist boxplot imshow cmap alpha bins tick_params annotate quiver contour barh stackplot subplots_adjust axhline axvline semilogx semilogy loglog polar streamplot hexbin pcolor tricontour errorbar clabel set_aspect violinplot set_axis_off spines text hatch plt axis plt.bar() plt.axis import figure pyplot highlight_text pypalettes plt.subplots() xlabel ylabel title legend colorbar savefig tight_layout grid set_xlim set_ylim plot scatter hist boxplot imshow cmap alpha bins tick_params annotate quiver contour barh stackplot subplots_adjust axhline axvline semilogx semilogy loglog polar streamplot hexbin pcolor tricontour errorbar clabel set_aspect violinplot set_axis_off spines text hatch plt axis plt.bar() plt.axis import figure pyplot highlight_text pypalettes plt.subplots() xlabel ylabel title legend colorbar savefig tight_layout grid set_xlim set_ylim plot scatter hist boxplot imshow cmap alpha bins tick_params annotate quiver contour barh stackplot subplots_adjust axhline axvline semilogx semilogy loglog polar streamplot hexbin pcolor tricontour errorbar clabel set_aspect violinplot set_axis_off spines text hatch plt axis plt.bar() plt.axis import figure pyplot highlight_text pypalettes plt.subplots() xlabel ylabel title legend colorbar savefig tight_layout grid set_xlim set_ylim plot scatter hist boxplot imshow cmap alpha bins tick_params annotate quiver contour barh stackplot subplots_adjust axhline axvline semilogx semilogy loglog polar streamplot hexbin pcolor tricontour errorbar clabel set_aspect violinplot set_axis_off spines text hatch plt axis plt.bar() plt.axis import figure pyplot highlight_text pypalettes plt.subplots() xlabel ylabel title legend colorbar savefig tight_layout grid set_xlim set_ylim plot scatter hist boxplot imshow cmap alpha bins tick_params annotate quiver contour barh stackplot subplots_adjust axhline axvline semilogx semilogy loglog polar streamplot hexbin pcolor tricontour errorbar clabel set_aspect violinplot set_axis_off spines text hatch plt axis plt.bar() plt.axis import figure pyplot highlight_text pypalettes plt.subplots() xlabel ylabel title legend colorbar savefig tight_layout grid set_xlim set_ylim plot scatter hist boxplot imshow cmap alpha bins tick_params annotate quiver contour barh stackplot subplots_adjust axhline axvline semilogx semilogy loglog polar streamplot hexbin pcolor tricontour errorbar clabel set_aspect violinplot set_axis_off spines text hatch plt axis plt.bar() plt.axis import figure pyplot highlight_text pypalettes plt.subplots() xlabel ylabel title legend colorbar savefig tight_layout grid set_xlim set_ylim plot scatter hist boxplot imshow cmap alpha bins tick_params annotate quiver contour barh stackplot subplots_adjust axhline axvline semilogx semilogy loglog polar streamplot hexbin pcolor tricontour errorbar clabel set_aspect violinplot set_axis_off spines text hatch plt axis plt.bar() plt.axis import figure pyplot highlight_text pypalettes plt.subplots() xlabel ylabel title legend colorbar savefig tight_layout grid set_xlim set_ylim plot scatter hist boxplot imshow cmap alpha bins tick_params annotate quiver contour barh stackplot subplots_adjust axhline axvline semilogx semilogy loglog polar streamplot hexbin pcolor tricontour errorbar clabel set_aspect violinplot set_axis_off spines text hatch plt axis plt.bar() plt.axis import figure pyplot highlight_text pypalettes plt.subplots() xlabel ylabel title legend colorbar savefig tight_layout grid set_xlim set_ylim plot scatter hist boxplot imshow cmap alpha bins tick_params annotate quiver contour barh stackplot subplots_adjust axhline axvline semilogx semilogy loglog polar streamplot hexbin pcolor tricontour errorbar clabel set_aspect violinplot set_axis_off spines text hatch plt axis plt.bar() plt.axis import figure pyplot highlight_text pypalettes plt.subplots() xlabel ylabel title legend colorbar savefig tight_layout grid set_xlim set_ylim plot scatter hist boxplot imshow cmap alpha bins tick_params annotate quiver contour barh stackplot subplots_adjust axhline axvline semilogx semilogy loglog polar streamplot hexbin pcolor tricontour errorbar clabel set_aspect violinplot set_axis_off spines text hatch plt axis plt.bar() plt.axis import figure pyplot highlight_text pypalettes plt.subplots() xlabel ylabel title legend colorbar savefig tight_layout grid set_xlim set_ylim plot scatter hist boxplot imshow cmap alpha bins tick_params annotate quiver contour barh stackplot subplots_adjust axhline axvline semilogx semilogy loglog polar streamplot hexbin pcolor tricontour errorbar clabel set_aspect violinplot set_axis_off spines text hatch plt axis plt.bar() plt.axis import figure pyplot highlight_text pypalettes plt.subplots() xlabel ylabel title legend colorbar savefig tight_layout grid set_xlim set_ylim plot scatter hist boxplot imshow cmap alpha bins tick_params annotate quiver contour barh stackplot subplots_adjust axhline axvline semilogx semilogy loglog polar streamplot hexbin pcolor tricontour errorbar clabel set_aspect violinplot set_axis_off spines text hatch plt axis plt.bar() plt.axis import figure pyplot highlight_text pypalettes plt.subplots() xlabel ylabel title legend colorbar savefig tight_layout grid set_xlim set_ylim plot scatter hist boxplot imshow cmap alpha bins tick_params annotate quiver contour barh stackplot subplots_adjust axhline axvline semilogx semilogy loglog polar streamplot hexbin pcolor tricontour errorbar clabel set_aspect violinplot set_axis_off spines text hatch plt axis plt.bar() plt.axis import figure pyplot highlight_text pypalettes plt.subplots() xlabel ylabel title legend colorbar savefig tight_layout grid set_xlim set_ylim plot scatter hist boxplot imshow cmap alpha bins tick_params annotate quiver contour barh stackplot subplots_adjust axhline axvline semilogx semilogy loglog polar streamplot hexbin pcolor tricontour errorbar clabel set_aspect violinplot set_axis_off spines text hatch plt axis plt.bar() plt.axis import figure pyplot highlight_text pypalettes plt.subplots() xlabel ylabel title legend colorbar savefig tight_layout grid set_xlim set_ylim plot scatter hist boxplot imshow cmap alpha bins tick_params annotate quiver contour barh stackplot subplots_adjust axhline axvline semilogx semilogy loglog polar streamplot hexbin pcolor tricontour errorbar clabel set_aspect violinplot set_axis_off spines text hatch plt axis plt.bar() plt.axis import figure pyplot highlight_text pypalettes plt.subplots() xlabel ylabel title legend colorbar savefig tight_layout grid set_xlim set_ylim plot scatter hist boxplot imshow cmap alpha bins tick_params annotate quiver contour barh stackplot subplots_adjust axhline axvline semilogx semilogy loglog polar streamplot hexbin pcolor tricontour errorbar clabel set_aspect violinplot set_axis_off spines text hatch plt axis plt.bar() plt.axis import figure pyplot highlight_text pypalettes plt.subplots() xlabel ylabel title legend colorbar savefig tight_layout grid set_xlim set_ylim plot scatter hist boxplot imshow cmap alpha bins tick_params annotate quiver contour barh stackplot subplots_adjust axhline axvline semilogx semilogy loglog polar streamplot hexbin pcolor tricontour errorbar clabel set_aspect violinplot set_axis_off spines text hatch plt axis plt.bar() plt.axis import figure pyplot highlight_text pypalettes plt.subplots() xlabel ylabel title legend colorbar savefig tight_layout grid set_xlim set_ylim plot scatter hist boxplot imshow cmap alpha bins tick_params annotate quiver contour barh stackplot subplots_adjust axhline axvline semilogx semilogy loglog polar streamplot hexbin pcolor tricontour errorbar clabel set_aspect violinplot set_axis_off spines text hatch plt axis plt.bar() plt.axis import figure pyplot highlight_text pypalettes plt.subplots() xlabel ylabel title legend colorbar savefig tight_layout grid set_xlim set_ylim plot scatter hist boxplot imshow cmap alpha bins tick_params annotate quiver contour barh stackplot subplots_adjust axhline axvline semilogx semilogy loglog polar streamplot hexbin pcolor tricontour errorbar clabel set_aspect violinplot set_axis_off spines text hatch plt axis plt.bar() plt.axis import figure pyplot highlight_text pypalettes plt.subplots() xlabel ylabel title legend colorbar savefig tight_layout grid set_xlim set_ylim plot scatter hist boxplot imshow cmap alpha bins tick_params annotate quiver contour barh stackplot subplots_adjust axhline axvline semilogx semilogy loglog polar streamplot hexbin pcolor tricontour errorbar clabel set_aspect violinplot set_axis_off spines text hatch plt axis plt.bar() plt.axis import figure pyplot highlight_text pypalettes plt.subplots() xlabel ylabel title legend colorbar savefig tight_layout grid set_xlim set_ylim plot scatter hist boxplot imshow cmap alpha bins tick_params annotate quiver contour barh stackplot subplots_adjust axhline axvline semilogx semilogy loglog polar streamplot hexbin pcolor tricontour errorbar clabel set_aspect violinplot set_axis_off spines text hatch plt axis plt.bar() plt.axis import figure pyplot highlight_text pypalettes plt.subplots() xlabel ylabel title legend colorbar savefig tight_layout grid set_xlim set_ylim plot scatter hist boxplot imshow cmap alpha bins tick_params annotate quiver contour barh stackplot subplots_adjust axhline axvline semilogx semilogy loglog polar streamplot hexbin pcolor tricontour errorbar clabel set_aspect violinplot set_axis_off spines text hatch plt axis plt.bar() plt.axis import figure pyplot highlight_text pypalettes plt.subplots() xlabel ylabel title legend colorbar savefig tight_layout grid set_xlim set_ylim plot scatter hist boxplot imshow cmap alpha bins tick_params annotate quiver contour barh stackplot subplots_adjust axhline axvline semilogx semilogy loglog polar streamplot hexbin pcolor tricontour errorbar clabel set_aspect violinplot set_axis_off spines text hatch plt axis plt.bar() plt.axis import figure pyplot highlight_text pypalettes plt.subplots() xlabel ylabel title legend colorbar savefig tight_layout grid set_xlim set_ylim plot scatter hist boxplot imshow cmap alpha bins tick_params annotate quiver contour barh stackplot subplots_adjust axhline axvline semilogx semilogy loglog polar streamplot hexbin pcolor tricontour errorbar clabel set_aspect violinplot set_axis_off spines text hatch plt axis plt.bar() plt.axis import figure pyplot highlight_text pypalettes plt.subplots() xlabel ylabel title legend colorbar savefig tight_layout grid set_xlim set_ylim plot scatter hist boxplot imshow cmap alpha bins tick_params annotate quiver contour barh stackplot subplots_adjust axhline axvline semilogx semilogy loglog polar streamplot hexbin pcolor tricontour errorbar clabel set_aspect violinplot set_axis_off spines text hatch plt axis plt.bar() plt.axis import figure pyplot highlight_text pypalettes plt.subplots() xlabel ylabel title legend colorbar savefig tight_layout grid set_xlim set_ylim plot scatter hist boxplot imshow cmap alpha bins tick_params annotate quiver contour barh stackplot subplots_adjust axhline axvline semilogx semilogy loglog polar streamplot hexbin pcolor tricontour errorbar clabel set_aspect violinplot set_axis_off spines text hatch plt axis plt.bar() plt.axis import figure pyplot highlight_text pypalettes plt.subplots() xlabel ylabel title legend colorbar savefig tight_layout grid set_xlim set_ylim plot scatter hist boxplot imshow cmap alpha bins tick_params annotate quiver contour barh stackplot subplots_adjust axhline axvline semilogx semilogy loglog polar streamplot hexbin pcolor tricontour errorbar clabel set_aspect violinplot set_axis_off spines text hatch plt axis plt.bar() plt.axis import figure pyplot highlight_text pypalettes plt.subplots() xlabel ylabel title legend colorbar savefig tight_layout grid set_xlim set_ylim plot scatter hist boxplot imshow cmap alpha bins tick_params annotate quiver contour barh stackplot subplots_adjust axhline axvline semilogx semilogy loglog polar streamplot hexbin pcolor tricontour errorbar clabel set_aspect violinplot set_axis_off spines text hatch plt axis plt.bar() plt.axis import figure pyplot highlight_text pypalettes plt.subplots() xlabel ylabel title legend colorbar savefig tight_layout grid set_xlim set_ylim plot scatter hist boxplot imshow cmap alpha bins tick_params annotate quiver contour barh stackplot subplots_adjust axhline axvline semilogx semilogy loglog polar streamplot hexbin pcolor tricontour errorbar clabel set_aspect violinplot set_axis_off spines text hatch plt axis plt.bar() plt.axis import figure pyplot highlight_text pypalettes plt.subplots() xlabel ylabel title legend colorbar savefig tight_layout grid set_xlim set_ylim plot scatter hist boxplot imshow cmap alpha bins tick_params annotate quiver contour barh stackplot subplots_adjust axhline axvline semilogx semilogy loglog polar streamplot hexbin pcolor tricontour errorbar clabel set_aspect violinplot set_axis_off spines text hatch plt axis plt.bar() plt.axis import figure pyplot highlight_text pypalettes plt.subplots() xlabel ylabel title legend colorbar savefig tight_layout grid set_xlim set_ylim plot scatter hist boxplot imshow cmap alpha bins tick_params annotate quiver contour barh stackplot subplots_adjust axhline axvline semilogx semilogy loglog polar streamplot hexbin pcolor tricontour errorbar clabel set_aspect violinplot set_axis_off spines text hatch plt axis plt.bar() plt.axis import figure pyplot highlight_text pypalettes plt.subplots() xlabel ylabel title legend colorbar savefig tight_layout grid set_xlim set_ylim plot scatter hist boxplot imshow cmap alpha bins tick_params annotate quiver contour barh stackplot subplots_adjust axhline axvline semilogx semilogy loglog polar streamplot hexbin pcolor tricontour errorbar clabel set_aspect violinplot set_axis_off spines text hatch plt axis plt.bar() plt.axis import figure pyplot highlight_text pypalettes plt.subplots() xlabel ylabel title legend colorbar savefig tight_layout grid set_xlim set_ylim plot scatter hist boxplot imshow cmap alpha bins tick_params annotate quiver contour barh stackplot subplots_adjust axhline axvline semilogx semilogy loglog polar streamplot hexbin pcolor tricontour errorbar clabel set_aspect violinplot set_axis_off spines text hatch plt axis plt.bar() plt.axis import figure pyplot highlight_text pypalettes plt.subplots() xlabel ylabel title legend colorbar savefig tight_layout grid set_xlim set_ylim plot scatter hist boxplot imshow cmap alpha bins tick_params annotate quiver contour barh stackplot subplots_adjust axhline axvline semilogx semilogy loglog polar streamplot hexbin pcolor tricontour errorbar clabel set_aspect violinplot set_axis_off spines text hatch plt axis plt.bar() plt.axis import figure pyplot highlight_text pypalettes plt.subplots() xlabel ylabel title legend colorbar savefig tight_layout grid set_xlim set_ylim plot scatter hist boxplot imshow cmap alpha bins tick_params annotate quiver contour barh stackplot subplots_adjust axhline axvline semilogx semilogy loglog polar streamplot hexbin pcolor tricontour errorbar clabel set_aspect violinplot set_axis_off spines text hatch plt axis plt.bar() plt.axis import figure pyplot highlight_text pypalettes plt.subplots() xlabel ylabel title legend colorbar savefig tight_layout grid set_xlim set_ylim plot scatter hist boxplot imshow cmap alpha bins tick_params annotate quiver contour barh stackplot subplots_adjust axhline axvline semilogx semilogy loglog polar streamplot hexbin pcolor tricontour errorbar clabel set_aspect violinplot set_axis_off spines text hatch plt axis plt.bar() plt.axis import figure pyplot highlight_text pypalettes plt.subplots() xlabel ylabel title legend colorbar savefig tight_layout grid set_xlim set_ylim plot scatter hist boxplot imshow cmap alpha bins tick_params annotate quiver contour barh stackplot subplots_adjust axhline axvline semilogx semilogy loglog polar streamplot hexbin pcolor tricontour errorbar clabel set_aspect violinplot set_axis_off spines text hatch plt axis plt.bar() plt.axis import figure pyplot highlight_text pypalettes plt.subplots() xlabel ylabel title legend colorbar savefig tight_layout grid set_xlim set_ylim plot scatter hist boxplot imshow cmap alpha bins tick_params annotate quiver contour barh stackplot subplots_adjust axhline axvline semilogx semilogy loglog polar streamplot hexbin pcolor tricontour errorbar clabel set_aspect violinplot set_axis_off spines text hatch plt axis plt.bar() plt.axis import figure pyplot highlight_text pypalettes plt.subplots() xlabel ylabel title legend colorbar savefig tight_layout grid set_xlim set_ylim plot scatter hist boxplot imshow cmap alpha bins tick_params annotate quiver contour barh stackplot subplots_adjust axhline axvline semilogx semilogy loglog polar streamplot hexbin pcolor tricontour errorbar clabel set_aspect violinplot set_axis_off spines text hatch plt axis plt.bar() plt.axis import figure pyplot highlight_text pypalettes plt.subplots() xlabel ylabel title legend colorbar savefig tight_layout grid set_xlim set_ylim plot scatter hist boxplot imshow cmap alpha bins tick_params annotate quiver contour barh stackplot subplots_adjust axhline axvline semilogx semilogy loglog polar streamplot hexbin pcolor tricontour errorbar clabel set_aspect violinplot set_axis_off spines text hatch plt axis plt.bar() plt.axis import figure pyplot highlight_text pypalettes plt.subplots() xlabel ylabel title legend colorbar savefig tight_layout grid set_xlim set_ylim plot scatter hist boxplot imshow cmap alpha bins tick_params annotate quiver contour barh stackplot subplots_adjust axhline axvline semilogx semilogy loglog polar streamplot hexbin pcolor tricontour errorbar clabel set_aspect violinplot set_axis_off spines text hatch plt axis plt.bar() plt.axis import figure pyplot highlight_text pypalettes plt.subplots() xlabel ylabel title legend colorbar savefig tight_layout grid set_xlim set_ylim plot scatter hist boxplot imshow cmap alpha bins tick_params annotate quiver contour barh stackplot subplots_adjust axhline axvline semilogx semilogy loglog polar streamplot hexbin pcolor tricontour errorbar clabel set_aspect violinplot set_axis_off spines text hatch plt axis plt.bar() plt.axis import figure pyplot highlight_text pypalettes plt.subplots() xlabel ylabel title legend colorbar savefig tight_layout grid set_xlim set_ylim plot scatter hist boxplot imshow cmap alpha bins tick_params annotate quiver contour barh stackplot subplots_adjust axhline axvline semilogx semilogy loglog polar streamplot hexbin pcolor tricontour errorbar clabel set_aspect violinplot set_axis_off spines text hatch plt axis plt.bar() plt.axis import figure pyplot highlight_text pypalettes plt.subplots() xlabel ylabel title legend colorbar savefig tight_layout grid set_xlim set_ylim plot scatter hist boxplot imshow cmap alpha bins tick_params annotate quiver contour barh stackplot subplots_adjust axhline axvline semilogx semilogy loglog polar streamplot hexbin pcolor tricontour errorbar clabel set_aspect violinplot set_axis_off spines text hatch plt axis plt.bar() plt.axis import figure pyplot highlight_text pypalettes plt.subplots() xlabel ylabel title legend colorbar savefig tight_layout grid set_xlim set_ylim plot scatter hist boxplot imshow cmap alpha bins tick_params annotate quiver contour barh stackplot subplots_adjust axhline axvline semilogx semilogy loglog polar streamplot hexbin pcolor tricontour errorbar clabel set_aspect violinplot set_axis_off spines text hatch plt axis plt.bar() plt.axis import figure pyplot highlight_text pypalettes plt.subplots() xlabel ylabel title legend colorbar savefig tight_layout grid set_xlim set_ylim plot scatter hist boxplot imshow cmap alpha bins tick_params annotate quiver contour barh stackplot subplots_adjust axhline axvline semilogx semilogy loglog polar streamplot hexbin pcolor tricontour errorbar clabel set_aspect violinplot set_axis_off spines text hatch plt axis plt.bar() plt.axis import figure pyplot highlight_text pypalettes plt.subplots() xlabel ylabel title legend colorbar savefig tight_layout grid set_xlim set_ylim plot scatter hist boxplot imshow cmap alpha bins tick_params annotate quiver contour barh stackplot subplots_adjust axhline axvline semilogx semilogy loglog polar streamplot hexbin pcolor tricontour errorbar clabel set_aspect violinplot set_axis_off spines text hatch plt axis plt.bar() plt.axis import figure pyplot highlight_text pypalettes plt.subplots() xlabel ylabel title legend colorbar savefig tight_layout grid set_xlim set_ylim plot scatter hist boxplot imshow cmap alpha bins tick_params annotate quiver contour barh stackplot subplots_adjust axhline axvline semilogx semilogy loglog polar streamplot hexbin pcolor tricontour errorbar clabel set_aspect violinplot set_axis_off spines text hatch plt axis plt.bar() plt.axis import figure pyplot highlight_text pypalettes plt.subplots() xlabel ylabel title legend colorbar savefig tight_layout grid set_xlim set_ylim plot scatter hist boxplot imshow cmap alpha bins tick_params annotate quiver contour barh stackplot subplots_adjust axhline axvline semilogx semilogy loglog polar streamplot hexbin pcolor tricontour errorbar clabel set_aspect violinplot set_axis_off spines text hatch plt axis plt.bar() plt.axis import figure pyplot highlight_text pypalettes plt.subplots() xlabel ylabel title legend colorbar savefig tight_layout grid set_xlim set_ylim plot scatter hist boxplot imshow cmap alpha bins tick_params annotate quiver contour barh stackplot subplots_adjust axhline axvline semilogx semilogy loglog polar streamplot hexbin pcolor tricontour errorbar clabel set_aspect violinplot set_axis_off spines text hatch plt axis plt.bar() plt.axis import figure pyplot highlight_text pypalettes plt.subplots() xlabel ylabel title legend colorbar savefig tight_layout grid set_xlim set_ylim plot scatter hist boxplot imshow cmap alpha bins tick_params annotate quiver contour barh stackplot subplots_adjust axhline axvline semilogx semilogy loglog polar streamplot hexbin pcolor tricontour errorbar clabel set_aspect violinplot set_axis_off spines text hatch plt axis plt.bar() plt.axis import figure pyplot highlight_text pypalettes plt.subplots() xlabel ylabel title legend colorbar savefig tight_layout grid set_xlim set_ylim plot scatter hist boxplot imshow cmap alpha bins tick_params annotate quiver contour barh stackplot subplots_adjust axhline axvline semilogx semilogy loglog polar streamplot hexbin pcolor tricontour errorbar clabel set_aspect violinplot set_axis_off spines text hatch plt axis plt.bar() plt.axis import figure pyplot highlight_text pypalettes plt.subplots() xlabel ylabel title legend colorbar savefig tight_layout grid set_xlim set_ylim plot scatter hist boxplot imshow cmap alpha bins tick_params annotate quiver contour barh stackplot subplots_adjust axhline axvline semilogx semilogy loglog polar streamplot hexbin pcolor tricontour errorbar clabel set_aspect violinplot set_axis_off spines text hatch plt axis plt.bar() plt.axis import figure pyplot highlight_text pypalettes plt.subplots() xlabel ylabel title legend colorbar savefig tight_layout grid set_xlim set_ylim plot scatter hist boxplot imshow cmap alpha bins tick_params annotate quiver contour barh stackplot subplots_adjust axhline axvline semilogx semilogy loglog polar streamplot hexbin pcolor tricontour errorbar clabel set_aspect violinplot set_axis_off spines text hatch plt axis plt.bar() plt.axis import figure pyplot highlight_text pypalettes plt.subplots() xlabel ylabel title legend colorbar savefig tight_layout grid set_xlim set_ylim plot scatter hist boxplot imshow cmap alpha bins tick_params annotate quiver contour barh stackplot subplots_adjust axhline axvline semilogx semilogy loglog polar streamplot hexbin pcolor tricontour errorbar clabel set_aspect violinplot set_axis_off spines text hatch plt axis plt.bar() plt.axis import figure pyplot highlight_text pypalettes plt.subplots() xlabel ylabel title legend colorbar savefig tight_layout grid set_xlim set_ylim plot scatter hist boxplot imshow cmap alpha bins tick_params annotate quiver contour barh stackplot subplots_adjust axhline axvline semilogx semilogy loglog polar streamplot hexbin pcolor tricontour errorbar clabel set_aspect violinplot set_axis_off spines text hatch plt axis plt.bar() plt.axis import figure pyplot highlight_text pypalettes plt.subplots() xlabel ylabel title legend colorbar savefig tight_layout grid set_xlim set_ylim plot scatter hist boxplot imshow cmap alpha bins tick_params annotate quiver contour barh stackplot subplots_adjust axhline axvline semilogx semilogy loglog polar streamplot hexbin pcolor tricontour errorbar clabel set_aspect violinplot set_axis_off spines text hatch plt axis plt.bar() plt.axis import figure pyplot highlight_text pypalettes plt.subplots() xlabel ylabel title legend colorbar savefig tight_layout grid set_xlim set_ylim plot scatter hist boxplot imshow cmap alpha bins tick_params annotate quiver contour barh stackplot subplots_adjust axhline axvline semilogx semilogy loglog polar streamplot hexbin pcolor tricontour errorbar clabel set_aspect violinplot set_axis_off spines text hatch plt axis plt.bar() plt.axis import figure pyplot highlight_text pypalettes plt.subplots() xlabel ylabel title legend colorbar savefig tight_layout grid set_xlim set_ylim plot scatter hist boxplot imshow cmap alpha bins tick_params annotate quiver contour barh stackplot subplots_adjust axhline axvline semilogx semilogy loglog polar streamplot hexbin pcolor tricontour errorbar clabel set_aspect violinplot set_axis_off spines text hatch plt axis plt.bar() plt.axis import figure pyplot highlight_text pypalettes plt.subplots() xlabel ylabel title legend colorbar savefig tight_layout grid set_xlim set_ylim plot scatter hist boxplot imshow cmap alpha bins tick_params annotate quiver contour barh stackplot subplots_adjust axhline axvline semilogx semilogy loglog polar streamplot hexbin pcolor tricontour errorbar clabel set_aspect violinplot set_axis_off spines text hatch plt axis plt.bar() plt.axis import figure pyplot highlight_text pypalettes plt.subplots() xlabel ylabel title legend colorbar savefig tight_layout grid set_xlim set_ylim plot scatter hist boxplot imshow cmap alpha bins tick_params annotate quiver contour barh stackplot subplots_adjust axhline axvline semilogx semilogy loglog polar streamplot hexbin pcolor tricontour errorbar clabel set_aspect violinplot set_axis_off spines text hatch plt axis plt.bar() plt.axis import figure pyplot highlight_text pypalettes plt.subplots() xlabel ylabel title legend colorbar savefig tight_layout grid set_xlim set_ylim plot scatter hist boxplot imshow cmap alpha bins tick_params annotate quiver contour barh stackplot subplots_adjust axhline axvline semilogx semilogy loglog polar streamplot hexbin pcolor tricontour errorbar clabel set_aspect violinplot set_axis_off spines text hatch plt axis plt.bar() plt.axis import figure pyplot highlight_text pypalettes plt.subplots() xlabel ylabel title legend colorbar savefig tight_layout grid set_xlim set_ylim plot scatter hist boxplot imshow cmap alpha bins tick_params annotate quiver contour barh stackplot subplots_adjust axhline axvline semilogx semilogy loglog polar streamplot hexbin pcolor tricontour errorbar clabel set_aspect violinplot set_axis_off spines text hatch plt axis plt.bar() plt.axis import figure pyplot highlight_text pypalettes plt.subplots() xlabel ylabel title legend colorbar savefig tight_layout grid set_xlim set_ylim plot scatter hist boxplot imshow cmap alpha bins tick_params annotate quiver contour barh stackplot subplots_adjust axhline axvline semilogx semilogy loglog polar streamplot hexbin pcolor tricontour errorbar clabel set_aspect violinplot set_axis_off spines text hatch plt axis plt.bar() plt.axis import figure pyplot highlight_text pypalettes plt.subplots() xlabel ylabel title legend colorbar savefig tight_layout grid set_xlim set_ylim plot scatter hist boxplot imshow cmap alpha bins tick_params annotate quiver contour barh stackplot subplots_adjust axhline axvline semilogx semilogy loglog polar streamplot hexbin pcolor tricontour errorbar clabel set_aspect violinplot set_axis_off spines text hatch plt axis plt.bar() plt.axis import figure pyplot highlight_text pypalettes plt.subplots() xlabel ylabel title legend colorbar savefig tight_layout grid set_xlim set_ylim plot scatter hist boxplot imshow cmap alpha bins tick_params annotate quiver contour barh stackplot subplots_adjust axhline axvline semilogx semilogy loglog polar streamplot hexbin pcolor tricontour errorbar clabel set_aspect violinplot set_axis_off spines text hatch plt axis plt.bar() plt.axis import figure pyplot highlight_text pypalettes plt.subplots() xlabel ylabel title legend colorbar savefig tight_layout grid set_xlim set_ylim plot scatter hist boxplot imshow cmap alpha bins tick_params annotate quiver contour barh stackplot subplots_adjust axhline axvline semilogx semilogy loglog polar streamplot hexbin pcolor tricontour errorbar clabel set_aspect violinplot set_axis_off spines text hatch plt axis plt.bar() plt.axis import figure pyplot highlight_text pypalettes plt.subplots() xlabel ylabel title legend colorbar savefig tight_layout grid set_xlim set_ylim plot scatter hist boxplot imshow cmap alpha bins tick_params annotate quiver contour barh stackplot subplots_adjust axhline axvline semilogx semilogy loglog polar streamplot hexbin pcolor tricontour errorbar clabel set_aspect violinplot set_axis_off spines text hatch plt axis plt.bar() plt.axis import figure pyplot highlight_text pypalettes plt.subplots() xlabel ylabel title legend colorbar savefig tight_layout grid set_xlim set_ylim plot scatter hist boxplot imshow cmap alpha bins tick_params annotate quiver contour barh stackplot subplots_adjust axhline axvline semilogx semilogy loglog polar streamplot hexbin pcolor tricontour errorbar clabel set_aspect violinplot set_axis_off spines text hatch plt axis plt.bar() plt.axis import figure pyplot highlight_text pypalettes plt.subplots() xlabel ylabel title legend colorbar savefig tight_layout grid set_xlim set_ylim plot scatter hist boxplot imshow cmap alpha bins tick_params annotate quiver contour barh stackplot subplots_adjust axhline axvline semilogx semilogy loglog polar streamplot hexbin pcolor tricontour errorbar clabel set_aspect violinplot set_axis_off spines text hatch plt axis plt.bar() plt.axis import figure pyplot highlight_text pypalettes plt.subplots() xlabel ylabel title legend colorbar savefig tight_layout grid set_xlim set_ylim plot scatter hist boxplot imshow cmap alpha bins tick_params annotate quiver contour barh stackplot subplots_adjust axhline axvline semilogx semilogy loglog polar streamplot hexbin pcolor tricontour errorbar clabel set_aspect violinplot set_axis_off spines text hatch plt axis plt.bar() plt.axis import figure pyplot highlight_text pypalettes plt.subplots() xlabel ylabel title legend colorbar savefig tight_layout grid set_xlim set_ylim plot scatter hist boxplot imshow cmap alpha bins tick_params annotate quiver contour barh stackplot subplots_adjust axhline axvline semilogx semilogy loglog polar streamplot hexbin pcolor tricontour errorbar clabel set_aspect violinplot set_axis_off spines text hatch plt axis plt.bar() plt.axis import figure pyplot highlight_text pypalettes plt.subplots() xlabel ylabel title legend colorbar savefig tight_layout grid set_xlim set_ylim plot scatter hist boxplot imshow cmap alpha bins tick_params annotate quiver contour barh stackplot subplots_adjust axhline axvline semilogx semilogy loglog polar streamplot hexbin pcolor tricontour errorbar clabel set_aspect violinplot set_axis_off spines text hatch plt axis plt.bar() plt.axis import figure pyplot highlight_text pypalettes plt.subplots() xlabel ylabel title legend colorbar savefig tight_layout grid set_xlim set_ylim plot scatter hist boxplot imshow cmap alpha bins tick_params annotate quiver contour barh stackplot subplots_adjust axhline axvline semilogx semilogy loglog polar streamplot hexbin pcolor tricontour errorbar clabel set_aspect violinplot set_axis_off spines text hatch plt axis plt.bar() plt.axis import figure pyplot highlight_text pypalettes plt.subplots() xlabel ylabel title legend colorbar savefig tight_layout grid set_xlim set_ylim plot scatter hist boxplot imshow cmap alpha bins tick_params annotate quiver contour barh stackplot subplots_adjust axhline axvline semilogx semilogy loglog polar streamplot hexbin pcolor tricontour errorbar clabel set_aspect violinplot set_axis_off spines text hatch plt axis plt.bar() plt.axis import figure pyplot highlight_text pypalettes plt.subplots() xlabel ylabel title legend colorbar savefig tight_layout grid set_xlim set_ylim plot scatter hist boxplot imshow cmap alpha bins tick_params annotate quiver contour barh stackplot subplots_adjust axhline axvline semilogx semilogy loglog polar streamplot hexbin pcolor tricontour errorbar clabel set_aspect violinplot set_axis_off spines text hatch plt axis plt.bar() plt.axis import figure pyplot highlight_text pypalettes plt.subplots() xlabel ylabel title legend colorbar savefig tight_layout grid set_xlim set_ylim plot scatter hist boxplot imshow cmap alpha bins tick_params annotate quiver contour barh stackplot subplots_adjust axhline axvline semilogx semilogy loglog polar streamplot hexbin pcolor tricontour errorbar clabel set_aspect violinplot set_axis_off spines text hatch plt axis plt.bar() plt.axis import figure pyplot highlight_text pypalettes plt.subplots() xlabel ylabel title legend colorbar savefig tight_layout grid set_xlim set_ylim plot scatter hist boxplot imshow cmap alpha bins tick_params annotate quiver contour barh stackplot subplots_adjust axhline axvline semilogx semilogy loglog polar streamplot hexbin pcolor tricontour errorbar clabel set_aspect violinplot set_axis_off spines text hatch plt axis plt.bar() plt.axis import figure pyplot highlight_text pypalettes plt.subplots() xlabel ylabel title legend colorbar savefig tight_layout grid set_xlim set_ylim plot scatter hist boxplot imshow cmap alpha bins tick_params annotate quiver contour barh stackplot subplots_adjust axhline axvline semilogx semilogy loglog polar streamplot hexbin pcolor tricontour errorbar clabel set_aspect violinplot set_axis_off spines text hatch plt axis plt.bar() plt.axis import figure pyplot highlight_text pypalettes plt.subplots() xlabel ylabel title legend colorbar savefig tight_layout grid set_xlim set_ylim plot scatter hist boxplot imshow cmap alpha bins tick_params annotate quiver contour barh stackplot subplots_adjust axhline axvline semilogx semilogy loglog polar streamplot hexbin pcolor tricontour errorbar clabel set_aspect violinplot set_axis_off spines text hatch plt axis plt.bar() plt.axis import figure pyplot highlight_text pypalettes plt.subplots() xlabel ylabel title legend colorbar savefig tight_layout grid set_xlim set_ylim plot scatter hist boxplot imshow cmap alpha bins tick_params annotate quiver contour barh stackplot subplots_adjust axhline axvline semilogx semilogy loglog polar streamplot hexbin pcolor tricontour errorbar clabel set_aspect violinplot set_axis_off spines text hatch plt axis plt.bar() plt.axis import figure pyplot highlight_text pypalettes plt.subplots() xlabel ylabel title legend colorbar savefig tight_layout grid set_xlim set_ylim plot scatter hist boxplot imshow cmap alpha bins tick_params annotate quiver contour barh stackplot subplots_adjust axhline axvline semilogx semilogy loglog polar streamplot hexbin pcolor tricontour errorbar clabel set_aspect violinplot set_axis_off spines text hatch plt axis plt.bar() plt.axis import figure pyplot highlight_text pypalettes plt.subplots() xlabel ylabel title legend colorbar savefig tight_layout grid set_xlim set_ylim plot scatter hist boxplot imshow cmap alpha bins tick_params annotate quiver contour barh stackplot subplots_adjust axhline axvline semilogx semilogy loglog polar streamplot hexbin pcolor tricontour errorbar clabel set_aspect violinplot set_axis_off spines text hatch plt axis plt.bar() plt.axis import figure pyplot highlight_text pypalettes plt.subplots() xlabel ylabel title legend colorbar savefig tight_layout grid set_xlim set_ylim plot scatter hist boxplot imshow cmap alpha bins tick_params annotate quiver contour barh stackplot subplots_adjust axhline axvline semilogx semilogy loglog polar streamplot hexbin pcolor tricontour errorbar clabel set_aspect violinplot set_axis_off spines text hatch plt axis plt.bar() plt.axis import figure pyplot highlight_text pypalettes plt.subplots() xlabel ylabel title legend colorbar savefig tight_layout grid set_xlim set_ylim plot scatter hist boxplot imshow cmap alpha bins tick_params annotate quiver contour barh stackplot subplots_adjust axhline axvline semilogx semilogy loglog polar streamplot hexbin pcolor tricontour errorbar clabel set_aspect violinplot set_axis_off spines text hatch plt axis plt.bar() plt.axis import figure pyplot highlight_text pypalettes plt.subplots() xlabel ylabel title legend colorbar savefig tight_layout grid set_xlim set_ylim plot scatter hist boxplot imshow cmap alpha bins tick_params annotate quiver contour barh stackplot subplots_adjust axhline axvline semilogx semilogy loglog polar streamplot hexbin pcolor tricontour errorbar clabel set_aspect violinplot set_axis_off spines text hatch plt axis plt.bar() plt.axis import figure pyplot highlight_text pypalettes plt.subplots() xlabel ylabel title legend colorbar savefig tight_layout grid set_xlim set_ylim plot scatter hist boxplot imshow cmap alpha bins tick_params annotate quiver contour barh stackplot subplots_adjust axhline axvline semilogx semilogy loglog polar streamplot hexbin pcolor tricontour errorbar clabel set_aspect violinplot set_axis_off spines text hatch plt axis plt.bar() plt.axis import figure pyplot highlight_text pypalettes plt.subplots() xlabel ylabel title legend colorbar savefig tight_layout grid set_xlim set_ylim plot scatter hist boxplot imshow cmap alpha bins tick_params annotate quiver contour barh stackplot subplots_adjust axhline axvline semilogx semilogy loglog polar streamplot hexbin pcolor tricontour errorbar clabel set_aspect violinplot set_axis_off spines text hatch plt axis plt.bar() plt.axis import figure pyplot highlight_text pypalettes plt.subplots() xlabel ylabel title legend colorbar savefig tight_layout grid set_xlim set_ylim plot scatter hist boxplot imshow cmap alpha bins tick_params annotate quiver contour barh stackplot subplots_adjust axhline axvline semilogx semilogy loglog polar streamplot hexbin pcolor tricontour errorbar clabel set_aspect violinplot set_axis_off spines text hatch plt axis plt.bar() plt.axis import figure pyplot highlight_text pypalettes plt.subplots() xlabel ylabel title legend colorbar savefig tight_layout grid set_xlim set_ylim plot scatter hist boxplot imshow cmap alpha bins tick_params annotate quiver contour barh stackplot subplots_adjust axhline axvline semilogx semilogy loglog polar streamplot hexbin pcolor tricontour errorbar clabel set_aspect violinplot set_axis_off spines text hatch plt axis plt.bar() plt.axis import figure pyplot highlight_text pypalettes plt.subplots() xlabel ylabel title legend colorbar savefig tight_layout grid set_xlim set_ylim plot scatter hist boxplot imshow cmap alpha bins tick_params annotate quiver contour barh stackplot subplots_adjust axhline axvline semilogx semilogy loglog polar streamplot hexbin pcolor tricontour errorbar clabel set_aspect violinplot set_axis_off spines text hatch plt axis plt.bar() plt.axis import figure pyplot highlight_text pypalettes plt.subplots() xlabel ylabel title legend colorbar savefig tight_layout grid set_xlim set_ylim plot scatter hist boxplot imshow cmap alpha bins tick_params annotate quiver contour barh stackplot subplots_adjust axhline axvline semilogx semilogy loglog polar streamplot hexbin pcolor tricontour errorbar clabel set_aspect violinplot set_axis_off spines text hatch plt axis plt.bar() plt.axis import figure pyplot highlight_text pypalettes plt.subplots() xlabel ylabel title legend colorbar savefig tight_layout grid set_xlim set_ylim plot scatter hist boxplot imshow cmap alpha bins tick_params annotate quiver contour barh stackplot subplots_adjust axhline axvline semilogx semilogy loglog polar streamplot hexbin pcolor tricontour errorbar clabel set_aspect violinplot set_axis_off spines text hatch plt axis plt.bar() plt.axis import figure pyplot highlight_text pypalettes plt.subplots() xlabel ylabel title legend colorbar savefig tight_layout grid set_xlim set_ylim plot scatter hist boxplot imshow cmap alpha bins tick_params annotate quiver contour barh stackplot subplots_adjust axhline axvline semilogx semilogy loglog polar streamplot hexbin pcolor tricontour errorbar clabel set_aspect violinplot set_axis_off spines text hatch plt axis plt.bar() plt.axis import figure pyplot highlight_text pypalettes plt.subplots() xlabel ylabel title legend colorbar savefig tight_layout grid set_xlim set_ylim plot scatter hist boxplot imshow cmap alpha bins tick_params annotate quiver contour barh stackplot subplots_adjust axhline axvline semilogx semilogy loglog polar streamplot hexbin pcolor tricontour errorbar clabel set_aspect violinplot set_axis_off spines text hatch plt axis plt.bar() plt.axis import figure pyplot highlight_text pypalettes plt.subplots() xlabel ylabel title legend colorbar savefig tight_layout grid set_xlim set_ylim plot scatter hist boxplot imshow cmap alpha bins tick_params annotate quiver contour barh stackplot subplots_adjust axhline axvline semilogx semilogy loglog polar streamplot hexbin pcolor tricontour errorbar clabel set_aspect violinplot set_axis_off spines text hatch plt axis plt.bar() plt.axis import figure pyplot highlight_text pypalettes plt.subplots() xlabel ylabel title legend colorbar savefig tight_layout grid set_xlim set_ylim plot scatter hist boxplot imshow cmap alpha bins tick_params annotate quiver contour barh stackplot subplots_adjust axhline axvline semilogx semilogy loglog polar streamplot hexbin pcolor tricontour errorbar clabel set_aspect violinplot set_axis_off spines text hatch plt axis plt.bar() plt.axis import figure pyplot highlight_text pypalettes plt.subplots() xlabel ylabel title legend colorbar savefig tight_layout grid set_xlim set_ylim plot scatter hist boxplot imshow cmap alpha bins tick_params annotate quiver contour barh stackplot subplots_adjust axhline axvline semilogx semilogy loglog polar streamplot hexbin pcolor tricontour errorbar clabel set_aspect violinplot set_axis_off spines text hatch plt axis plt.bar() plt.axis import figure pyplot highlight_text pypalettes plt.subplots() xlabel ylabel title legend colorbar savefig tight_layout grid set_xlim set_ylim plot scatter hist boxplot imshow cmap alpha bins tick_params annotate quiver contour barh stackplot subplots_adjust axhline axvline semilogx semilogy loglog polar streamplot hexbin pcolor tricontour errorbar clabel set_aspect violinplot set_axis_off spines text hatch plt axis plt.bar() plt.axis import figure pyplot highlight_text pypalettes plt.subplots() xlabel ylabel title legend colorbar savefig tight_layout grid set_xlim set_ylim plot scatter hist boxplot imshow cmap alpha bins tick_params annotate quiver contour barh stackplot subplots_adjust axhline axvline semilogx semilogy loglog polar streamplot hexbin pcolor tricontour errorbar clabel set_aspect violinplot set_axis_off spines text hatch plt axis plt.bar() plt.axis import figure pyplot highlight_text pypalettes plt.subplots() xlabel ylabel title legend colorbar savefig tight_layout grid set_xlim set_ylim plot scatter hist boxplot imshow cmap alpha bins tick_params annotate quiver contour barh stackplot subplots_adjust axhline axvline semilogx semilogy loglog polar streamplot hexbin pcolor tricontour errorbar clabel set_aspect violinplot set_axis_off spines text hatch plt axis plt.bar() plt.axis import figure pyplot highlight_text pypalettes plt.subplots() xlabel ylabel title legend colorbar savefig tight_layout grid set_xlim set_ylim plot scatter hist boxplot imshow cmap alpha bins tick_params annotate quiver contour barh stackplot subplots_adjust axhline axvline semilogx semilogy loglog polar streamplot hexbin pcolor tricontour errorbar clabel set_aspect violinplot set_axis_off spines text hatch plt axis plt.bar() plt.axis import figure pyplot highlight_text pypalettes plt.subplots() xlabel ylabel title legend colorbar savefig tight_layout grid set_xlim set_ylim plot scatter hist boxplot imshow cmap alpha bins tick_params annotate quiver contour barh stackplot subplots_adjust axhline axvline semilogx semilogy loglog polar streamplot hexbin pcolor tricontour errorbar clabel set_aspect violinplot set_axis_off spines text hatch plt axis plt.bar() plt.axis import figure pyplot highlight_text pypalettes plt.subplots() xlabel ylabel title legend colorbar savefig tight_layout grid set_xlim set_ylim plot scatter hist boxplot imshow cmap alpha bins tick_params annotate quiver contour barh stackplot subplots_adjust axhline axvline semilogx semilogy loglog polar streamplot hexbin pcolor tricontour errorbar clabel set_aspect violinplot set_axis_off spines text hatch plt axis plt.bar() plt.axis import figure pyplot highlight_text pypalettes plt.subplots() xlabel ylabel title legend colorbar savefig tight_layout grid set_xlim set_ylim plot scatter hist boxplot imshow cmap alpha bins tick_params annotate quiver contour barh stackplot subplots_adjust axhline axvline semilogx semilogy loglog polar streamplot hexbin pcolor tricontour errorbar clabel set_aspect violinplot set_axis_off spines text hatch plt axis plt.bar() plt.axis import figure pyplot highlight_text pypalettes plt.subplots() xlabel ylabel title legend colorbar savefig tight_layout grid set_xlim set_ylim plot scatter hist boxplot imshow cmap alpha bins tick_params annotate quiver contour barh stackplot subplots_adjust axhline axvline semilogx semilogy loglog polar streamplot hexbin pcolor tricontour errorbar clabel set_aspect violinplot set_axis_off spines text hatch plt axis plt.bar() plt.axis import figure pyplot highlight_text pypalettes plt.subplots() xlabel ylabel title legend colorbar savefig tight_layout grid set_xlim set_ylim plot scatter hist boxplot imshow cmap alpha bins tick_params annotate quiver contour barh stackplot subplots_adjust axhline axvline semilogx semilogy loglog polar streamplot hexbin pcolor tricontour errorbar clabel set_aspect violinplot set_axis_off spines text hatch plt axis plt.bar() plt.axis import figure pyplot highlight_text pypalettes plt.subplots() xlabel ylabel title legend colorbar savefig tight_layout grid set_xlim set_ylim plot scatter hist boxplot imshow cmap alpha bins tick_params annotate quiver contour barh stackplot subplots_adjust axhline axvline semilogx semilogy loglog polar streamplot hexbin pcolor tricontour errorbar clabel set_aspect violinplot set_axis_off spines text hatch plt axis plt.bar() plt.axis import figure pyplot highlight_text pypalettes plt.subplots() xlabel ylabel title legend colorbar savefig tight_layout grid set_xlim set_ylim plot scatter hist boxplot imshow cmap alpha bins tick_params annotate quiver contour barh stackplot subplots_adjust axhline axvline semilogx semilogy loglog polar streamplot hexbin pcolor tricontour errorbar clabel set_aspect violinplot set_axis_off spines text hatch plt axis plt.bar() plt.axis import figure pyplot highlight_text pypalettes plt.subplots() xlabel ylabel title legend colorbar savefig tight_layout grid set_xlim set_ylim plot scatter hist boxplot imshow cmap alpha bins tick_params annotate quiver contour barh stackplot subplots_adjust axhline axvline semilogx semilogy loglog polar streamplot hexbin pcolor tricontour errorbar clabel set_aspect violinplot set_axis_off spines text hatch plt axis plt.bar() plt.axis import figure pyplot highlight_text pypalettes plt.subplots() xlabel ylabel title legend colorbar savefig tight_layout grid set_xlim set_ylim plot scatter hist boxplot imshow cmap alpha bins tick_params annotate quiver contour barh stackplot subplots_adjust axhline axvline semilogx semilogy loglog polar streamplot hexbin pcolor tricontour errorbar clabel set_aspect violinplot set_axis_off spines text hatch plt axis plt.bar() plt.axis import figure pyplot highlight_text pypalettes plt.subplots() xlabel ylabel title legend colorbar savefig tight_layout grid set_xlim set_ylim plot scatter hist boxplot imshow cmap alpha bins tick_params annotate quiver contour barh stackplot subplots_adjust axhline axvline semilogx semilogy loglog polar streamplot hexbin pcolor tricontour errorbar clabel set_aspect violinplot set_axis_off spines text hatch plt axis plt.bar() plt.axis import figure pyplot highlight_text pypalettes plt.subplots() xlabel ylabel title legend colorbar savefig tight_layout grid set_xlim set_ylim plot scatter hist boxplot imshow cmap alpha bins tick_params annotate quiver contour barh stackplot subplots_adjust axhline axvline semilogx semilogy loglog polar streamplot hexbin pcolor tricontour errorbar clabel set_aspect violinplot set_axis_off spines text hatch plt axis plt.bar() plt.axis import figure pyplot highlight_text pypalettes plt.subplots() xlabel ylabel title legend colorbar savefig tight_layout grid set_xlim set_ylim plot scatter hist boxplot imshow cmap alpha bins tick_params annotate quiver contour barh stackplot subplots_adjust axhline axvline semilogx semilogy loglog polar streamplot hexbin pcolor tricontour errorbar clabel set_aspect violinplot set_axis_off spines text hatch plt axis plt.bar() plt.axis import figure pyplot highlight_text pypalettes plt.subplots() xlabel ylabel title legend colorbar savefig tight_layout grid set_xlim set_ylim plot scatter hist boxplot imshow cmap alpha bins tick_params annotate quiver contour barh stackplot subplots_adjust axhline axvline semilogx semilogy loglog polar streamplot hexbin pcolor tricontour errorbar clabel set_aspect violinplot set_axis_off spines text hatch plt axis plt.bar() plt.axis import figure pyplot highlight_text pypalettes plt.subplots() xlabel ylabel title legend colorbar savefig tight_layout grid set_xlim set_ylim plot scatter hist boxplot imshow cmap alpha bins tick_params annotate quiver contour barh stackplot subplots_adjust axhline axvline semilogx semilogy loglog polar streamplot hexbin pcolor tricontour errorbar clabel set_aspect violinplot set_axis_off spines text hatch plt axis plt.bar() plt.axis import figure pyplot highlight_text pypalettes plt.subplots() xlabel ylabel title legend colorbar savefig tight_layout grid set_xlim set_ylim plot scatter hist boxplot imshow cmap alpha bins tick_params annotate quiver contour barh stackplot subplots_adjust axhline axvline semilogx semilogy loglog polar streamplot hexbin pcolor tricontour errorbar clabel set_aspect violinplot set_axis_off spines text hatch plt axis plt.bar() plt.axis import figure pyplot highlight_text pypalettes plt.subplots() xlabel ylabel title legend colorbar savefig tight_layout grid set_xlim set_ylim plot scatter hist boxplot imshow cmap alpha bins tick_params annotate quiver contour barh stackplot subplots_adjust axhline axvline semilogx semilogy loglog polar streamplot hexbin pcolor tricontour errorbar clabel set_aspect violinplot set_axis_off spines text hatch plt axis plt.bar() plt.axis import figure pyplot highlight_text pypalettes plt.subplots() xlabel ylabel title legend colorbar savefig tight_layout grid set_xlim set_ylim plot scatter hist boxplot imshow cmap alpha bins tick_params annotate quiver contour barh stackplot subplots_adjust axhline axvline semilogx semilogy loglog polar streamplot hexbin pcolor tricontour errorbar clabel set_aspect violinplot set_axis_off spines text hatch plt axis plt.bar() plt.axis import figure pyplot highlight_text pypalettes plt.subplots() xlabel ylabel title legend colorbar savefig tight_layout grid set_xlim set_ylim plot scatter hist boxplot imshow cmap alpha bins tick_params annotate quiver contour barh stackplot subplots_adjust axhline axvline semilogx semilogy loglog polar streamplot hexbin pcolor tricontour errorbar clabel set_aspect violinplot set_axis_off spines text hatch plt axis plt.bar() plt.axis import figure pyplot highlight_text pypalettes plt.subplots() xlabel ylabel title legend colorbar savefig tight_layout grid set_xlim set_ylim plot scatter hist boxplot imshow cmap alpha bins tick_params annotate quiver contour barh stackplot subplots_adjust axhline axvline semilogx semilogy loglog polar streamplot hexbin pcolor tricontour errorbar clabel set_aspect violinplot set_axis_off spines text hatch plt axis plt.bar() plt.axis import figure pyplot highlight_text pypalettes plt.subplots() xlabel ylabel title legend colorbar savefig tight_layout grid set_xlim set_ylim plot scatter hist boxplot imshow cmap alpha bins tick_params annotate quiver contour barh stackplot subplots_adjust axhline axvline semilogx semilogy loglog polar streamplot hexbin pcolor tricontour errorbar clabel set_aspect violinplot set_axis_off spines text hatch plt axis plt.bar() plt.axis import figure pyplot highlight_text pypalettes plt.subplots() xlabel ylabel title legend colorbar savefig tight_layout grid set_xlim set_ylim plot scatter hist boxplot imshow cmap alpha bins tick_params annotate quiver contour barh stackplot subplots_adjust axhline axvline semilogx semilogy loglog polar streamplot hexbin pcolor tricontour errorbar clabel set_aspect violinplot set_axis_off spines text hatch plt axis plt.bar() plt.axis import figure pyplot highlight_text pypalettes plt.subplots() xlabel ylabel title legend colorbar savefig tight_layout grid set_xlim set_ylim plot scatter hist boxplot imshow cmap alpha bins tick_params annotate quiver contour barh stackplot subplots_adjust axhline axvline semilogx semilogy loglog polar streamplot hexbin pcolor tricontour errorbar clabel set_aspect violinplot set_axis_off spines text hatch plt axis plt.bar() plt.axis import figure pyplot highlight_text pypalettes plt.subplots() xlabel ylabel title legend colorbar savefig tight_layout grid set_xlim set_ylim plot scatter hist boxplot imshow cmap alpha bins tick_params annotate quiver contour barh stackplot subplots_adjust axhline axvline semilogx semilogy loglog polar streamplot hexbin pcolor tricontour errorbar clabel set_aspect violinplot set_axis_off spines text hatch plt axis plt.bar() plt.axis import figure pyplot highlight_text pypalettes plt.subplots() xlabel ylabel title legend colorbar savefig tight_layout grid set_xlim set_ylim plot scatter hist boxplot imshow cmap alpha bins tick_params annotate quiver contour barh stackplot subplots_adjust axhline axvline semilogx semilogy loglog polar streamplot hexbin pcolor tricontour errorbar clabel set_aspect violinplot set_axis_off spines text hatch plt axis plt.bar() plt.axis import figure pyplot highlight_text pypalettes plt.subplots() xlabel ylabel title legend colorbar savefig tight_layout grid set_xlim set_ylim plot scatter hist boxplot imshow cmap alpha bins tick_params annotate quiver contour barh stackplot subplots_adjust axhline axvline semilogx semilogy loglog polar streamplot hexbin pcolor tricontour errorbar clabel set_aspect violinplot set_axis_off spines text hatch plt axis plt.bar() plt.axis import figure pyplot highlight_text pypalettes plt.subplots() xlabel ylabel title legend colorbar savefig tight_layout grid set_xlim set_ylim plot scatter hist boxplot imshow cmap alpha bins tick_params annotate quiver contour barh stackplot subplots_adjust axhline axvline semilogx semilogy loglog polar streamplot hexbin pcolor tricontour errorbar clabel set_aspect violinplot set_axis_off spines text hatch plt axis plt.bar() plt.axis import figure pyplot highlight_text pypalettes plt.subplots() xlabel ylabel title legend colorbar savefig tight_layout grid set_xlim set_ylim plot scatter hist boxplot imshow cmap alpha bins tick_params annotate quiver contour barh stackplot subplots_adjust axhline axvline semilogx semilogy loglog polar streamplot hexbin pcolor tricontour errorbar clabel set_aspect violinplot set_axis_off spines text hatch plt axis plt.bar() plt.axis import figure pyplot highlight_text pypalettes plt.subplots() xlabel ylabel title legend colorbar savefig tight_layout grid set_xlim set_ylim plot scatter hist boxplot imshow cmap alpha bins tick_params annotate quiver contour barh stackplot subplots_adjust axhline axvline semilogx semilogy loglog polar streamplot hexbin pcolor tricontour errorbar clabel set_aspect violinplot set_axis_off spines text hatch plt axis plt.bar() plt.axis import figure pyplot highlight_text pypalettes plt.subplots() xlabel ylabel title legend colorbar savefig tight_layout grid set_xlim set_ylim plot scatter hist boxplot imshow cmap alpha bins tick_params annotate quiver contour barh stackplot subplots_adjust axhline axvline semilogx semilogy loglog polar streamplot hexbin pcolor tricontour errorbar clabel set_aspect violinplot set_axis_off spines text hatch plt axis plt.bar() plt.axis import figure pyplot highlight_text pypalettes plt.subplots() xlabel ylabel title legend colorbar savefig tight_layout grid set_xlim set_ylim plot scatter hist boxplot imshow cmap alpha bins tick_params annotate quiver contour barh stackplot subplots_adjust axhline axvline semilogx semilogy loglog polar streamplot hexbin pcolor tricontour errorbar clabel set_aspect violinplot set_axis_off spines text hatch plt axis plt.bar() plt.axis import figure pyplot highlight_text pypalettes plt.subplots() xlabel ylabel title legend colorbar savefig tight_layout grid set_xlim set_ylim plot scatter hist boxplot imshow cmap alpha bins tick_params annotate quiver contour barh stackplot subplots_adjust axhline axvline semilogx semilogy loglog polar streamplot hexbin pcolor tricontour errorbar clabel set_aspect violinplot set_axis_off spines text hatch plt axis plt.bar() plt.axis import figure pyplot highlight_text pypalettes plt.subplots() xlabel ylabel title legend colorbar savefig tight_layout grid set_xlim set_ylim plot scatter hist boxplot imshow cmap alpha bins tick_params annotate quiver contour barh stackplot subplots_adjust axhline axvline semilogx semilogy loglog polar streamplot hexbin pcolor tricontour errorbar clabel set_aspect violinplot set_axis_off spines text hatch plt axis plt.bar() plt.axis import figure pyplot highlight_text pypalettes plt.subplots() xlabel ylabel title legend colorbar savefig tight_layout grid set_xlim set_ylim plot scatter hist boxplot imshow cmap alpha bins tick_params annotate quiver contour barh stackplot subplots_adjust axhline axvline semilogx semilogy loglog polar streamplot hexbin pcolor tricontour errorbar clabel set_aspect violinplot set_axis_off spines text hatch plt axis plt.bar() plt.axis import figure pyplot highlight_text pypalettes plt.subplots() xlabel ylabel title legend colorbar savefig tight_layout grid set_xlim set_ylim plot scatter hist boxplot imshow cmap alpha bins tick_params annotate quiver contour barh stackplot subplots_adjust axhline axvline semilogx semilogy loglog polar streamplot hexbin pcolor tricontour errorbar clabel set_aspect violinplot set_axis_off spines text hatch plt axis plt.bar() plt.axis import figure pyplot highlight_text pypalettes plt.subplots() xlabel ylabel title legend colorbar savefig tight_layout grid set_xlim set_ylim plot scatter hist boxplot imshow cmap alpha bins tick_params annotate quiver contour barh stackplot subplots_adjust axhline axvline semilogx semilogy loglog polar streamplot hexbin pcolor tricontour errorbar clabel set_aspect violinplot set_axis_off spines text hatch plt axis plt.bar() plt.axis import figure pyplot highlight_text pypalettes plt.subplots() xlabel ylabel title legend colorbar savefig tight_layout grid set_xlim set_ylim plot scatter hist boxplot imshow cmap alpha bins tick_params annotate quiver contour barh stackplot subplots_adjust axhline axvline semilogx semilogy loglog polar streamplot hexbin pcolor tricontour errorbar clabel set_aspect violinplot set_axis_off spines text hatch plt axis plt.bar() plt.axis import figure pyplot highlight_text pypalettes plt.subplots() xlabel ylabel title legend colorbar savefig tight_layout grid set_xlim set_ylim plot scatter hist boxplot imshow cmap alpha bins tick_params annotate quiver contour barh stackplot subplots_adjust axhline axvline semilogx semilogy loglog polar streamplot hexbin pcolor tricontour errorbar clabel set_aspect violinplot set_axis_off spines text hatch plt axis plt.bar() plt.axis import figure pyplot highlight_text pypalettes plt.subplots() xlabel ylabel title legend colorbar savefig tight_layout grid set_xlim set_ylim plot scatter hist boxplot imshow cmap alpha bins tick_params annotate quiver contour barh stackplot subplots_adjust axhline axvline semilogx semilogy loglog polar streamplot hexbin pcolor tricontour errorbar clabel set_aspect violinplot set_axis_off spines text hatch plt axis plt.bar() plt.axis import figure pyplot highlight_text pypalettes plt.subplots() xlabel ylabel title legend colorbar savefig tight_layout grid set_xlim set_ylim plot scatter hist boxplot imshow cmap alpha bins tick_params annotate quiver contour barh stackplot subplots_adjust axhline axvline semilogx semilogy loglog polar streamplot hexbin pcolor tricontour errorbar clabel set_aspect violinplot set_axis_off spines text hatch plt axis plt.bar() plt.axis import figure pyplot highlight_text pypalettes plt.subplots() xlabel ylabel title legend colorbar savefig tight_layout grid set_xlim set_ylim plot scatter hist boxplot imshow cmap alpha bins tick_params annotate quiver contour barh stackplot subplots_adjust axhline axvline semilogx semilogy loglog polar streamplot hexbin pcolor tricontour errorbar clabel set_aspect violinplot set_axis_off spines text hatch plt axis plt.bar() plt.axis import figure pyplot highlight_text pypalettes plt.subplots() xlabel ylabel title legend colorbar savefig tight_layout grid set_xlim set_ylim plot scatter hist boxplot imshow cmap alpha bins tick_params annotate quiver contour barh stackplot subplots_adjust axhline axvline semilogx semilogy loglog polar streamplot hexbin pcolor tricontour errorbar clabel set_aspect violinplot set_axis_off spines text hatch plt axis plt.bar() plt.axis import figure pyplot highlight_text pypalettes plt.subplots() xlabel ylabel title legend colorbar savefig tight_layout grid set_xlim set_ylim plot scatter hist boxplot imshow cmap alpha bins tick_params annotate quiver contour barh stackplot subplots_adjust axhline axvline semilogx semilogy loglog polar streamplot hexbin pcolor tricontour errorbar clabel set_aspect violinplot set_axis_off spines text hatch plt axis plt.bar() plt.axis import figure pyplot highlight_text pypalettes plt.subplots() xlabel ylabel title legend colorbar savefig tight_layout grid set_xlim set_ylim plot scatter hist boxplot imshow cmap alpha bins tick_params annotate quiver contour barh stackplot subplots_adjust axhline axvline semilogx semilogy loglog polar streamplot hexbin pcolor tricontour errorbar clabel set_aspect violinplot set_axis_off spines text hatch plt axis plt.bar() plt.axis import figure pyplot highlight_text pypalettes plt.subplots() xlabel ylabel title legend colorbar savefig tight_layout grid set_xlim set_ylim plot scatter hist boxplot imshow cmap alpha bins tick_params annotate quiver contour barh stackplot subplots_adjust axhline axvline semilogx semilogy loglog polar streamplot hexbin pcolor tricontour errorbar clabel set_aspect violinplot set_axis_off spines text hatch plt axis plt.bar() plt.axis import figure pyplot highlight_text pypalettes plt.subplots() xlabel ylabel title legend colorbar savefig tight_layout grid set_xlim set_ylim plot scatter hist boxplot imshow cmap alpha bins tick_params annotate quiver contour barh stackplot subplots_adjust axhline axvline semilogx semilogy loglog polar streamplot hexbin pcolor tricontour errorbar clabel set_aspect violinplot set_axis_off spines text hatch plt axis plt.bar() plt.axis import figure pyplot highlight_text pypalettes plt.subplots() xlabel ylabel title legend colorbar savefig tight_layout grid set_xlim set_ylim plot scatter hist boxplot imshow cmap alpha bins tick_params annotate quiver contour barh stackplot subplots_adjust axhline axvline semilogx semilogy loglog polar streamplot hexbin pcolor tricontour errorbar clabel set_aspect violinplot set_axis_off spines text hatch plt axis plt.bar() plt.axis import figure pyplot highlight_text pypalettes plt.subplots() xlabel ylabel title legend colorbar savefig tight_layout grid set_xlim set_ylim plot scatter hist boxplot imshow cmap alpha bins tick_params annotate quiver contour barh stackplot subplots_adjust axhline axvline semilogx semilogy loglog polar streamplot hexbin pcolor tricontour errorbar clabel set_aspect violinplot set_axis_off spines text hatch plt axis plt.bar() plt.axis import figure pyplot highlight_text pypalettes plt.subplots() xlabel ylabel title legend colorbar savefig tight_layout grid set_xlim set_ylim plot scatter hist boxplot imshow cmap alpha bins tick_params annotate quiver contour barh stackplot subplots_adjust axhline axvline semilogx semilogy loglog polar streamplot hexbin pcolor tricontour errorbar clabel set_aspect violinplot set_axis_off spines text hatch plt axis plt.bar() plt.axis import figure pyplot highlight_text pypalettes plt.subplots() xlabel ylabel title legend colorbar savefig tight_layout grid set_xlim set_ylim plot scatter hist boxplot imshow cmap alpha bins tick_params annotate quiver contour barh stackplot subplots_adjust axhline axvline semilogx semilogy loglog polar streamplot hexbin pcolor tricontour errorbar clabel set_aspect violinplot set_axis_off spines text hatch plt axis plt.bar() plt.axis import figure pyplot highlight_text pypalettes plt.subplots() xlabel ylabel title legend colorbar savefig tight_layout grid set_xlim set_ylim plot scatter hist boxplot imshow cmap alpha bins tick_params annotate quiver contour barh stackplot subplots_adjust axhline axvline semilogx semilogy loglog polar streamplot hexbin pcolor tricontour errorbar clabel set_aspect violinplot set_axis_off spines text hatch plt axis plt.bar() plt.axis import figure pyplot highlight_text pypalettes plt.subplots() xlabel ylabel title legend colorbar savefig tight_layout grid set_xlim set_ylim plot scatter hist boxplot imshow cmap alpha bins tick_params annotate quiver contour barh stackplot subplots_adjust axhline axvline semilogx semilogy loglog polar streamplot hexbin pcolor tricontour errorbar clabel set_aspect violinplot set_axis_off spines text hatch plt axis plt.bar() plt.axis import figure pyplot highlight_text pypalettes plt.subplots() xlabel ylabel title legend colorbar savefig tight_layout grid set_xlim set_ylim plot scatter hist boxplot imshow cmap alpha bins tick_params annotate quiver contour barh stackplot subplots_adjust axhline axvline semilogx semilogy loglog polar streamplot hexbin pcolor tricontour errorbar clabel set_aspect violinplot set_axis_off spines text hatch plt axis plt.bar() plt.axis import figure pyplot highlight_text pypalettes plt.subplots() xlabel ylabel title legend colorbar savefig tight_layout grid set_xlim set_ylim plot scatter hist boxplot imshow cmap alpha bins tick_params annotate quiver contour barh stackplot subplots_adjust axhline axvline semilogx semilogy loglog polar streamplot hexbin pcolor tricontour errorbar clabel set_aspect violinplot set_axis_off spines text hatch plt axis plt.bar() plt.axis import figure pyplot highlight_text pypalettes plt.subplots() xlabel ylabel title legend colorbar savefig tight_layout grid set_xlim set_ylim plot scatter hist boxplot imshow cmap alpha bins tick_params annotate quiver contour barh stackplot subplots_adjust axhline axvline semilogx semilogy loglog polar streamplot hexbin pcolor tricontour errorbar clabel set_aspect violinplot set_axis_off spines text hatch plt axis plt.bar() plt.axis import figure pyplot highlight_text pypalettes plt.subplots() xlabel ylabel title legend colorbar savefig tight_layout grid set_xlim set_ylim plot scatter hist boxplot imshow cmap alpha bins tick_params annotate quiver contour barh stackplot subplots_adjust axhline axvline semilogx semilogy loglog polar streamplot hexbin pcolor tricontour errorbar clabel set_aspect violinplot set_axis_off spines text hatch plt axis plt.bar() plt.axis import figure pyplot highlight_text pypalettes plt.subplots() xlabel ylabel title legend colorbar savefig tight_layout grid set_xlim set_ylim plot scatter hist boxplot imshow cmap alpha bins tick_params annotate quiver contour barh stackplot subplots_adjust axhline axvline semilogx semilogy loglog polar streamplot hexbin pcolor tricontour errorbar clabel set_aspect violinplot set_axis_off spines text hatch plt axis plt.bar() plt.axis import figure pyplot highlight_text pypalettes plt.subplots() xlabel ylabel title legend colorbar savefig tight_layout grid set_xlim set_ylim plot scatter hist boxplot imshow cmap alpha bins tick_params annotate quiver contour barh stackplot subplots_adjust axhline axvline semilogx semilogy loglog polar streamplot hexbin pcolor tricontour errorbar clabel set_aspect violinplot set_axis_off spines text hatch plt axis plt.bar() plt.axis import figure pyplot highlight_text pypalettes plt.subplots() xlabel ylabel title legend colorbar savefig tight_layout grid set_xlim set_ylim plot scatter hist boxplot imshow cmap alpha bins tick_params annotate quiver contour barh stackplot subplots_adjust axhline axvline semilogx semilogy loglog polar streamplot hexbin pcolor tricontour errorbar clabel set_aspect violinplot set_axis_off spines text hatch plt axis plt.bar() plt.axis import figure pyplot highlight_text pypalettes plt.subplots() xlabel ylabel title legend colorbar savefig tight_layout grid set_xlim set_ylim plot scatter hist boxplot imshow cmap alpha bins tick_params annotate quiver contour barh stackplot subplots_adjust axhline axvline semilogx semilogy loglog polar streamplot hexbin pcolor tricontour errorbar clabel set_aspect violinplot set_axis_off spines text hatch plt axis plt.bar() plt.axis import figure pyplot highlight_text pypalettes plt.subplots() xlabel ylabel title legend colorbar savefig tight_layout grid set_xlim set_ylim plot scatter hist boxplot imshow cmap alpha bins tick_params annotate quiver contour barh stackplot subplots_adjust axhline axvline semilogx semilogy loglog polar streamplot hexbin pcolor tricontour errorbar clabel set_aspect violinplot set_axis_off spines text hatch plt axis plt.bar() plt.axis import figure pyplot highlight_text pypalettes plt.subplots() xlabel ylabel title legend colorbar savefig tight_layout grid set_xlim set_ylim plot scatter hist boxplot imshow cmap alpha bins tick_params annotate quiver contour barh stackplot subplots_adjust axhline axvline semilogx semilogy loglog polar streamplot hexbin pcolor tricontour errorbar clabel set_aspect violinplot set_axis_off spines text hatch plt axis plt.bar() plt.axis import figure pyplot highlight_text pypalettes plt.subplots() xlabel ylabel title legend colorbar savefig tight_layout grid set_xlim set_ylim plot scatter hist boxplot imshow cmap alpha bins tick_params annotate quiver contour barh stackplot subplots_adjust axhline axvline semilogx semilogy loglog polar streamplot hexbin pcolor tricontour errorbar clabel set_aspect violinplot set_axis_off spines text hatch plt axis plt.bar() plt.axis import figure pyplot highlight_text pypalettes plt.subplots() xlabel ylabel title legend colorbar savefig tight_layout grid set_xlim set_ylim plot scatter hist boxplot imshow cmap alpha bins tick_params annotate quiver contour barh stackplot subplots_adjust axhline axvline semilogx semilogy loglog polar streamplot hexbin pcolor tricontour errorbar clabel set_aspect violinplot set_axis_off spines text hatch plt axis plt.bar() plt.axis import figure pyplot highlight_text pypalettes plt.subplots() xlabel ylabel title legend colorbar savefig tight_layout grid set_xlim set_ylim plot scatter hist boxplot imshow cmap alpha bins tick_params annotate quiver contour barh stackplot subplots_adjust axhline axvline semilogx semilogy loglog polar streamplot hexbin pcolor tricontour errorbar clabel set_aspect violinplot set_axis_off spines text hatch plt axis plt.bar() plt.axis import figure pyplot highlight_text pypalettes plt.subplots() xlabel ylabel title legend colorbar savefig tight_layout grid set_xlim set_ylim plot scatter hist boxplot imshow cmap alpha bins tick_params annotate quiver contour barh stackplot subplots_adjust axhline axvline semilogx semilogy loglog polar streamplot hexbin pcolor tricontour errorbar clabel set_aspect violinplot set_axis_off spines text hatch plt axis plt.bar() plt.axis import figure pyplot highlight_text pypalettes plt.subplots() xlabel ylabel title legend colorbar savefig tight_layout grid set_xlim set_ylim plot scatter hist boxplot imshow cmap alpha bins tick_params annotate quiver contour barh stackplot subplots_adjust axhline axvline semilogx semilogy loglog polar streamplot hexbin pcolor tricontour errorbar clabel set_aspect violinplot set_axis_off spines text hatch plt axis plt.bar() plt.axis import figure pyplot highlight_text pypalettes plt.subplots() xlabel ylabel title legend colorbar savefig tight_layout grid set_xlim set_ylim plot scatter hist boxplot imshow cmap alpha bins tick_params annotate quiver contour barh stackplot subplots_adjust axhline axvline semilogx semilogy loglog polar streamplot hexbin pcolor tricontour errorbar clabel set_aspect violinplot set_axis_off spines text hatch plt axis plt.bar() plt.axis import figure pyplot highlight_text pypalettes plt.subplots() xlabel ylabel title legend colorbar savefig tight_layout grid set_xlim set_ylim plot scatter hist boxplot imshow cmap alpha bins tick_params annotate quiver contour barh stackplot subplots_adjust axhline axvline semilogx semilogy loglog polar streamplot hexbin pcolor tricontour errorbar clabel set_aspect violinplot set_axis_off spines text hatch plt axis plt.bar() plt.axis import figure pyplot highlight_text pypalettes plt.subplots() xlabel ylabel title legend colorbar savefig tight_layout grid set_xlim set_ylim plot scatter hist boxplot imshow cmap alpha bins tick_params annotate quiver contour barh stackplot subplots_adjust axhline axvline semilogx semilogy loglog polar streamplot hexbin pcolor tricontour errorbar clabel set_aspect violinplot set_axis_off spines text hatch plt axis plt.bar() plt.axis import figure pyplot highlight_text pypalettes plt.subplots() xlabel ylabel title legend colorbar savefig tight_layout grid set_xlim set_ylim plot scatter hist boxplot imshow cmap alpha bins tick_params annotate quiver contour barh stackplot subplots_adjust axhline axvline semilogx semilogy loglog polar streamplot hexbin pcolor tricontour errorbar clabel set_aspect violinplot set_axis_off spines text hatch plt axis plt.bar() plt.axis import figure pyplot highlight_text pypalettes plt.subplots() xlabel ylabel title legend colorbar savefig tight_layout grid set_xlim set_ylim plot scatter hist boxplot imshow cmap alpha bins tick_params annotate quiver contour barh stackplot subplots_adjust axhline axvline semilogx semilogy loglog polar streamplot hexbin pcolor tricontour errorbar clabel set_aspect violinplot set_axis_off spines text hatch plt axis plt.bar() plt.axis import figure pyplot highlight_text pypalettes plt.subplots() xlabel ylabel title legend colorbar savefig tight_layout grid set_xlim set_ylim plot scatter hist boxplot imshow cmap alpha bins tick_params annotate quiver contour barh stackplot subplots_adjust axhline axvline semilogx semilogy loglog polar streamplot hexbin pcolor tricontour errorbar clabel set_aspect violinplot set_axis_off spines text hatch plt axis plt.bar() plt.axis import figure pyplot highlight_text pypalettes plt.subplots() xlabel ylabel title legend colorbar savefig tight_layout grid set_xlim set_ylim plot scatter hist boxplot imshow cmap alpha bins tick_params annotate quiver contour barh stackplot subplots_adjust axhline axvline semilogx semilogy loglog polar streamplot hexbin pcolor tricontour errorbar clabel set_aspect violinplot set_axis_off spines text hatch plt axis plt.bar() plt.axis import figure pyplot highlight_text pypalettes plt.subplots() xlabel ylabel title legend colorbar savefig tight_layout grid set_xlim set_ylim plot scatter hist boxplot imshow cmap alpha bins tick_params annotate quiver contour barh stackplot subplots_adjust axhline axvline semilogx semilogy loglog polar streamplot hexbin pcolor tricontour errorbar clabel set_aspect violinplot set_axis_off spines text hatch plt axis plt.bar() plt.axis import figure pyplot highlight_text pypalettes plt.subplots() xlabel ylabel title legend colorbar savefig tight_layout grid set_xlim set_ylim plot scatter hist boxplot imshow cmap alpha bins tick_params annotate quiver contour barh stackplot subplots_adjust axhline axvline semilogx semilogy loglog polar streamplot hexbin pcolor tricontour errorbar clabel set_aspect violinplot set_axis_off spines text hatch plt axis plt.bar() plt.axis import figure pyplot highlight_text pypalettes plt.subplots() xlabel ylabel title legend colorbar savefig tight_layout grid set_xlim set_ylim plot scatter hist boxplot imshow cmap alpha bins tick_params annotate quiver contour barh stackplot subplots_adjust axhline axvline semilogx semilogy loglog polar streamplot hexbin pcolor tricontour errorbar clabel set_aspect violinplot set_axis_off spines text hatch plt axis plt.bar() plt.axis import figure pyplot highlight_text pypalettes plt.subplots() xlabel ylabel title legend colorbar savefig tight_layout grid set_xlim set_ylim plot scatter hist boxplot imshow cmap alpha bins tick_params annotate quiver contour barh stackplot subplots_adjust axhline axvline semilogx semilogy loglog polar streamplot hexbin pcolor tricontour errorbar clabel set_aspect violinplot set_axis_off spines text hatch plt axis plt.bar() plt.axis import figure pyplot highlight_text pypalettes plt.subplots() xlabel ylabel title legend colorbar savefig tight_layout grid set_xlim set_ylim plot scatter hist boxplot imshow cmap alpha bins tick_params annotate quiver contour barh stackplot subplots_adjust axhline axvline semilogx semilogy loglog polar streamplot hexbin pcolor tricontour errorbar clabel set_aspect violinplot set_axis_off spines text hatch plt axis plt.bar() plt.axis import figure pyplot highlight_text pypalettes plt.subplots() xlabel ylabel title legend colorbar savefig tight_layout grid set_xlim set_ylim plot scatter hist boxplot imshow cmap alpha bins tick_params annotate quiver contour barh stackplot subplots_adjust axhline axvline semilogx semilogy loglog polar streamplot hexbin pcolor tricontour errorbar clabel set_aspect violinplot set_axis_off spines text hatch plt axis plt.bar() plt.axis import figure pyplot highlight_text pypalettes plt.subplots() xlabel ylabel title legend colorbar savefig tight_layout grid set_xlim set_ylim plot scatter hist boxplot imshow cmap alpha bins tick_params annotate quiver contour barh stackplot subplots_adjust axhline axvline semilogx semilogy loglog polar streamplot hexbin pcolor tricontour errorbar clabel set_aspect violinplot set_axis_off spines text hatch plt axis plt.bar() plt.axis import figure pyplot highlight_text pypalettes plt.subplots() xlabel ylabel title legend colorbar savefig tight_layout grid set_xlim set_ylim plot scatter hist boxplot imshow cmap alpha bins tick_params annotate quiver contour barh stackplot subplots_adjust axhline axvline semilogx semilogy loglog polar streamplot hexbin pcolor tricontour errorbar clabel set_aspect violinplot set_axis_off spines text hatch plt axis plt.bar() plt.axis import figure pyplot highlight_text pypalettes plt.subplots() xlabel ylabel title legend colorbar savefig tight_layout grid set_xlim set_ylim plot scatter hist boxplot imshow cmap alpha bins tick_params annotate quiver contour barh stackplot subplots_adjust axhline axvline semilogx semilogy loglog polar streamplot hexbin pcolor tricontour errorbar clabel set_aspect violinplot set_axis_off spines text hatch plt axis plt.bar() plt.axis import figure pyplot highlight_text pypalettes plt.subplots() xlabel ylabel title legend colorbar savefig tight_layout grid set_xlim set_ylim plot scatter hist boxplot imshow cmap alpha bins tick_params annotate quiver contour barh stackplot subplots_adjust axhline axvline semilogx semilogy loglog polar streamplot hexbin pcolor tricontour errorbar clabel set_aspect violinplot set_axis_off spines text hatch plt axis plt.bar() plt.axis import figure pyplot highlight_text pypalettes plt.subplots() xlabel ylabel title legend colorbar savefig tight_layout grid set_xlim set_ylim plot scatter hist boxplot imshow cmap alpha bins tick_params annotate quiver contour barh stackplot subplots_adjust axhline axvline semilogx semilogy loglog polar streamplot hexbin pcolor tricontour errorbar clabel set_aspect violinplot set_axis_off spines text hatch plt axis plt.bar() plt.axis import figure pyplot highlight_text pypalettes plt.subplots() xlabel ylabel title legend colorbar savefig tight_layout grid set_xlim set_ylim plot scatter hist boxplot imshow cmap alpha bins tick_params annotate quiver contour barh stackplot subplots_adjust axhline axvline semilogx semilogy loglog polar streamplot hexbin pcolor tricontour errorbar clabel set_aspect violinplot set_axis_off spines text hatch plt axis plt.bar() plt.axis import figure pyplot highlight_text pypalettes plt.subplots() xlabel ylabel title legend colorbar savefig tight_layout grid set_xlim set_ylim plot scatter hist boxplot imshow cmap alpha bins tick_params annotate quiver contour barh stackplot subplots_adjust axhline axvline semilogx semilogy loglog polar streamplot hexbin pcolor tricontour errorbar clabel set_aspect violinplot set_axis_off spines text hatch plt axis plt.bar() plt.axis import figure pyplot highlight_text pypalettes plt.subplots() xlabel ylabel title legend colorbar savefig tight_layout grid set_xlim set_ylim plot scatter hist boxplot imshow cmap alpha bins tick_params annotate quiver contour barh stackplot subplots_adjust axhline axvline semilogx semilogy loglog polar streamplot hexbin pcolor tricontour errorbar clabel set_aspect violinplot set_axis_off spines text hatch plt axis plt.bar() plt.axis import figure pyplot highlight_text pypalettes plt.subplots() xlabel ylabel title legend colorbar savefig tight_layout grid set_xlim set_ylim plot scatter hist boxplot imshow cmap alpha bins tick_params annotate quiver contour barh stackplot subplots_adjust axhline axvline semilogx semilogy loglog polar streamplot hexbin pcolor tricontour errorbar clabel set_aspect violinplot set_axis_off spines text hatch plt axis plt.bar() plt.axis import figure pyplot highlight_text pypalettes plt.subplots() xlabel ylabel title legend colorbar savefig tight_layout grid set_xlim set_ylim plot scatter hist boxplot imshow cmap alpha bins tick_params annotate quiver contour barh stackplot subplots_adjust axhline axvline semilogx semilogy loglog polar streamplot hexbin pcolor tricontour errorbar clabel set_aspect violinplot set_axis_off spines text hatch plt axis plt.bar() plt.axis import figure pyplot highlight_text pypalettes plt.subplots() xlabel ylabel title legend colorbar savefig tight_layout grid set_xlim set_ylim plot scatter hist boxplot imshow cmap alpha bins tick_params annotate quiver contour barh stackplot subplots_adjust axhline axvline semilogx semilogy loglog polar streamplot hexbin pcolor tricontour errorbar clabel set_aspect violinplot set_axis_off spines text hatch plt axis plt.bar() plt.axis import figure pyplot highlight_text pypalettes plt.subplots() xlabel ylabel title legend colorbar savefig tight_layout grid set_xlim set_ylim plot scatter hist boxplot imshow cmap alpha bins tick_params annotate quiver contour barh stackplot subplots_adjust axhline axvline semilogx semilogy loglog polar streamplot hexbin pcolor tricontour errorbar clabel set_aspect violinplot set_axis_off spines text hatch plt axis plt.bar() plt.axis import figure pyplot highlight_text pypalettes plt.subplots() xlabel ylabel title legend colorbar savefig tight_layout grid set_xlim set_ylim plot scatter hist boxplot imshow cmap alpha bins tick_params annotate quiver contour barh stackplot subplots_adjust axhline axvline semilogx semilogy loglog polar streamplot hexbin pcolor tricontour errorbar clabel set_aspect violinplot set_axis_off spines text hatch plt axis plt.bar() plt.axis import figure pyplot highlight_text pypalettes plt.subplots() xlabel ylabel title legend colorbar savefig tight_layout grid set_xlim set_ylim plot scatter hist boxplot imshow cmap alpha bins tick_params annotate quiver contour barh stackplot subplots_adjust axhline axvline semilogx semilogy loglog polar streamplot hexbin pcolor tricontour errorbar clabel set_aspect violinplot set_axis_off spines text hatch plt axis plt.bar() plt.axis import figure pyplot highlight_text pypalettes plt.subplots() xlabel ylabel title legend colorbar savefig tight_layout grid set_xlim set_ylim plot scatter hist boxplot imshow cmap alpha bins tick_params annotate quiver contour barh stackplot subplots_adjust axhline axvline semilogx semilogy loglog polar streamplot hexbin pcolor tricontour errorbar clabel set_aspect violinplot set_axis_off spines text hatch plt axis plt.bar() plt.axis import figure pyplot highlight_text pypalettes plt.subplots() xlabel ylabel title legend colorbar savefig tight_layout grid set_xlim set_ylim plot scatter hist boxplot imshow cmap alpha bins tick_params annotate quiver contour barh stackplot subplots_adjust axhline axvline semilogx semilogy loglog polar streamplot hexbin pcolor tricontour errorbar clabel set_aspect violinplot set_axis_off spines text hatch plt axis plt.bar() plt.axis import figure pyplot highlight_text pypalettes plt.subplots() xlabel ylabel title legend colorbar savefig tight_layout grid set_xlim set_ylim plot scatter hist boxplot imshow cmap alpha bins tick_params annotate quiver contour barh stackplot subplots_adjust axhline axvline semilogx semilogy loglog polar streamplot hexbin pcolor tricontour errorbar clabel set_aspect violinplot set_axis_off spines text hatch plt axis plt.bar() plt.axis import figure pyplot highlight_text pypalettes plt.subplots() xlabel ylabel title legend colorbar savefig tight_layout grid set_xlim set_ylim plot scatter hist boxplot imshow cmap alpha bins tick_params annotate quiver contour barh stackplot subplots_adjust axhline axvline semilogx semilogy loglog polar streamplot hexbin pcolor tricontour errorbar clabel set_aspect violinplot set_axis_off spines text hatch plt axis plt.bar() plt.axis import figure pyplot highlight_text pypalettes plt.subplots() xlabel ylabel title legend colorbar savefig tight_layout grid set_xlim set_ylim plot scatter hist boxplot imshow cmap alpha bins tick_params annotate quiver contour barh stackplot subplots_adjust axhline axvline semilogx semilogy loglog polar streamplot hexbin pcolor tricontour errorbar clabel set_aspect violinplot set_axis_off spines text hatch plt axis plt.bar() plt.axis import figure pyplot highlight_text pypalettes plt.subplots() xlabel ylabel title legend colorbar savefig tight_layout grid set_xlim set_ylim plot scatter hist boxplot imshow cmap alpha bins tick_params annotate quiver contour barh stackplot subplots_adjust axhline axvline semilogx semilogy loglog polar streamplot hexbin pcolor tricontour errorbar clabel set_aspect violinplot set_axis_off spines text hatch plt axis plt.bar() plt.axis import figure pyplot highlight_text pypalettes plt.subplots() xlabel ylabel title legend colorbar savefig tight_layout grid set_xlim set_ylim plot scatter hist boxplot imshow cmap alpha bins tick_params annotate quiver contour barh stackplot subplots_adjust axhline axvline semilogx semilogy loglog polar streamplot hexbin pcolor tricontour errorbar clabel set_aspect violinplot set_axis_off spines text hatch plt axis plt.bar() plt.axis import figure pyplot highlight_text pypalettes plt.subplots() xlabel ylabel title legend colorbar savefig tight_layout grid set_xlim set_ylim plot scatter hist boxplot imshow cmap alpha bins tick_params annotate quiver contour barh stackplot subplots_adjust axhline axvline semilogx semilogy loglog polar streamplot hexbin pcolor tricontour errorbar clabel set_aspect violinplot set_axis_off spines text hatch plt axis plt.bar() plt.axis import figure pyplot highlight_text pypalettes plt.subplots() xlabel ylabel title legend colorbar savefig tight_layout grid set_xlim set_ylim plot scatter hist boxplot imshow cmap alpha bins tick_params annotate quiver contour barh stackplot subplots_adjust axhline axvline semilogx semilogy loglog polar streamplot hexbin pcolor tricontour errorbar clabel set_aspect violinplot set_axis_off spines text hatch plt axis plt.bar() plt.axis import figure pyplot highlight_text pypalettes plt.subplots() xlabel ylabel title legend colorbar savefig tight_layout grid set_xlim set_ylim plot scatter hist boxplot imshow cmap alpha bins tick_params annotate quiver contour barh stackplot subplots_adjust axhline axvline semilogx semilogy loglog polar streamplot hexbin pcolor tricontour errorbar clabel set_aspect violinplot set_axis_off spines text hatch plt axis plt.bar() plt.axis import figure pyplot highlight_text pypalettes plt.subplots() xlabel ylabel title legend colorbar savefig tight_layout grid set_xlim set_ylim plot scatter hist boxplot imshow cmap alpha bins tick_params annotate quiver contour barh stackplot subplots_adjust axhline axvline semilogx semilogy loglog polar streamplot hexbin pcolor tricontour errorbar clabel set_aspect violinplot set_axis_off spines text hatch plt axis plt.bar() plt.axis import figure pyplot highlight_text pypalettes plt.subplots() xlabel ylabel title legend colorbar savefig tight_layout grid set_xlim set_ylim plot scatter hist boxplot imshow cmap alpha bins tick_params annotate quiver contour barh stackplot subplots_adjust axhline axvline semilogx semilogy loglog polar streamplot hexbin pcolor tricontour errorbar clabel set_aspect violinplot set_axis_off spines text hatch plt axis plt.bar() plt.axis import figure pyplot highlight_text pypalettes plt.subplots() xlabel ylabel title legend colorbar savefig tight_layout grid set_xlim set_ylim plot scatter hist boxplot imshow cmap alpha bins tick_params annotate quiver contour barh stackplot subplots_adjust axhline axvline semilogx semilogy loglog polar streamplot hexbin pcolor tricontour errorbar clabel set_aspect violinplot set_axis_off spines text hatch plt axis plt.bar() plt.axis import figure pyplot highlight_text pypalettes plt.subplots() xlabel ylabel title legend colorbar savefig tight_layout grid set_xlim set_ylim plot scatter hist boxplot imshow cmap alpha bins tick_params annotate quiver contour barh stackplot subplots_adjust axhline axvline semilogx semilogy loglog polar streamplot hexbin pcolor tricontour errorbar clabel set_aspect violinplot set_axis_off spines text hatch plt axis plt.bar() plt.axis import figure pyplot highlight_text pypalettes plt.subplots() xlabel ylabel title legend colorbar savefig tight_layout grid set_xlim set_ylim plot scatter hist boxplot imshow cmap alpha bins tick_params annotate quiver contour barh stackplot subplots_adjust axhline axvline semilogx semilogy loglog polar streamplot hexbin pcolor tricontour errorbar clabel set_aspect violinplot set_axis_off spines text hatch plt axis plt.bar() plt.axis import figure pyplot highlight_text pypalettes plt.subplots() xlabel ylabel title legend colorbar savefig tight_layout grid set_xlim set_ylim plot scatter hist boxplot imshow cmap alpha bins tick_params annotate quiver contour barh stackplot subplots_adjust axhline axvline semilogx semilogy loglog polar streamplot hexbin pcolor tricontour errorbar clabel set_aspect violinplot set_axis_off spines text hatch plt axis plt.bar() plt.axis import figure pyplot highlight_text pypalettes plt.subplots() xlabel ylabel title legend colorbar savefig tight_layout grid set_xlim set_ylim plot scatter hist boxplot imshow cmap alpha bins tick_params annotate quiver contour barh stackplot subplots_adjust axhline axvline semilogx semilogy loglog polar streamplot hexbin pcolor tricontour errorbar clabel set_aspect violinplot set_axis_off spines text hatch plt axis plt.bar() plt.axis import figure pyplot highlight_text pypalettes plt.subplots() xlabel ylabel title legend colorbar savefig tight_layout grid set_xlim set_ylim plot scatter hist boxplot imshow cmap alpha bins tick_params annotate quiver contour barh stackplot subplots_adjust axhline axvline semilogx semilogy loglog polar streamplot hexbin pcolor tricontour errorbar clabel set_aspect violinplot set_axis_off spines text hatch plt axis plt.bar() plt.axis import figure pyplot highlight_text pypalettes plt.subplots() xlabel ylabel title legend colorbar savefig tight_layout grid set_xlim set_ylim plot scatter hist boxplot imshow cmap alpha bins tick_params annotate quiver contour barh stackplot subplots_adjust axhline axvline semilogx semilogy loglog polar streamplot hexbin pcolor tricontour errorbar clabel set_aspect violinplot set_axis_off spines text hatch plt axis plt.bar() plt.axis import figure pyplot highlight_text pypalettes plt.subplots() xlabel ylabel title legend colorbar savefig tight_layout grid set_xlim set_ylim plot scatter hist boxplot imshow cmap alpha bins tick_params annotate quiver contour barh stackplot subplots_adjust axhline axvline semilogx semilogy loglog polar streamplot hexbin pcolor tricontour errorbar clabel set_aspect violinplot set_axis_off spines text hatch plt axis plt.bar() plt.axis import figure pyplot highlight_text pypalettes plt.subplots() xlabel ylabel title legend colorbar savefig tight_layout grid set_xlim set_ylim plot scatter hist boxplot imshow cmap alpha bins tick_params annotate quiver contour barh stackplot subplots_adjust axhline axvline semilogx semilogy loglog polar streamplot hexbin pcolor tricontour errorbar clabel set_aspect violinplot set_axis_off spines text hatch plt axis plt.bar() plt.axis import figure pyplot highlight_text pypalettes plt.subplots() xlabel ylabel title legend colorbar savefig tight_layout grid set_xlim set_ylim plot scatter hist boxplot imshow cmap alpha bins tick_params annotate quiver contour barh stackplot subplots_adjust axhline axvline semilogx semilogy loglog polar streamplot hexbin pcolor tricontour errorbar clabel set_aspect violinplot set_axis_off spines text hatch plt axis plt.bar() plt.axis import figure pyplot highlight_text pypalettes plt.subplots() xlabel ylabel title legend colorbar savefig tight_layout grid set_xlim set_ylim plot scatter hist boxplot imshow cmap alpha bins tick_params annotate quiver contour barh stackplot subplots_adjust axhline axvline semilogx semilogy loglog polar streamplot hexbin pcolor tricontour errorbar clabel set_aspect violinplot set_axis_off spines text hatch plt axis plt.bar() plt.axis import figure pyplot highlight_text pypalettes plt.subplots() xlabel ylabel title legend colorbar savefig tight_layout grid set_xlim set_ylim plot scatter hist boxplot imshow cmap alpha bins tick_params annotate quiver contour barh stackplot subplots_adjust axhline axvline semilogx semilogy loglog polar streamplot hexbin pcolor tricontour errorbar clabel set_aspect violinplot set_axis_off spines text hatch plt axis plt.bar() plt.axis import figure pyplot highlight_text pypalettes plt.subplots() xlabel ylabel title legend colorbar savefig tight_layout grid set_xlim set_ylim plot scatter hist boxplot imshow cmap alpha bins tick_params annotate quiver contour barh stackplot subplots_adjust axhline axvline semilogx semilogy loglog polar streamplot hexbin pcolor tricontour errorbar clabel set_aspect violinplot set_axis_off spines text hatch plt axis plt.bar() plt.axis import figure pyplot highlight_text pypalettes plt.subplots() xlabel ylabel title legend colorbar savefig tight_layout grid set_xlim set_ylim plot scatter hist boxplot imshow cmap alpha bins tick_params annotate quiver contour barh stackplot subplots_adjust axhline axvline semilogx semilogy loglog polar streamplot hexbin pcolor tricontour errorbar clabel set_aspect violinplot set_axis_off spines text hatch plt axis plt.bar() plt.axis import figure pyplot highlight_text pypalettes plt.subplots() xlabel ylabel title legend colorbar savefig tight_layout grid set_xlim set_ylim plot scatter hist boxplot imshow cmap alpha bins tick_params annotate quiver contour barh stackplot subplots_adjust axhline axvline semilogx semilogy loglog polar streamplot hexbin pcolor tricontour errorbar clabel set_aspect violinplot set_axis_off spines text hatch plt axis plt.bar() plt.axis import figure pyplot highlight_text pypalettes plt.subplots() xlabel ylabel title legend colorbar savefig tight_layout grid set_xlim set_ylim plot scatter hist boxplot imshow cmap alpha bins tick_params annotate quiver contour barh stackplot subplots_adjust axhline axvline semilogx semilogy loglog polar streamplot hexbin pcolor tricontour errorbar clabel set_aspect violinplot set_axis_off spines text hatch plt axis plt.bar() plt.axis import figure pyplot highlight_text pypalettes plt.subplots() xlabel ylabel title legend colorbar savefig tight_layout grid set_xlim set_ylim plot scatter hist boxplot imshow cmap alpha bins tick_params annotate quiver contour barh stackplot subplots_adjust axhline axvline semilogx semilogy loglog polar streamplot hexbin pcolor tricontour errorbar clabel set_aspect violinplot set_axis_off spines text hatch plt axis plt.bar() plt.axis import figure pyplot highlight_text pypalettes plt.subplots() xlabel ylabel title legend colorbar savefig tight_layout grid set_xlim set_ylim plot scatter hist boxplot imshow cmap alpha bins tick_params annotate quiver contour barh stackplot subplots_adjust axhline axvline semilogx semilogy loglog polar streamplot hexbin pcolor tricontour errorbar clabel set_aspect violinplot set_axis_off spines text hatch plt axis plt.bar() plt.axis import figure pyplot highlight_text pypalettes plt.subplots() xlabel ylabel title legend colorbar savefig tight_layout grid set_xlim set_ylim plot scatter hist boxplot imshow cmap alpha bins tick_params annotate quiver contour barh stackplot subplots_adjust axhline axvline semilogx semilogy loglog polar streamplot hexbin pcolor tricontour errorbar clabel set_aspect violinplot set_axis_off spines text hatch plt axis plt.bar() plt.axis import figure pyplot highlight_text pypalettes plt.subplots() xlabel ylabel title legend colorbar savefig tight_layout grid set_xlim set_ylim plot scatter hist boxplot imshow cmap alpha bins tick_params annotate quiver contour barh stackplot subplots_adjust axhline axvline semilogx semilogy loglog polar streamplot hexbin pcolor tricontour errorbar clabel set_aspect violinplot set_axis_off spines text hatch plt axis plt.bar() plt.axis import figure pyplot highlight_text pypalettes plt.subplots() xlabel ylabel title legend colorbar savefig tight_layout grid set_xlim set_ylim plot scatter hist boxplot imshow cmap alpha bins tick_params annotate quiver contour barh stackplot subplots_adjust axhline axvline semilogx semilogy loglog polar streamplot hexbin pcolor tricontour errorbar clabel set_aspect violinplot set_axis_off spines text hatch plt axis plt.bar() plt.axis import figure pyplot highlight_text pypalettes plt.subplots() xlabel ylabel title legend colorbar savefig tight_layout grid set_xlim set_ylim plot scatter hist boxplot imshow cmap alpha bins tick_params annotate quiver contour barh stackplot subplots_adjust axhline axvline semilogx semilogy loglog polar streamplot hexbin pcolor tricontour errorbar clabel set_aspect violinplot set_axis_off spines text hatch plt axis plt.bar() plt.axis import figure pyplot highlight_text pypalettes plt.subplots() xlabel ylabel title legend colorbar savefig tight_layout grid set_xlim set_ylim plot scatter hist boxplot imshow cmap alpha bins tick_params annotate quiver contour barh stackplot subplots_adjust axhline axvline semilogx semilogy loglog polar streamplot hexbin pcolor tricontour errorbar clabel set_aspect violinplot set_axis_off spines text hatch plt axis plt.bar() plt.axis import figure pyplot highlight_text pypalettes plt.subplots() xlabel ylabel title legend colorbar savefig tight_layout grid set_xlim set_ylim plot scatter hist boxplot imshow cmap alpha bins tick_params annotate quiver contour barh stackplot subplots_adjust axhline axvline semilogx semilogy loglog polar streamplot hexbin pcolor tricontour errorbar clabel set_aspect violinplot set_axis_off spines text hatch plt axis plt.bar() plt.axis import figure pyplot highlight_text pypalettes plt.subplots() xlabel ylabel title legend colorbar savefig tight_layout grid set_xlim set_ylim plot scatter hist boxplot imshow cmap alpha bins tick_params annotate quiver contour barh stackplot subplots_adjust axhline axvline semilogx semilogy loglog polar streamplot hexbin pcolor tricontour errorbar clabel set_aspect violinplot set_axis_off spines text hatch plt axis plt.bar() plt.axis import figure pyplot highlight_text pypalettes plt.subplots() xlabel ylabel title legend colorbar savefig tight_layout grid set_xlim set_ylim plot scatter hist boxplot imshow cmap alpha bins tick_params annotate quiver contour barh stackplot subplots_adjust axhline axvline semilogx semilogy loglog polar streamplot hexbin pcolor tricontour errorbar clabel set_aspect violinplot set_axis_off spines text hatch plt axis plt.bar() plt.axis import figure pyplot highlight_text pypalettes plt.subplots() xlabel ylabel title legend colorbar savefig tight_layout grid set_xlim set_ylim plot scatter hist boxplot imshow cmap alpha bins tick_params annotate quiver contour barh stackplot subplots_adjust axhline axvline semilogx semilogy loglog polar streamplot hexbin pcolor tricontour errorbar clabel set_aspect violinplot set_axis_off spines text hatch plt axis plt.bar() plt.axis import figure pyplot highlight_text pypalettes plt.subplots() xlabel ylabel title legend colorbar savefig tight_layout grid set_xlim set_ylim plot scatter hist boxplot imshow cmap alpha bins tick_params annotate quiver contour barh stackplot subplots_adjust axhline axvline semilogx semilogy loglog polar streamplot hexbin pcolor tricontour errorbar clabel set_aspect violinplot set_axis_off spines text hatch plt axis plt.bar() plt.axis import figure pyplot highlight_text pypalettes plt.subplots() xlabel ylabel title legend colorbar savefig tight_layout grid set_xlim set_ylim plot scatter hist boxplot imshow cmap alpha bins tick_params annotate quiver contour barh stackplot subplots_adjust axhline axvline semilogx semilogy loglog polar streamplot hexbin pcolor tricontour errorbar clabel set_aspect violinplot set_axis_off spines text hatch plt axis plt.bar() plt.axis import figure pyplot highlight_text pypalettes plt.subplots() xlabel ylabel title legend colorbar savefig tight_layout grid set_xlim set_ylim plot scatter hist boxplot imshow cmap alpha bins tick_params annotate quiver contour barh stackplot subplots_adjust axhline axvline semilogx semilogy loglog polar streamplot hexbin pcolor tricontour errorbar clabel set_aspect violinplot set_axis_off spines text hatch plt axis plt.bar() plt.axis import figure pyplot highlight_text pypalettes plt.subplots() xlabel ylabel title legend colorbar savefig tight_layout grid set_xlim set_ylim plot scatter hist boxplot imshow cmap alpha bins tick_params annotate quiver contour barh stackplot subplots_adjust axhline axvline semilogx semilogy loglog polar streamplot hexbin pcolor tricontour errorbar clabel set_aspect violinplot set_axis_off spines text hatch plt axis plt.bar() plt.axis import figure pyplot highlight_text pypalettes plt.subplots() xlabel ylabel title legend colorbar savefig tight_layout grid set_xlim set_ylim plot scatter hist boxplot imshow cmap alpha bins tick_params annotate quiver contour barh stackplot subplots_adjust axhline axvline semilogx semilogy loglog polar streamplot hexbin pcolor tricontour errorbar clabel set_aspect violinplot set_axis_off spines text hatch plt axis plt.bar() plt.axis import figure pyplot highlight_text pypalettes plt.subplots() xlabel ylabel title legend colorbar savefig tight_layout grid set_xlim set_ylim plot scatter hist boxplot imshow cmap alpha bins tick_params annotate quiver contour barh stackplot subplots_adjust axhline axvline semilogx semilogy loglog polar streamplot hexbin pcolor tricontour errorbar clabel set_aspect violinplot set_axis_off spines text hatch plt axis plt.bar() plt.axis import figure pyplot highlight_text pypalettes plt.subplots() xlabel ylabel title legend colorbar savefig tight_layout grid set_xlim set_ylim plot scatter hist boxplot imshow cmap alpha bins tick_params annotate quiver contour barh stackplot subplots_adjust axhline axvline semilogx semilogy loglog polar streamplot hexbin pcolor tricontour errorbar clabel set_aspect violinplot set_axis_off spines text hatch plt axis plt.bar() plt.axis import figure pyplot highlight_text pypalettes plt.subplots() xlabel ylabel title legend colorbar savefig tight_layout grid set_xlim set_ylim plot scatter hist boxplot imshow cmap alpha bins tick_params annotate quiver contour barh stackplot subplots_adjust axhline axvline semilogx semilogy loglog polar streamplot hexbin pcolor tricontour errorbar clabel set_aspect violinplot set_axis_off spines text hatch plt axis plt.bar() plt.axis import figure pyplot highlight_text pypalettes plt.subplots() xlabel ylabel title legend colorbar savefig tight_layout grid set_xlim set_ylim plot scatter hist boxplot imshow cmap alpha bins tick_params annotate quiver contour barh stackplot subplots_adjust axhline axvline semilogx semilogy loglog polar streamplot hexbin pcolor tricontour errorbar clabel set_aspect violinplot set_axis_off spines text hatch plt axis plt.bar() plt.axis import figure pyplot highlight_text pypalettes plt.subplots() xlabel ylabel title legend colorbar savefig tight_layout grid set_xlim set_ylim plot scatter hist boxplot imshow cmap alpha bins tick_params annotate quiver contour barh stackplot subplots_adjust axhline axvline semilogx semilogy loglog polar streamplot hexbin pcolor tricontour errorbar clabel set_aspect violinplot set_axis_off spines text hatch plt axis plt.bar() plt.axis import figure pyplot highlight_text pypalettes plt.subplots() xlabel ylabel title legend colorbar savefig tight_layout grid set_xlim set_ylim plot scatter hist boxplot imshow cmap alpha bins tick_params annotate quiver contour barh stackplot subplots_adjust axhline axvline semilogx semilogy loglog polar streamplot hexbin pcolor tricontour errorbar clabel set_aspect violinplot set_axis_off spines text hatch plt axis plt.bar() plt.axis import figure pyplot highlight_text pypalettes plt.subplots() xlabel ylabel title legend colorbar savefig tight_layout grid set_xlim set_ylim plot scatter hist boxplot imshow cmap alpha bins tick_params annotate quiver contour barh stackplot subplots_adjust axhline axvline semilogx semilogy loglog polar streamplot hexbin pcolor tricontour errorbar clabel set_aspect violinplot set_axis_off spines text hatch plt axis plt.bar() plt.axis import figure pyplot highlight_text pypalettes plt.subplots() xlabel ylabel title legend colorbar savefig tight_layout grid set_xlim set_ylim plot scatter hist boxplot imshow cmap alpha bins tick_params annotate quiver contour barh stackplot subplots_adjust axhline axvline semilogx semilogy loglog polar streamplot hexbin pcolor tricontour errorbar clabel set_aspect violinplot set_axis_off spines text hatch plt axis plt.bar() plt.axis import figure pyplot highlight_text pypalettes plt.subplots() xlabel ylabel title legend colorbar savefig tight_layout grid set_xlim set_ylim plot scatter hist boxplot imshow cmap alpha bins tick_params annotate quiver contour barh stackplot subplots_adjust axhline axvline semilogx semilogy loglog polar streamplot hexbin pcolor tricontour errorbar clabel set_aspect violinplot set_axis_off spines text hatch plt axis plt.bar() plt.axis import figure pyplot highlight_text pypalettes plt.subplots() xlabel ylabel title legend colorbar savefig tight_layout grid set_xlim set_ylim plot scatter hist boxplot imshow cmap alpha bins tick_params annotate quiver contour barh stackplot subplots_adjust axhline axvline semilogx semilogy loglog polar streamplot hexbin pcolor tricontour errorbar clabel set_aspect violinplot set_axis_off spines text hatch plt axis plt.bar() plt.axis import figure pyplot highlight_text pypalettes plt.subplots() xlabel ylabel title legend colorbar savefig tight_layout grid set_xlim set_ylim plot scatter hist boxplot imshow cmap alpha bins tick_params annotate quiver contour barh stackplot subplots_adjust axhline axvline semilogx semilogy loglog polar streamplot hexbin pcolor tricontour errorbar clabel set_aspect violinplot set_axis_off spines text hatch plt axis plt.bar() plt.axis import figure pyplot highlight_text pypalettes plt.subplots() xlabel ylabel title legend colorbar savefig tight_layout grid set_xlim set_ylim plot scatter hist boxplot imshow cmap alpha bins tick_params annotate quiver contour barh stackplot subplots_adjust axhline axvline semilogx semilogy loglog polar streamplot hexbin pcolor tricontour errorbar clabel set_aspect violinplot set_axis_off spines text hatch plt axis plt.bar() plt.axis import figure pyplot highlight_text pypalettes plt.subplots() xlabel ylabel title legend colorbar savefig tight_layout grid set_xlim set_ylim plot scatter hist boxplot imshow cmap alpha bins tick_params annotate quiver contour barh stackplot subplots_adjust axhline axvline semilogx semilogy loglog polar streamplot hexbin pcolor tricontour errorbar clabel set_aspect violinplot set_axis_off spines text hatch plt axis plt.bar() plt.axis import figure pyplot highlight_text pypalettes plt.subplots() xlabel ylabel title legend colorbar savefig tight_layout grid set_xlim set_ylim plot scatter hist boxplot imshow cmap alpha bins tick_params annotate quiver contour barh stackplot subplots_adjust axhline axvline semilogx semilogy loglog polar streamplot hexbin pcolor tricontour errorbar clabel set_aspect violinplot set_axis_off spines text hatch plt axis plt.bar() plt.axis import figure pyplot highlight_text pypalettes plt.subplots() xlabel ylabel title legend colorbar savefig tight_layout grid set_xlim set_ylim plot scatter hist boxplot imshow cmap alpha bins tick_params annotate quiver contour barh stackplot subplots_adjust axhline axvline semilogx semilogy loglog polar streamplot hexbin pcolor tricontour errorbar clabel set_aspect violinplot set_axis_off spines text hatch plt axis plt.bar() plt.axis import figure pyplot highlight_text pypalettes plt.subplots() xlabel ylabel title legend colorbar savefig tight_layout grid set_xlim set_ylim plot scatter hist boxplot imshow cmap alpha bins tick_params annotate quiver contour barh stackplot subplots_adjust axhline axvline semilogx semilogy loglog polar streamplot hexbin pcolor tricontour errorbar clabel set_aspect violinplot set_axis_off spines text hatch plt axis plt.bar() plt.axis import figure pyplot highlight_text pypalettes plt.subplots() xlabel ylabel title legend colorbar savefig tight_layout grid set_xlim set_ylim plot scatter hist boxplot imshow cmap alpha bins tick_params annotate quiver contour barh stackplot subplots_adjust axhline axvline semilogx semilogy loglog polar streamplot hexbin pcolor tricontour errorbar clabel set_aspect violinplot set_axis_off spines text hatch plt axis plt.bar() plt.axis import figure pyplot highlight_text pypalettes plt.subplots() xlabel ylabel title legend colorbar savefig tight_layout grid set_xlim set_ylim plot scatter hist boxplot imshow cmap alpha bins tick_params annotate quiver contour barh stackplot subplots_adjust axhline axvline semilogx semilogy loglog polar streamplot hexbin pcolor tricontour errorbar clabel set_aspect violinplot set_axis_off spines text hatch plt axis plt.bar() plt.axis import figure pyplot highlight_text pypalettes plt.subplots() xlabel ylabel title legend colorbar savefig tight_layout grid set_xlim set_ylim plot scatter hist boxplot imshow cmap alpha bins tick_params annotate quiver contour barh stackplot subplots_adjust axhline axvline semilogx semilogy loglog polar streamplot hexbin pcolor tricontour errorbar clabel set_aspect violinplot set_axis_off spines text hatch plt axis plt.bar() plt.axis import figure pyplot highlight_text pypalettes plt.subplots() xlabel ylabel title legend colorbar savefig tight_layout grid set_xlim set_ylim plot scatter hist boxplot imshow cmap alpha bins tick_params annotate quiver contour barh stackplot subplots_adjust axhline axvline semilogx semilogy loglog polar streamplot hexbin pcolor tricontour errorbar clabel set_aspect violinplot set_axis_off spines text hatch plt axis plt.bar() plt.axis import figure pyplot highlight_text pypalettes plt.subplots() xlabel ylabel title legend colorbar savefig tight_layout grid set_xlim set_ylim plot scatter hist boxplot imshow cmap alpha bins tick_params annotate quiver contour barh stackplot subplots_adjust axhline axvline semilogx semilogy loglog polar streamplot hexbin pcolor tricontour errorbar clabel set_aspect violinplot set_axis_off spines text hatch plt axis plt.bar() plt.axis import figure pyplot highlight_text pypalettes plt.subplots() xlabel ylabel title legend colorbar savefig tight_layout grid set_xlim set_ylim plot scatter hist boxplot imshow cmap alpha bins tick_params annotate quiver contour barh stackplot subplots_adjust axhline axvline semilogx semilogy loglog polar streamplot hexbin pcolor tricontour errorbar clabel set_aspect violinplot set_axis_off spines text hatch plt axis plt.bar() plt.axis import figure pyplot highlight_text pypalettes plt.subplots() xlabel ylabel title legend colorbar savefig tight_layout grid set_xlim set_ylim plot scatter hist boxplot imshow cmap alpha bins tick_params annotate quiver contour barh stackplot subplots_adjust axhline axvline semilogx semilogy loglog polar streamplot hexbin pcolor tricontour errorbar clabel set_aspect violinplot set_axis_off spines text hatch plt axis plt.bar() plt.axis import figure pyplot highlight_text pypalettes plt.subplots() xlabel ylabel title legend colorbar savefig tight_layout grid set_xlim set_ylim plot scatter hist boxplot imshow cmap alpha bins tick_params annotate quiver contour barh stackplot subplots_adjust axhline axvline semilogx semilogy loglog polar streamplot hexbin pcolor tricontour errorbar clabel set_aspect violinplot set_axis_off spines text hatch plt axis plt.bar() plt.axis import figure pyplot highlight_text pypalettes plt.subplots() xlabel ylabel title legend colorbar savefig tight_layout grid set_xlim set_ylim plot scatter hist boxplot imshow cmap alpha bins tick_params annotate quiver contour barh stackplot subplots_adjust axhline axvline semilogx semilogy loglog polar streamplot hexbin pcolor tricontour errorbar clabel set_aspect violinplot set_axis_off spines text hatch plt axis plt.bar() plt.axis import figure pyplot highlight_text pypalettes plt.subplots() xlabel ylabel title legend colorbar savefig tight_layout grid set_xlim set_ylim plot scatter hist boxplot imshow cmap alpha bins tick_params annotate quiver contour barh stackplot subplots_adjust axhline axvline semilogx semilogy loglog polar streamplot hexbin pcolor tricontour errorbar clabel set_aspect violinplot set_axis_off spines text hatch plt axis plt.bar() plt.axis import figure pyplot highlight_text pypalettes plt.subplots() xlabel ylabel title legend colorbar savefig tight_layout grid set_xlim set_ylim plot scatter hist boxplot imshow cmap alpha bins tick_params annotate quiver contour barh stackplot subplots_adjust axhline axvline semilogx semilogy loglog polar streamplot hexbin pcolor tricontour errorbar clabel set_aspect violinplot set_axis_off spines text hatch plt axis plt.bar() plt.axis import figure pyplot highlight_text pypalettes plt.subplots() xlabel ylabel title legend colorbar savefig tight_layout grid set_xlim set_ylim plot scatter hist boxplot imshow cmap alpha bins tick_params annotate quiver contour barh stackplot subplots_adjust axhline axvline semilogx semilogy loglog polar streamplot hexbin pcolor tricontour errorbar clabel set_aspect violinplot set_axis_off spines text hatch plt axis plt.bar() plt.axis import figure pyplot highlight_text pypalettes plt.subplots() xlabel ylabel title legend colorbar savefig tight_layout grid set_xlim set_ylim plot scatter hist boxplot imshow cmap alpha bins tick_params annotate quiver contour barh stackplot subplots_adjust axhline axvline semilogx semilogy loglog polar streamplot hexbin pcolor tricontour errorbar clabel set_aspect violinplot set_axis_off spines text hatch plt axis plt.bar() plt.axis import figure pyplot highlight_text pypalettes plt.subplots() xlabel ylabel title legend colorbar savefig tight_layout grid set_xlim set_ylim plot scatter hist boxplot imshow cmap alpha bins tick_params annotate quiver contour barh stackplot subplots_adjust axhline axvline semilogx semilogy loglog polar streamplot hexbin pcolor tricontour errorbar clabel set_aspect violinplot set_axis_off spines text hatch plt axis plt.bar() plt.axis import figure pyplot highlight_text pypalettes plt.subplots() xlabel ylabel title legend colorbar savefig tight_layout grid set_xlim set_ylim plot scatter hist boxplot imshow cmap alpha bins tick_params annotate quiver contour barh stackplot subplots_adjust axhline axvline semilogx semilogy loglog polar streamplot hexbin pcolor tricontour errorbar clabel set_aspect violinplot set_axis_off spines text hatch plt axis plt.bar() plt.axis import figure pyplot highlight_text pypalettes plt.subplots() xlabel ylabel title legend colorbar savefig tight_layout grid set_xlim set_ylim plot scatter hist boxplot imshow cmap alpha bins tick_params annotate quiver contour barh stackplot subplots_adjust axhline axvline semilogx semilogy loglog polar streamplot hexbin pcolor tricontour errorbar clabel set_aspect violinplot set_axis_off spines text hatch plt axis plt.bar() plt.axis import figure pyplot highlight_text pypalettes plt.subplots() xlabel ylabel title legend colorbar savefig tight_layout grid set_xlim set_ylim plot scatter hist boxplot imshow cmap alpha bins tick_params annotate quiver contour barh stackplot subplots_adjust axhline axvline semilogx semilogy loglog polar streamplot hexbin pcolor tricontour errorbar clabel set_aspect violinplot set_axis_off spines text hatch plt axis plt.bar() plt.axis import figure pyplot highlight_text pypalettes plt.subplots() xlabel ylabel title legend colorbar savefig tight_layout grid set_xlim set_ylim plot scatter hist boxplot imshow cmap alpha bins tick_params annotate quiver contour barh stackplot subplots_adjust axhline axvline semilogx semilogy loglog polar streamplot hexbin pcolor tricontour errorbar clabel set_aspect violinplot set_axis_off spines text hatch plt axis plt.bar() plt.axis import figure pyplot highlight_text pypalettes plt.subplots() xlabel ylabel title legend colorbar savefig tight_layout grid set_xlim set_ylim plot scatter hist boxplot imshow cmap alpha bins tick_params annotate quiver contour barh stackplot subplots_adjust axhline axvline semilogx semilogy loglog polar streamplot hexbin pcolor tricontour errorbar clabel set_aspect violinplot set_axis_off spines text hatch plt axis plt.bar() plt.axis import figure pyplot highlight_text pypalettes plt.subplots() xlabel ylabel title legend colorbar savefig tight_layout grid set_xlim set_ylim plot scatter hist boxplot imshow cmap alpha bins tick_params annotate quiver contour barh stackplot subplots_adjust axhline axvline semilogx semilogy loglog polar streamplot hexbin pcolor tricontour errorbar clabel set_aspect violinplot set_axis_off spines text hatch plt axis plt.bar() plt.axis import figure pyplot highlight_text pypalettes plt.subplots() xlabel ylabel title legend colorbar savefig tight_layout grid set_xlim set_ylim plot scatter hist boxplot imshow cmap alpha bins tick_params annotate quiver contour barh stackplot subplots_adjust axhline axvline semilogx semilogy loglog polar streamplot hexbin pcolor tricontour errorbar clabel set_aspect violinplot set_axis_off spines text hatch plt axis plt.bar() plt.axis import figure pyplot highlight_text pypalettes plt.subplots() xlabel ylabel title legend colorbar savefig tight_layout grid set_xlim set_ylim plot scatter hist boxplot imshow cmap alpha bins tick_params annotate quiver contour barh stackplot subplots_adjust axhline axvline semilogx semilogy loglog polar streamplot hexbin pcolor tricontour errorbar clabel set_aspect violinplot set_axis_off spines text hatch plt axis plt.bar() plt.axis import figure pyplot highlight_text pypalettes plt.subplots() xlabel ylabel title legend colorbar savefig tight_layout grid set_xlim set_ylim plot scatter hist boxplot imshow cmap alpha bins tick_params annotate quiver contour barh stackplot subplots_adjust axhline axvline semilogx semilogy loglog polar streamplot hexbin pcolor tricontour errorbar clabel set_aspect violinplot set_axis_off spines text hatch plt axis plt.bar() plt.axis import figure pyplot highlight_text pypalettes plt.subplots() xlabel ylabel title legend colorbar savefig tight_layout grid set_xlim set_ylim plot scatter hist boxplot imshow cmap alpha bins tick_params annotate quiver contour barh stackplot subplots_adjust axhline axvline semilogx semilogy loglog polar streamplot hexbin pcolor tricontour errorbar clabel set_aspect violinplot set_axis_off spines text hatch plt axis plt.bar() plt.axis import figure pyplot highlight_text pypalettes plt.subplots() xlabel ylabel title legend colorbar savefig tight_layout grid set_xlim set_ylim plot scatter hist boxplot imshow cmap alpha bins tick_params annotate quiver contour barh stackplot subplots_adjust axhline axvline semilogx semilogy loglog polar streamplot hexbin pcolor tricontour errorbar clabel set_aspect violinplot set_axis_off spines text hatch plt axis plt.bar() plt.axis import figure pyplot highlight_text pypalettes plt.subplots() xlabel ylabel title legend colorbar savefig tight_layout grid set_xlim set_ylim plot scatter hist boxplot imshow cmap alpha bins tick_params annotate quiver contour barh stackplot subplots_adjust axhline axvline semilogx semilogy loglog polar streamplot hexbin pcolor tricontour errorbar clabel set_aspect violinplot set_axis_off spines text hatch plt axis plt.bar() plt.axis import figure pyplot highlight_text pypalettes plt.subplots() xlabel ylabel title legend colorbar savefig tight_layout grid set_xlim set_ylim plot scatter hist boxplot imshow cmap alpha bins tick_params annotate quiver contour barh stackplot subplots_adjust axhline axvline semilogx semilogy loglog polar streamplot hexbin pcolor tricontour errorbar clabel set_aspect violinplot set_axis_off spines text hatch plt axis plt.bar() plt.axis import figure pyplot highlight_text pypalettes plt.subplots() xlabel ylabel title legend colorbar savefig tight_layout grid set_xlim set_ylim plot scatter hist boxplot imshow cmap alpha bins tick_params annotate quiver contour barh stackplot subplots_adjust axhline axvline semilogx semilogy loglog polar streamplot hexbin pcolor tricontour errorbar clabel set_aspect violinplot set_axis_off spines text hatch plt axis plt.bar() plt.axis import figure pyplot highlight_text pypalettes plt.subplots() xlabel ylabel title legend colorbar savefig tight_layout grid set_xlim set_ylim plot scatter hist boxplot imshow cmap alpha bins tick_params annotate quiver contour barh stackplot subplots_adjust axhline axvline semilogx semilogy loglog polar streamplot hexbin pcolor tricontour errorbar clabel set_aspect violinplot set_axis_off spines text hatch plt axis plt.bar() plt.axis import figure pyplot highlight_text pypalettes plt.subplots() xlabel ylabel title legend colorbar savefig tight_layout grid set_xlim set_ylim plot scatter hist boxplot imshow cmap alpha bins tick_params annotate quiver contour barh stackplot subplots_adjust axhline axvline semilogx semilogy loglog polar streamplot hexbin pcolor tricontour errorbar clabel set_aspect violinplot set_axis_off spines text hatch plt axis plt.bar() plt.axis import figure pyplot highlight_text pypalettes plt.subplots() xlabel ylabel title legend colorbar savefig tight_layout grid set_xlim set_ylim plot scatter hist boxplot imshow cmap alpha bins tick_params annotate quiver contour barh stackplot subplots_adjust axhline axvline semilogx semilogy loglog polar streamplot hexbin pcolor tricontour errorbar clabel set_aspect violinplot set_axis_off spines text hatch plt axis plt.bar() plt.axis import figure pyplot highlight_text pypalettes plt.subplots() xlabel ylabel title legend colorbar savefig tight_layout grid set_xlim set_ylim plot scatter hist boxplot imshow cmap alpha bins tick_params annotate quiver contour barh stackplot subplots_adjust axhline axvline semilogx semilogy loglog polar streamplot hexbin pcolor tricontour errorbar clabel set_aspect violinplot set_axis_off spines text hatch plt axis plt.bar() plt.axis import figure pyplot highlight_text pypalettes plt.subplots() xlabel ylabel title legend colorbar savefig tight_layout grid set_xlim set_ylim plot scatter hist boxplot imshow cmap alpha bins tick_params annotate quiver contour barh stackplot subplots_adjust axhline axvline semilogx semilogy loglog polar streamplot hexbin pcolor tricontour errorbar clabel set_aspect violinplot set_axis_off spines text hatch plt axis plt.bar() plt.axis import figure pyplot highlight_text pypalettes plt.subplots() xlabel ylabel title legend colorbar savefig tight_layout grid set_xlim set_ylim plot scatter hist boxplot imshow cmap alpha bins tick_params annotate quiver contour barh stackplot subplots_adjust axhline axvline semilogx semilogy loglog polar streamplot hexbin pcolor tricontour errorbar clabel set_aspect violinplot set_axis_off spines text hatch plt axis plt.bar() plt.axis import figure pyplot highlight_text pypalettes plt.subplots() xlabel ylabel title legend colorbar savefig tight_layout grid set_xlim set_ylim plot scatter hist boxplot imshow cmap alpha bins tick_params annotate quiver contour barh stackplot subplots_adjust axhline axvline semilogx semilogy loglog polar streamplot hexbin pcolor tricontour errorbar clabel set_aspect violinplot set_axis_off spines text hatch plt axis plt.bar() plt.axis import figure pyplot highlight_text pypalettes plt.subplots() xlabel ylabel title legend colorbar savefig tight_layout grid set_xlim set_ylim plot scatter hist boxplot imshow cmap alpha bins tick_params annotate quiver contour barh stackplot subplots_adjust axhline axvline semilogx semilogy loglog polar streamplot hexbin pcolor tricontour errorbar clabel set_aspect violinplot set_axis_off spines text hatch plt axis plt.bar() plt.axis import figure pyplot highlight_text pypalettes plt.subplots() xlabel ylabel title legend colorbar savefig tight_layout grid set_xlim set_ylim plot scatter hist boxplot imshow cmap alpha bins tick_params annotate quiver contour barh stackplot subplots_adjust axhline axvline semilogx semilogy loglog polar streamplot hexbin pcolor tricontour errorbar clabel set_aspect violinplot set_axis_off spines text hatch plt axis plt.bar() plt.axis import figure pyplot highlight_text pypalettes plt.subplots() xlabel ylabel title legend colorbar savefig tight_layout grid set_xlim set_ylim plot scatter hist boxplot imshow cmap alpha bins tick_params annotate quiver contour barh stackplot subplots_adjust axhline axvline semilogx semilogy loglog polar streamplot hexbin pcolor tricontour errorbar clabel set_aspect violinplot set_axis_off spines text hatch plt axis plt.bar() plt.axis import figure pyplot highlight_text pypalettes plt.subplots() xlabel ylabel title legend colorbar savefig tight_layout grid set_xlim set_ylim plot scatter hist boxplot imshow cmap alpha bins tick_params annotate quiver contour barh stackplot subplots_adjust axhline axvline semilogx semilogy loglog polar streamplot hexbin pcolor tricontour errorbar clabel set_aspect violinplot set_axis_off spines text hatch plt axis plt.bar() plt.axis import figure pyplot highlight_text pypalettes plt.subplots() xlabel ylabel title legend colorbar savefig tight_layout grid set_xlim set_ylim plot scatter hist boxplot imshow cmap alpha bins tick_params annotate quiver contour barh stackplot subplots_adjust axhline axvline semilogx semilogy loglog polar streamplot hexbin pcolor tricontour errorbar clabel set_aspect violinplot set_axis_off spines text hatch plt axis plt.bar() plt.axis import figure pyplot highlight_text pypalettes plt.subplots() xlabel ylabel title legend colorbar savefig tight_layout grid set_xlim set_ylim plot scatter hist boxplot imshow cmap alpha bins tick_params annotate quiver contour barh stackplot subplots_adjust axhline axvline semilogx semilogy loglog polar streamplot hexbin pcolor tricontour errorbar clabel set_aspect violinplot set_axis_off spines text hatch plt axis plt.bar() plt.axis import figure pyplot highlight_text pypalettes plt.subplots() xlabel ylabel title legend colorbar savefig tight_layout grid set_xlim set_ylim plot scatter hist boxplot imshow cmap alpha bins tick_params annotate quiver contour barh stackplot subplots_adjust axhline axvline semilogx semilogy loglog polar streamplot hexbin pcolor tricontour errorbar clabel set_aspect violinplot set_axis_off spines text hatch plt axis plt.bar() plt.axis import figure pyplot highlight_text pypalettes plt.subplots() xlabel ylabel title legend colorbar savefig tight_layout grid set_xlim set_ylim plot scatter hist boxplot imshow cmap alpha bins tick_params annotate quiver contour barh stackplot subplots_adjust axhline axvline semilogx semilogy loglog polar streamplot hexbin pcolor tricontour errorbar clabel set_aspect violinplot set_axis_off spines text hatch plt axis plt.bar() plt.axis import figure pyplot highlight_text pypalettes plt.subplots() xlabel ylabel title legend colorbar savefig tight_layout grid set_xlim set_ylim plot scatter hist boxplot imshow cmap alpha bins tick_params annotate quiver contour barh stackplot subplots_adjust axhline axvline semilogx semilogy loglog polar streamplot hexbin pcolor tricontour errorbar clabel set_aspect violinplot set_axis_off spines text hatch plt axis plt.bar() plt.axis import figure pyplot highlight_text pypalettes plt.subplots() xlabel ylabel title legend colorbar savefig tight_layout grid set_xlim set_ylim plot scatter hist boxplot imshow cmap alpha bins tick_params annotate quiver contour barh stackplot subplots_adjust axhline axvline semilogx semilogy loglog polar streamplot hexbin pcolor tricontour errorbar clabel set_aspect violinplot set_axis_off spines text hatch plt axis plt.bar() plt.axis import figure pyplot highlight_text pypalettes plt.subplots() xlabel ylabel title legend colorbar savefig tight_layout grid set_xlim set_ylim plot scatter hist boxplot imshow cmap alpha bins tick_params annotate quiver contour barh stackplot subplots_adjust axhline axvline semilogx semilogy loglog polar streamplot hexbin pcolor tricontour errorbar clabel set_aspect violinplot set_axis_off spines text hatch plt axis plt.bar() plt.axis import figure pyplot highlight_text pypalettes plt.subplots() xlabel ylabel title legend colorbar savefig tight_layout grid set_xlim set_ylim plot scatter hist boxplot imshow cmap alpha bins tick_params annotate quiver contour barh stackplot subplots_adjust axhline axvline semilogx semilogy loglog polar streamplot hexbin pcolor tricontour errorbar clabel set_aspect violinplot set_axis_off spines text hatch plt axis plt.bar() plt.axis import figure pyplot highlight_text pypalettes plt.subplots() xlabel ylabel title legend colorbar savefig tight_layout grid set_xlim set_ylim plot scatter hist boxplot imshow cmap alpha bins tick_params annotate quiver contour barh stackplot subplots_adjust axhline axvline semilogx semilogy loglog polar streamplot hexbin pcolor tricontour errorbar clabel set_aspect violinplot set_axis_off spines text hatch plt axis plt.bar() plt.axis import figure pyplot highlight_text pypalettes plt.subplots() xlabel ylabel title legend colorbar savefig tight_layout grid set_xlim set_ylim plot scatter hist boxplot imshow cmap alpha bins tick_params annotate quiver contour barh stackplot subplots_adjust axhline axvline semilogx semilogy loglog polar streamplot hexbin pcolor tricontour errorbar clabel set_aspect violinplot set_axis_off spines text hatch plt axis plt.bar() plt.axis import figure pyplot highlight_text pypalettes plt.subplots() xlabel ylabel title legend colorbar savefig tight_layout grid set_xlim set_ylim plot scatter hist boxplot imshow cmap alpha bins tick_params annotate quiver contour barh stackplot subplots_adjust axhline axvline semilogx semilogy loglog polar streamplot hexbin pcolor tricontour errorbar clabel set_aspect violinplot set_axis_off spines text hatch plt axis plt.bar() plt.axis import figure pyplot highlight_text pypalettes plt.subplots() xlabel ylabel title legend colorbar savefig tight_layout grid set_xlim set_ylim plot scatter hist boxplot imshow cmap alpha bins tick_params annotate quiver contour barh stackplot subplots_adjust axhline axvline semilogx semilogy loglog polar streamplot hexbin pcolor tricontour errorbar clabel set_aspect violinplot set_axis_off spines text hatch plt axis plt.bar() plt.axis import figure pyplot highlight_text pypalettes plt.subplots() xlabel ylabel title legend colorbar savefig tight_layout grid set_xlim set_ylim plot scatter hist boxplot imshow cmap alpha bins tick_params annotate quiver contour barh stackplot subplots_adjust axhline axvline semilogx semilogy loglog polar streamplot hexbin pcolor tricontour errorbar clabel set_aspect violinplot set_axis_off spines text hatch plt axis plt.bar() plt.axis import figure pyplot highlight_text pypalettes plt.subplots() xlabel ylabel title legend colorbar savefig tight_layout grid set_xlim set_ylim plot scatter hist boxplot imshow cmap alpha bins tick_params annotate quiver contour barh stackplot subplots_adjust axhline axvline semilogx semilogy loglog polar streamplot hexbin pcolor tricontour errorbar clabel set_aspect violinplot set_axis_off spines text hatch plt axis plt.bar() plt.axis import figure pyplot highlight_text pypalettes plt.subplots() xlabel ylabel title legend colorbar savefig tight_layout grid set_xlim set_ylim plot scatter hist boxplot imshow cmap alpha bins tick_params annotate quiver contour barh stackplot subplots_adjust axhline axvline semilogx semilogy loglog polar streamplot hexbin pcolor tricontour errorbar clabel set_aspect violinplot set_axis_off spines text hatch plt axis plt.bar() plt.axis import figure pyplot highlight_text pypalettes plt.subplots() xlabel ylabel title legend colorbar savefig tight_layout grid set_xlim set_ylim plot scatter hist boxplot imshow cmap alpha bins tick_params annotate quiver contour barh stackplot subplots_adjust axhline axvline semilogx semilogy loglog polar streamplot hexbin pcolor tricontour errorbar clabel set_aspect violinplot set_axis_off spines text hatch plt axis plt.bar() plt.axis import figure pyplot highlight_text pypalettes plt.subplots() xlabel ylabel title legend colorbar savefig tight_layout grid set_xlim set_ylim plot scatter hist boxplot imshow cmap alpha bins tick_params annotate quiver contour barh stackplot subplots_adjust axhline axvline semilogx semilogy loglog polar streamplot hexbin pcolor tricontour errorbar clabel set_aspect violinplot set_axis_off spines text hatch plt axis plt.bar() plt.axis import figure pyplot highlight_text pypalettes plt.subplots() xlabel ylabel title legend colorbar savefig tight_layout grid set_xlim set_ylim plot scatter hist boxplot imshow cmap alpha bins tick_params annotate quiver contour barh stackplot subplots_adjust axhline axvline semilogx semilogy loglog polar streamplot hexbin pcolor tricontour errorbar clabel set_aspect violinplot set_axis_off spines text hatch plt axis plt.bar() plt.axis import figure pyplot highlight_text pypalettes plt.subplots() xlabel ylabel title legend colorbar savefig tight_layout grid set_xlim set_ylim plot scatter hist boxplot imshow cmap alpha bins tick_params annotate quiver contour barh stackplot subplots_adjust axhline axvline semilogx semilogy loglog polar streamplot hexbin pcolor tricontour errorbar clabel set_aspect violinplot set_axis_off spines text hatch plt axis plt.bar() plt.axis import figure pyplot highlight_text pypalettes plt.subplots() xlabel ylabel title legend colorbar savefig tight_layout grid set_xlim set_ylim plot scatter hist boxplot imshow cmap alpha bins tick_params annotate quiver contour barh stackplot subplots_adjust axhline axvline semilogx semilogy loglog polar streamplot hexbin pcolor tricontour errorbar clabel set_aspect violinplot set_axis_off spines text hatch plt axis plt.bar() plt.axis import figure pyplot highlight_text pypalettes plt.subplots() xlabel ylabel title legend colorbar savefig tight_layout grid set_xlim set_ylim plot scatter hist boxplot imshow cmap alpha bins tick_params annotate quiver contour barh stackplot subplots_adjust axhline axvline semilogx semilogy loglog polar streamplot hexbin pcolor tricontour errorbar clabel set_aspect violinplot set_axis_off spines text hatch plt axis plt.bar() plt.axis import figure pyplot highlight_text pypalettes plt.subplots() xlabel ylabel title legend colorbar savefig tight_layout grid set_xlim set_ylim plot scatter hist boxplot imshow cmap alpha bins tick_params annotate quiver contour barh stackplot subplots_adjust axhline axvline semilogx semilogy loglog polar streamplot hexbin pcolor tricontour errorbar clabel set_aspect violinplot set_axis_off spines text hatch plt axis plt.bar() plt.axis import figure pyplot highlight_text pypalettes plt.subplots() xlabel ylabel title legend colorbar savefig tight_layout grid set_xlim set_ylim plot scatter hist boxplot imshow cmap alpha bins tick_params annotate quiver contour barh stackplot subplots_adjust axhline axvline semilogx semilogy loglog polar streamplot hexbin pcolor tricontour errorbar clabel set_aspect violinplot set_axis_off spines text hatch plt axis plt.bar() plt.axis import figure pyplot highlight_text pypalettes plt.subplots() xlabel ylabel title legend colorbar savefig tight_layout grid set_xlim set_ylim plot scatter hist boxplot imshow cmap alpha bins tick_params annotate quiver contour barh stackplot subplots_adjust axhline axvline semilogx semilogy loglog polar streamplot hexbin pcolor tricontour errorbar clabel set_aspect violinplot set_axis_off spines text hatch plt axis plt.bar() plt.axis import figure pyplot highlight_text pypalettes plt.subplots() xlabel ylabel title legend colorbar savefig tight_layout grid set_xlim set_ylim plot scatter hist boxplot imshow cmap alpha bins tick_params annotate quiver contour barh stackplot subplots_adjust axhline axvline semilogx semilogy loglog polar streamplot hexbin pcolor tricontour errorbar clabel set_aspect violinplot set_axis_off spines text hatch plt axis plt.bar() plt.axis import figure pyplot highlight_text pypalettes plt.subplots() xlabel ylabel title legend colorbar savefig tight_layout grid set_xlim set_ylim plot scatter hist boxplot imshow cmap alpha bins tick_params annotate quiver contour barh stackplot subplots_adjust axhline axvline semilogx semilogy loglog polar streamplot hexbin pcolor tricontour errorbar clabel set_aspect violinplot set_axis_off spines text hatch plt axis plt.bar() plt.axis import figure pyplot highlight_text pypalettes plt.subplots() xlabel ylabel title legend colorbar savefig tight_layout grid set_xlim set_ylim plot scatter hist boxplot imshow cmap alpha bins tick_params annotate quiver contour barh stackplot subplots_adjust axhline axvline semilogx semilogy loglog polar streamplot hexbin pcolor tricontour errorbar clabel set_aspect violinplot set_axis_off spines text hatch plt axis plt.bar() plt.axis import figure pyplot highlight_text pypalettes plt.subplots() xlabel ylabel title legend colorbar savefig tight_layout grid set_xlim set_ylim plot scatter hist boxplot imshow cmap alpha bins tick_params annotate quiver contour barh stackplot subplots_adjust axhline axvline semilogx semilogy loglog polar streamplot hexbin pcolor tricontour errorbar clabel set_aspect violinplot set_axis_off spines text hatch plt axis plt.bar() plt.axis import figure pyplot highlight_text pypalettes plt.subplots() xlabel ylabel title legend colorbar savefig tight_layout grid set_xlim set_ylim plot scatter hist boxplot imshow cmap alpha bins tick_params annotate quiver contour barh stackplot subplots_adjust axhline axvline semilogx semilogy loglog polar streamplot hexbin pcolor tricontour errorbar clabel set_aspect violinplot set_axis_off spines text hatch plt axis plt.bar() plt.axis import figure pyplot highlight_text pypalettes plt.subplots() xlabel ylabel title legend colorbar savefig tight_layout grid set_xlim set_ylim plot scatter hist boxplot imshow cmap alpha bins tick_params annotate quiver contour barh stackplot subplots_adjust axhline axvline semilogx semilogy loglog polar streamplot hexbin pcolor tricontour errorbar clabel set_aspect violinplot set_axis_off spines text hatch plt axis plt.bar() plt.axis import figure pyplot highlight_text pypalettes plt.subplots() xlabel ylabel title legend colorbar savefig tight_layout grid set_xlim set_ylim plot scatter hist boxplot imshow cmap alpha bins tick_params annotate quiver contour barh stackplot subplots_adjust axhline axvline semilogx semilogy loglog polar streamplot hexbin pcolor tricontour errorbar clabel set_aspect violinplot set_axis_off spines text hatch plt axis plt.bar() plt.axis import figure pyplot highlight_text pypalettes plt.subplots() xlabel ylabel title legend colorbar savefig tight_layout grid set_xlim set_ylim plot scatter hist boxplot imshow cmap alpha bins tick_params annotate quiver contour barh stackplot subplots_adjust axhline axvline semilogx semilogy loglog polar streamplot hexbin pcolor tricontour errorbar clabel set_aspect violinplot set_axis_off spines text hatch plt axis plt.bar() plt.axis import figure pyplot highlight_text pypalettes plt.subplots() xlabel ylabel title legend colorbar savefig tight_layout grid set_xlim set_ylim plot scatter hist boxplot imshow cmap alpha bins tick_params annotate quiver contour barh stackplot subplots_adjust axhline axvline semilogx semilogy loglog polar streamplot hexbin pcolor tricontour errorbar clabel set_aspect violinplot set_axis_off spines text hatch plt axis plt.bar() plt.axis import figure pyplot highlight_text pypalettes plt.subplots() xlabel ylabel title legend colorbar savefig tight_layout grid set_xlim set_ylim plot scatter hist boxplot imshow cmap alpha bins tick_params annotate quiver contour barh stackplot subplots_adjust axhline axvline semilogx semilogy loglog polar streamplot hexbin pcolor tricontour errorbar clabel set_aspect violinplot set_axis_off spines text hatch plt axis plt.bar() plt.axis import figure pyplot highlight_text pypalettes plt.subplots() xlabel ylabel title legend colorbar savefig tight_layout grid set_xlim set_ylim plot scatter hist boxplot imshow cmap alpha bins tick_params annotate quiver contour barh stackplot subplots_adjust axhline axvline semilogx semilogy loglog polar streamplot hexbin pcolor tricontour errorbar clabel set_aspect violinplot set_axis_off spines text hatch plt axis plt.bar() plt.axis import figure pyplot highlight_text pypalettes plt.subplots() xlabel ylabel title legend colorbar savefig tight_layout grid set_xlim set_ylim plot scatter hist boxplot imshow cmap alpha bins tick_params annotate quiver contour barh stackplot subplots_adjust axhline axvline semilogx semilogy loglog polar streamplot hexbin pcolor tricontour errorbar clabel set_aspect violinplot set_axis_off spines text hatch plt axis plt.bar() plt.axis import figure pyplot highlight_text pypalettes plt.subplots() xlabel ylabel title legend colorbar savefig tight_layout grid set_xlim set_ylim plot scatter hist boxplot imshow cmap alpha bins tick_params annotate quiver contour barh stackplot subplots_adjust axhline axvline semilogx semilogy loglog polar streamplot hexbin pcolor tricontour errorbar clabel set_aspect violinplot set_axis_off spines text hatch plt axis plt.bar() plt.axis import figure pyplot highlight_text pypalettes plt.subplots() xlabel ylabel title legend colorbar savefig tight_layout grid set_xlim set_ylim plot scatter hist boxplot imshow cmap alpha bins tick_params annotate quiver contour barh stackplot subplots_adjust axhline axvline semilogx semilogy loglog polar streamplot hexbin pcolor tricontour errorbar clabel set_aspect violinplot set_axis_off spines text hatch plt axis plt.bar() plt.axis import figure pyplot highlight_text pypalettes plt.subplots() xlabel ylabel title legend colorbar savefig tight_layout grid set_xlim set_ylim plot scatter hist boxplot imshow cmap alpha bins tick_params annotate quiver contour barh stackplot subplots_adjust axhline axvline semilogx semilogy loglog polar streamplot hexbin pcolor tricontour errorbar clabel set_aspect violinplot set_axis_off spines text hatch plt axis plt.bar() plt.axis import figure pyplot highlight_text pypalettes plt.subplots() xlabel ylabel title legend colorbar savefig tight_layout grid set_xlim set_ylim plot scatter hist boxplot imshow cmap alpha bins tick_params annotate quiver contour barh stackplot subplots_adjust axhline axvline semilogx semilogy loglog polar streamplot hexbin pcolor tricontour errorbar clabel set_aspect violinplot set_axis_off spines text hatch plt axis plt.bar() plt.axis import figure pyplot highlight_text pypalettes plt.subplots() xlabel ylabel title legend colorbar savefig tight_layout grid set_xlim set_ylim plot scatter hist boxplot imshow cmap alpha bins tick_params annotate quiver contour barh stackplot subplots_adjust axhline axvline semilogx semilogy loglog polar streamplot hexbin pcolor tricontour errorbar clabel set_aspect violinplot set_axis_off spines text hatch plt axis plt.bar() plt.axis import figure pyplot highlight_text pypalettes plt.subplots() xlabel ylabel title legend colorbar savefig tight_layout grid set_xlim set_ylim plot scatter hist boxplot imshow cmap alpha bins tick_params annotate quiver contour barh stackplot subplots_adjust axhline axvline semilogx semilogy loglog polar streamplot hexbin pcolor tricontour errorbar clabel set_aspect violinplot set_axis_off spines text hatch plt axis plt.bar() plt.axis import figure pyplot highlight_text pypalettes plt.subplots() xlabel ylabel title legend colorbar savefig tight_layout grid set_xlim set_ylim plot scatter hist boxplot imshow cmap alpha bins tick_params annotate quiver contour barh stackplot subplots_adjust axhline axvline semilogx semilogy loglog polar streamplot hexbin pcolor tricontour errorbar clabel set_aspect violinplot set_axis_off spines text hatch plt axis plt.bar() plt.axis import figure pyplot highlight_text pypalettes plt.subplots() xlabel ylabel title legend colorbar savefig tight_layout grid set_xlim set_ylim plot scatter hist boxplot imshow cmap alpha bins tick_params annotate quiver contour barh stackplot subplots_adjust axhline axvline semilogx semilogy loglog polar streamplot hexbin pcolor tricontour errorbar clabel set_aspect violinplot set_axis_off spines text hatch plt axis plt.bar() plt.axis import figure pyplot highlight_text pypalettes plt.subplots() xlabel ylabel title legend colorbar savefig tight_layout grid set_xlim set_ylim plot scatter hist boxplot imshow cmap alpha bins tick_params annotate quiver contour barh stackplot subplots_adjust axhline axvline semilogx semilogy loglog polar streamplot hexbin pcolor tricontour errorbar clabel set_aspect violinplot set_axis_off spines text hatch plt axis plt.bar() plt.axis import figure pyplot highlight_text pypalettes plt.subplots() xlabel ylabel title legend colorbar savefig tight_layout grid set_xlim set_ylim plot scatter hist boxplot imshow cmap alpha bins tick_params annotate quiver contour barh stackplot subplots_adjust axhline axvline semilogx semilogy loglog polar streamplot hexbin pcolor tricontour errorbar clabel set_aspect violinplot set_axis_off spines text hatch plt axis plt.bar() plt.axis import figure pyplot highlight_text pypalettes plt.subplots() xlabel ylabel title legend colorbar savefig tight_layout grid set_xlim set_ylim plot scatter hist boxplot imshow cmap alpha bins tick_params annotate quiver contour barh stackplot subplots_adjust axhline axvline semilogx semilogy loglog polar streamplot hexbin pcolor tricontour errorbar clabel set_aspect violinplot set_axis_off spines text hatch plt axis plt.bar() plt.axis import figure pyplot highlight_text pypalettes plt.subplots() xlabel ylabel title legend colorbar savefig tight_layout grid set_xlim set_ylim plot scatter hist boxplot imshow cmap alpha bins tick_params annotate quiver contour barh stackplot subplots_adjust axhline axvline semilogx semilogy loglog polar streamplot hexbin pcolor tricontour errorbar clabel set_aspect violinplot set_axis_off spines text hatch plt axis plt.bar() plt.axis import figure pyplot highlight_text pypalettes plt.subplots() xlabel ylabel title legend colorbar savefig tight_layout grid set_xlim set_ylim plot scatter hist boxplot imshow cmap alpha bins tick_params annotate quiver contour barh stackplot subplots_adjust axhline axvline semilogx semilogy loglog polar streamplot hexbin pcolor tricontour errorbar clabel set_aspect violinplot set_axis_off spines text hatch plt axis plt.bar() plt.axis import figure pyplot highlight_text pypalettes plt.subplots() xlabel ylabel title legend colorbar savefig tight_layout grid set_xlim set_ylim plot scatter hist boxplot imshow cmap alpha bins tick_params annotate quiver contour barh stackplot subplots_adjust axhline axvline semilogx semilogy loglog polar streamplot hexbin pcolor tricontour errorbar clabel set_aspect violinplot set_axis_off spines text hatch plt axis plt.bar() plt.axis import figure pyplot highlight_text pypalettes plt.subplots() xlabel ylabel title legend colorbar savefig tight_layout grid set_xlim set_ylim plot scatter hist boxplot imshow cmap alpha bins tick_params annotate quiver contour barh stackplot subplots_adjust axhline axvline semilogx semilogy loglog polar streamplot hexbin pcolor tricontour errorbar clabel set_aspect violinplot set_axis_off spines text hatch plt axis plt.bar() plt.axis import figure pyplot highlight_text pypalettes plt.subplots() xlabel ylabel title legend colorbar savefig tight_layout grid set_xlim set_ylim plot scatter hist boxplot imshow cmap alpha bins tick_params annotate quiver contour barh stackplot subplots_adjust axhline axvline semilogx semilogy loglog polar streamplot hexbin pcolor tricontour errorbar clabel set_aspect violinplot set_axis_off spines text hatch plt axis plt.bar() plt.axis import figure pyplot highlight_text pypalettes plt.subplots() xlabel ylabel title legend colorbar savefig tight_layout grid set_xlim set_ylim plot scatter hist boxplot imshow cmap alpha bins tick_params annotate quiver contour barh stackplot subplots_adjust axhline axvline semilogx semilogy loglog polar streamplot hexbin pcolor tricontour errorbar clabel set_aspect violinplot set_axis_off spines text hatch plt axis plt.bar() plt.axis import figure pyplot highlight_text pypalettes plt.subplots() xlabel ylabel title legend colorbar savefig tight_layout grid set_xlim set_ylim plot scatter hist boxplot imshow cmap alpha bins tick_params annotate quiver contour barh stackplot subplots_adjust axhline axvline semilogx semilogy loglog polar streamplot hexbin pcolor tricontour errorbar clabel set_aspect violinplot set_axis_off spines text hatch plt axis plt.bar() plt.axis import figure pyplot highlight_text pypalettes plt.subplots() xlabel ylabel title legend colorbar savefig tight_layout grid set_xlim set_ylim plot scatter hist boxplot imshow cmap alpha bins tick_params annotate quiver contour barh stackplot subplots_adjust axhline axvline semilogx semilogy loglog polar streamplot hexbin pcolor tricontour errorbar clabel set_aspect violinplot set_axis_off spines text hatch plt axis plt.bar() plt.axis import figure pyplot highlight_text pypalettes plt.subplots() xlabel ylabel title legend colorbar savefig tight_layout grid set_xlim set_ylim plot scatter hist boxplot imshow cmap alpha bins tick_params annotate quiver contour barh stackplot subplots_adjust axhline axvline semilogx semilogy loglog polar streamplot hexbin pcolor tricontour errorbar clabel set_aspect violinplot set_axis_off spines text hatch plt axis plt.bar() plt.axis import figure pyplot highlight_text pypalettes plt.subplots() xlabel ylabel title legend colorbar savefig tight_layout grid set_xlim set_ylim plot scatter hist boxplot imshow cmap alpha bins tick_params annotate quiver contour barh stackplot subplots_adjust axhline axvline semilogx semilogy loglog polar streamplot hexbin pcolor tricontour errorbar clabel set_aspect violinplot set_axis_off spines text hatch plt axis plt.bar() plt.axis import figure pyplot highlight_text pypalettes plt.subplots() xlabel ylabel title legend colorbar savefig tight_layout grid set_xlim set_ylim plot scatter hist boxplot imshow cmap alpha bins tick_params annotate quiver contour barh stackplot subplots_adjust axhline axvline semilogx semilogy loglog polar streamplot hexbin pcolor tricontour errorbar clabel set_aspect violinplot set_axis_off spines text hatch plt axis plt.bar() plt.axis import figure pyplot highlight_text pypalettes plt.subplots() xlabel ylabel title legend colorbar savefig tight_layout grid set_xlim set_ylim plot scatter hist boxplot imshow cmap alpha bins tick_params annotate quiver contour barh stackplot subplots_adjust axhline axvline semilogx semilogy loglog polar streamplot hexbin pcolor tricontour errorbar clabel set_aspect violinplot set_axis_off spines text hatch plt axis plt.bar() plt.axis import figure pyplot highlight_text pypalettes plt.subplots() xlabel ylabel title legend colorbar savefig tight_layout grid set_xlim set_ylim plot scatter hist boxplot imshow cmap alpha bins tick_params annotate quiver contour barh stackplot subplots_adjust axhline axvline semilogx semilogy loglog polar streamplot hexbin pcolor tricontour errorbar clabel set_aspect violinplot set_axis_off spines text hatch plt axis plt.bar() plt.axis import figure pyplot highlight_text pypalettes plt.subplots() xlabel ylabel title legend colorbar savefig tight_layout grid set_xlim set_ylim plot scatter hist boxplot imshow cmap alpha bins tick_params annotate quiver contour barh stackplot subplots_adjust axhline axvline semilogx semilogy loglog polar streamplot hexbin pcolor tricontour errorbar clabel set_aspect violinplot set_axis_off spines text hatch plt axis plt.bar() plt.axis import figure pyplot highlight_text pypalettes plt.subplots() xlabel ylabel title legend colorbar savefig tight_layout grid set_xlim set_ylim plot scatter hist boxplot imshow cmap alpha bins tick_params annotate quiver contour barh stackplot subplots_adjust axhline axvline semilogx semilogy loglog polar streamplot hexbin pcolor tricontour errorbar clabel set_aspect violinplot set_axis_off spines text hatch plt axis plt.bar() plt.axis import figure pyplot highlight_text pypalettes plt.subplots() xlabel ylabel title legend colorbar savefig tight_layout grid set_xlim set_ylim plot scatter hist boxplot imshow cmap alpha bins tick_params annotate quiver contour barh stackplot subplots_adjust axhline axvline semilogx semilogy loglog polar streamplot hexbin pcolor tricontour errorbar clabel set_aspect violinplot set_axis_off spines text hatch plt axis plt.bar() plt.axis import figure pyplot highlight_text pypalettes plt.subplots() xlabel ylabel title legend colorbar savefig tight_layout grid set_xlim set_ylim plot scatter hist boxplot imshow cmap alpha bins tick_params annotate quiver contour barh stackplot subplots_adjust axhline axvline semilogx semilogy loglog polar streamplot hexbin pcolor tricontour errorbar clabel set_aspect violinplot set_axis_off spines text hatch plt axis plt.bar() plt.axis import figure pyplot highlight_text pypalettes plt.subplots() xlabel ylabel title legend colorbar savefig tight_layout grid set_xlim set_ylim plot scatter hist boxplot imshow cmap alpha bins tick_params annotate quiver contour barh stackplot subplots_adjust axhline axvline semilogx semilogy loglog polar streamplot hexbin pcolor tricontour errorbar clabel set_aspect violinplot set_axis_off spines text hatch plt axis plt.bar() plt.axis import figure pyplot highlight_text pypalettes plt.subplots() xlabel ylabel title legend colorbar savefig tight_layout grid set_xlim set_ylim plot scatter hist boxplot imshow cmap alpha bins tick_params annotate quiver contour barh stackplot subplots_adjust axhline axvline semilogx semilogy loglog polar streamplot hexbin pcolor tricontour errorbar clabel set_aspect violinplot set_axis_off spines text hatch plt axis plt.bar() plt.axis import figure pyplot highlight_text pypalettes plt.subplots() xlabel ylabel title legend colorbar savefig tight_layout grid set_xlim set_ylim plot scatter hist boxplot imshow cmap alpha bins tick_params annotate quiver contour barh stackplot subplots_adjust axhline axvline semilogx semilogy loglog polar streamplot hexbin pcolor tricontour errorbar clabel set_aspect violinplot set_axis_off spines text hatch plt axis plt.bar() plt.axis import figure pyplot highlight_text pypalettes plt.subplots() xlabel ylabel title legend colorbar savefig tight_layout grid set_xlim set_ylim plot scatter hist boxplot imshow cmap alpha bins tick_params annotate quiver contour barh stackplot subplots_adjust axhline axvline semilogx semilogy loglog polar streamplot hexbin pcolor tricontour errorbar clabel set_aspect violinplot set_axis_off spines text hatch plt axis plt.bar() plt.axis import figure pyplot highlight_text pypalettes plt.subplots() xlabel ylabel title legend colorbar savefig tight_layout grid set_xlim set_ylim plot scatter hist boxplot imshow cmap alpha bins tick_params annotate quiver contour barh stackplot subplots_adjust axhline axvline semilogx semilogy loglog polar streamplot hexbin pcolor tricontour errorbar clabel set_aspect violinplot set_axis_off spines text hatch plt axis plt.bar() plt.axis import figure pyplot highlight_text pypalettes plt.subplots() xlabel ylabel title legend colorbar savefig tight_layout grid set_xlim set_ylim plot scatter hist boxplot imshow cmap alpha bins tick_params annotate quiver contour barh stackplot subplots_adjust axhline axvline semilogx semilogy loglog polar streamplot hexbin pcolor tricontour errorbar clabel set_aspect violinplot set_axis_off spines text hatch plt axis plt.bar() plt.axis import figure pyplot highlight_text pypalettes plt.subplots() xlabel ylabel title legend colorbar savefig tight_layout grid set_xlim set_ylim plot scatter hist boxplot imshow cmap alpha bins tick_params annotate quiver contour barh stackplot subplots_adjust axhline axvline semilogx semilogy loglog polar streamplot hexbin pcolor tricontour errorbar clabel set_aspect violinplot set_axis_off spines text hatch plt axis plt.bar() plt.axis import figure pyplot highlight_text pypalettes plt.subplots() xlabel ylabel title legend colorbar savefig tight_layout grid set_xlim set_ylim plot scatter hist boxplot imshow cmap alpha bins tick_params annotate quiver contour barh stackplot subplots_adjust axhline axvline semilogx semilogy loglog polar streamplot hexbin pcolor tricontour errorbar clabel set_aspect violinplot set_axis_off spines text hatch plt axis plt.bar() plt.axis import figure pyplot highlight_text pypalettes plt.subplots() xlabel ylabel title legend colorbar savefig tight_layout grid set_xlim set_ylim plot scatter hist boxplot imshow cmap alpha bins tick_params annotate quiver contour barh stackplot subplots_adjust axhline axvline semilogx semilogy loglog polar streamplot hexbin pcolor tricontour errorbar clabel set_aspect violinplot set_axis_off spines text hatch plt axis plt.bar() plt.axis import figure pyplot highlight_text pypalettes plt.subplots() xlabel ylabel title legend colorbar savefig tight_layout grid set_xlim set_ylim plot scatter hist boxplot imshow cmap alpha bins tick_params annotate quiver contour barh stackplot subplots_adjust axhline axvline semilogx semilogy loglog polar streamplot hexbin pcolor tricontour errorbar clabel set_aspect violinplot set_axis_off spines text hatch plt axis plt.bar() plt.axis import figure pyplot highlight_text pypalettes plt.subplots() xlabel ylabel title legend colorbar savefig tight_layout grid set_xlim set_ylim plot scatter hist boxplot imshow cmap alpha bins tick_params annotate quiver contour barh stackplot subplots_adjust axhline axvline semilogx semilogy loglog polar streamplot hexbin pcolor tricontour errorbar clabel set_aspect violinplot set_axis_off spines text hatch plt axis plt.bar() plt.axis import figure pyplot highlight_text pypalettes plt.subplots() xlabel ylabel title legend colorbar savefig tight_layout grid set_xlim set_ylim plot scatter hist boxplot imshow cmap alpha bins tick_params annotate quiver contour barh stackplot subplots_adjust axhline axvline semilogx semilogy loglog polar streamplot hexbin pcolor tricontour errorbar clabel set_aspect violinplot set_axis_off spines text hatch plt axis plt.bar() plt.axis import figure pyplot highlight_text pypalettes plt.subplots() xlabel ylabel title legend colorbar savefig tight_layout grid set_xlim set_ylim plot scatter hist boxplot imshow cmap alpha bins tick_params annotate quiver contour barh stackplot subplots_adjust axhline axvline semilogx semilogy loglog polar streamplot hexbin pcolor tricontour errorbar clabel set_aspect violinplot set_axis_off spines text hatch plt axis plt.bar() plt.axis import figure pyplot highlight_text pypalettes plt.subplots() xlabel ylabel title legend colorbar savefig tight_layout grid set_xlim set_ylim plot scatter hist boxplot imshow cmap alpha bins tick_params annotate quiver contour barh stackplot subplots_adjust axhline axvline semilogx semilogy loglog polar streamplot hexbin pcolor tricontour errorbar clabel set_aspect violinplot set_axis_off spines text hatch plt axis plt.bar() plt.axis import figure pyplot highlight_text pypalettes plt.subplots() xlabel ylabel title legend colorbar savefig tight_layout grid set_xlim set_ylim plot scatter hist boxplot imshow cmap alpha bins tick_params annotate quiver contour barh stackplot subplots_adjust axhline axvline semilogx semilogy loglog polar streamplot hexbin pcolor tricontour errorbar clabel set_aspect violinplot set_axis_off spines text hatch plt axis plt.bar() plt.axis import figure pyplot highlight_text pypalettes plt.subplots() xlabel ylabel title legend colorbar savefig tight_layout grid set_xlim set_ylim plot scatter hist boxplot imshow cmap alpha bins tick_params annotate quiver contour barh stackplot subplots_adjust axhline axvline semilogx semilogy loglog polar streamplot hexbin pcolor tricontour errorbar clabel set_aspect violinplot set_axis_off spines text hatch plt axis plt.bar() plt.axis import figure pyplot highlight_text pypalettes plt.subplots() xlabel ylabel title legend colorbar savefig tight_layout grid set_xlim set_ylim plot scatter hist boxplot imshow cmap alpha bins tick_params annotate quiver contour barh stackplot subplots_adjust axhline axvline semilogx semilogy loglog polar streamplot hexbin pcolor tricontour errorbar clabel set_aspect violinplot set_axis_off spines text hatch plt axis plt.bar() plt.axis import figure pyplot highlight_text pypalettes plt.subplots() xlabel ylabel title legend colorbar savefig tight_layout grid set_xlim set_ylim plot scatter hist boxplot imshow cmap alpha bins tick_params annotate quiver contour barh stackplot subplots_adjust axhline axvline semilogx semilogy loglog polar streamplot hexbin pcolor tricontour errorbar clabel set_aspect violinplot set_axis_off spines text hatch plt axis plt.bar() plt.axis import figure pyplot highlight_text pypalettes plt.subplots() xlabel ylabel title legend colorbar savefig tight_layout grid set_xlim set_ylim plot scatter hist boxplot imshow cmap alpha bins tick_params annotate quiver contour barh stackplot subplots_adjust axhline axvline semilogx semilogy loglog polar streamplot hexbin pcolor tricontour errorbar clabel set_aspect violinplot set_axis_off spines text hatch plt axis plt.bar() plt.axis import figure pyplot highlight_text pypalettes plt.subplots() xlabel ylabel title legend colorbar savefig tight_layout grid set_xlim set_ylim plot scatter hist boxplot imshow cmap alpha bins tick_params annotate quiver contour barh stackplot subplots_adjust axhline axvline semilogx semilogy loglog polar streamplot hexbin pcolor tricontour errorbar clabel set_aspect violinplot set_axis_off spines text hatch plt axis plt.bar() plt.axis import figure pyplot highlight_text pypalettes plt.subplots() xlabel ylabel title legend colorbar savefig tight_layout grid set_xlim set_ylim plot scatter hist boxplot imshow cmap alpha bins tick_params annotate quiver contour barh stackplot subplots_adjust axhline axvline semilogx semilogy loglog polar streamplot hexbin pcolor tricontour errorbar clabel set_aspect violinplot set_axis_off spines text hatch plt axis plt.bar() plt.axis import figure pyplot highlight_text pypalettes plt.subplots() xlabel ylabel title legend colorbar savefig tight_layout grid set_xlim set_ylim plot scatter hist boxplot imshow cmap alpha bins tick_params annotate quiver contour barh stackplot subplots_adjust axhline axvline semilogx semilogy loglog polar streamplot hexbin pcolor tricontour errorbar clabel set_aspect violinplot set_axis_off spines text hatch plt axis plt.bar() plt.axis import figure pyplot highlight_text pypalettes plt.subplots() xlabel ylabel title legend colorbar savefig tight_layout grid set_xlim set_ylim plot scatter hist boxplot imshow cmap alpha bins tick_params annotate quiver contour barh stackplot subplots_adjust axhline axvline semilogx semilogy loglog polar streamplot hexbin pcolor tricontour errorbar clabel set_aspect violinplot set_axis_off spines text hatch plt axis plt.bar() plt.axis import figure pyplot highlight_text pypalettes plt.subplots() xlabel ylabel title legend colorbar savefig tight_layout grid set_xlim set_ylim plot scatter hist boxplot imshow cmap alpha bins tick_params annotate quiver contour barh stackplot subplots_adjust axhline axvline semilogx semilogy loglog polar streamplot hexbin pcolor tricontour errorbar clabel set_aspect violinplot set_axis_off spines text hatch plt axis plt.bar() plt.axis import figure pyplot highlight_text pypalettes plt.subplots() xlabel ylabel title legend colorbar savefig tight_layout grid set_xlim set_ylim plot scatter hist boxplot imshow cmap alpha bins tick_params annotate quiver contour barh stackplot subplots_adjust axhline axvline semilogx semilogy loglog polar streamplot hexbin pcolor tricontour errorbar clabel set_aspect violinplot set_axis_off spines text hatch plt axis plt.bar() plt.axis import figure pyplot highlight_text pypalettes plt.subplots() xlabel ylabel title legend colorbar savefig tight_layout grid set_xlim set_ylim plot scatter hist boxplot imshow cmap alpha bins tick_params annotate quiver contour barh stackplot subplots_adjust axhline axvline semilogx semilogy loglog polar streamplot hexbin pcolor tricontour errorbar clabel set_aspect violinplot set_axis_off spines text hatch plt axis plt.bar() plt.axis import figure pyplot highlight_text pypalettes plt.subplots() xlabel ylabel title legend colorbar savefig tight_layout grid set_xlim set_ylim plot scatter hist boxplot imshow cmap alpha bins tick_params annotate quiver contour barh stackplot subplots_adjust axhline axvline semilogx semilogy loglog polar streamplot hexbin pcolor tricontour errorbar clabel set_aspect violinplot set_axis_off spines text hatch plt axis plt.bar() plt.axis import figure pyplot highlight_text pypalettes plt.subplots() xlabel ylabel title legend colorbar savefig tight_layout grid set_xlim set_ylim plot scatter hist boxplot imshow cmap alpha bins tick_params annotate quiver contour barh stackplot subplots_adjust axhline axvline semilogx semilogy loglog polar streamplot hexbin pcolor tricontour errorbar clabel set_aspect violinplot set_axis_off spines text hatch plt axis plt.bar() plt.axis import figure pyplot highlight_text pypalettes plt.subplots() xlabel ylabel title legend colorbar savefig tight_layout grid set_xlim set_ylim plot scatter hist boxplot imshow cmap alpha bins tick_params annotate quiver contour barh stackplot subplots_adjust axhline axvline semilogx semilogy loglog polar streamplot hexbin pcolor tricontour errorbar clabel set_aspect violinplot set_axis_off spines text hatch plt axis plt.bar() plt.axis import figure pyplot highlight_text pypalettes plt.subplots() xlabel ylabel title legend colorbar savefig tight_layout grid set_xlim set_ylim plot scatter hist boxplot imshow cmap alpha bins tick_params annotate quiver contour barh stackplot subplots_adjust axhline axvline semilogx semilogy loglog polar streamplot hexbin pcolor tricontour errorbar clabel set_aspect violinplot set_axis_off spines text hatch plt axis plt.bar() plt.axis import figure pyplot highlight_text pypalettes plt.subplots() xlabel ylabel title legend colorbar savefig tight_layout grid set_xlim set_ylim plot scatter hist boxplot imshow cmap alpha bins tick_params annotate quiver contour barh stackplot subplots_adjust axhline axvline semilogx semilogy loglog polar streamplot hexbin pcolor tricontour errorbar clabel set_aspect violinplot set_axis_off spines text hatch plt axis plt.bar() plt.axis import figure pyplot highlight_text pypalettes plt.subplots() xlabel ylabel title legend colorbar savefig tight_layout grid set_xlim set_ylim plot scatter hist boxplot imshow cmap alpha bins tick_params annotate quiver contour barh stackplot subplots_adjust axhline axvline semilogx semilogy loglog polar streamplot hexbin pcolor tricontour errorbar clabel set_aspect violinplot set_axis_off spines text hatch plt axis plt.bar() plt.axis import figure pyplot highlight_text pypalettes plt.subplots() xlabel ylabel title legend colorbar savefig tight_layout grid set_xlim set_ylim plot scatter hist boxplot imshow cmap alpha bins tick_params annotate quiver contour barh stackplot subplots_adjust axhline axvline semilogx semilogy loglog polar streamplot hexbin pcolor tricontour errorbar clabel set_aspect violinplot set_axis_off spines text hatch plt axis plt.bar() plt.axis import figure pyplot highlight_text pypalettes plt.subplots() xlabel ylabel title legend colorbar savefig tight_layout grid set_xlim set_ylim plot scatter hist boxplot imshow cmap alpha bins tick_params annotate quiver contour barh stackplot subplots_adjust axhline axvline semilogx semilogy loglog polar streamplot hexbin pcolor tricontour errorbar clabel set_aspect violinplot set_axis_off spines text hatch plt axis plt.bar() plt.axis import figure pyplot highlight_text pypalettes plt.subplots() xlabel ylabel title legend colorbar savefig tight_layout grid set_xlim set_ylim plot scatter hist boxplot imshow cmap alpha bins tick_params annotate quiver contour barh stackplot subplots_adjust axhline axvline semilogx semilogy loglog polar streamplot hexbin pcolor tricontour errorbar clabel set_aspect violinplot set_axis_off spines text hatch plt axis plt.bar() plt.axis import figure pyplot highlight_text pypalettes plt.subplots() xlabel ylabel title legend colorbar savefig tight_layout grid set_xlim set_ylim plot scatter hist boxplot imshow cmap alpha bins tick_params annotate quiver contour barh stackplot subplots_adjust axhline axvline semilogx semilogy loglog polar streamplot hexbin pcolor tricontour errorbar clabel set_aspect violinplot set_axis_off spines text hatch plt axis plt.bar() plt.axis import figure pyplot highlight_text pypalettes plt.subplots() xlabel ylabel title legend colorbar savefig tight_layout grid set_xlim set_ylim plot scatter hist boxplot imshow cmap alpha bins tick_params annotate quiver contour barh stackplot subplots_adjust axhline axvline semilogx semilogy loglog polar streamplot hexbin pcolor tricontour errorbar clabel set_aspect violinplot set_axis_off spines text hatch plt axis plt.bar() plt.axis import figure pyplot highlight_text pypalettes plt.subplots() xlabel ylabel title legend colorbar savefig tight_layout grid set_xlim set_ylim plot scatter hist boxplot imshow cmap alpha bins tick_params annotate quiver contour barh stackplot subplots_adjust axhline axvline semilogx semilogy loglog polar streamplot hexbin pcolor tricontour errorbar clabel set_aspect violinplot set_axis_off spines text hatch plt axis plt.bar() plt.axis import figure pyplot highlight_text pypalettes plt.subplots() xlabel ylabel title legend colorbar savefig tight_layout grid set_xlim set_ylim plot scatter hist boxplot imshow cmap alpha bins tick_params annotate quiver contour barh stackplot subplots_adjust axhline axvline semilogx semilogy loglog polar streamplot hexbin pcolor tricontour errorbar clabel set_aspect violinplot set_axis_off spines text hatch plt axis plt.bar() plt.axis import figure pyplot highlight_text pypalettes plt.subplots() xlabel ylabel title legend colorbar savefig tight_layout grid set_xlim set_ylim plot scatter hist boxplot imshow cmap alpha bins tick_params annotate quiver contour barh stackplot subplots_adjust axhline axvline semilogx semilogy loglog polar streamplot hexbin pcolor tricontour errorbar clabel set_aspect violinplot set_axis_off spines text hatch plt axis plt.bar() plt.axis import figure pyplot highlight_text pypalettes plt.subplots() xlabel ylabel title legend colorbar savefig tight_layout grid set_xlim set_ylim plot scatter hist boxplot imshow cmap alpha bins tick_params annotate quiver contour barh stackplot subplots_adjust axhline axvline semilogx semilogy loglog polar streamplot hexbin pcolor tricontour errorbar clabel set_aspect violinplot set_axis_off spines text hatch plt axis plt.bar() plt.axis import figure pyplot highlight_text pypalettes plt.subplots() xlabel ylabel title legend colorbar savefig tight_layout grid set_xlim set_ylim plot scatter hist boxplot imshow cmap alpha bins tick_params annotate quiver contour barh stackplot subplots_adjust axhline axvline semilogx semilogy loglog polar streamplot hexbin pcolor tricontour errorbar clabel set_aspect violinplot set_axis_off spines text hatch plt axis plt.bar() plt.axis import figure pyplot highlight_text pypalettes plt.subplots() xlabel ylabel title legend colorbar savefig tight_layout grid set_xlim set_ylim plot scatter hist boxplot imshow cmap alpha bins tick_params annotate quiver contour barh stackplot subplots_adjust axhline axvline semilogx semilogy loglog polar streamplot hexbin pcolor tricontour errorbar clabel set_aspect violinplot set_axis_off spines text hatch plt axis plt.bar() plt.axis import figure pyplot highlight_text pypalettes plt.subplots() xlabel ylabel title legend colorbar savefig tight_layout grid set_xlim set_ylim plot scatter hist boxplot imshow cmap alpha bins tick_params annotate quiver contour barh stackplot subplots_adjust axhline axvline semilogx semilogy loglog polar streamplot hexbin pcolor tricontour errorbar clabel set_aspect violinplot set_axis_off spines text hatch plt axis plt.bar() plt.axis import figure pyplot highlight_text pypalettes plt.subplots() xlabel ylabel title legend colorbar savefig tight_layout grid set_xlim set_ylim plot scatter hist boxplot imshow cmap alpha bins tick_params annotate quiver contour barh stackplot subplots_adjust axhline axvline semilogx semilogy loglog polar streamplot hexbin pcolor tricontour errorbar clabel set_aspect violinplot set_axis_off spines text hatch plt axis plt.bar() plt.axis import figure pyplot highlight_text pypalettes plt.subplots() xlabel ylabel title legend colorbar savefig tight_layout grid set_xlim set_ylim plot scatter hist boxplot imshow cmap alpha bins tick_params annotate quiver contour barh stackplot subplots_adjust axhline axvline semilogx semilogy loglog polar streamplot hexbin pcolor tricontour errorbar clabel set_aspect violinplot set_axis_off spines text hatch plt axis plt.bar() plt.axis import figure pyplot highlight_text pypalettes plt.subplots() xlabel ylabel title legend colorbar savefig tight_layout grid set_xlim set_ylim plot scatter hist boxplot imshow cmap alpha bins tick_params annotate quiver contour barh stackplot subplots_adjust axhline axvline semilogx semilogy loglog polar streamplot hexbin pcolor tricontour errorbar clabel set_aspect violinplot set_axis_off spines text hatch plt axis plt.bar() plt.axis import figure pyplot highlight_text pypalettes plt.subplots() xlabel ylabel title legend colorbar savefig tight_layout grid set_xlim set_ylim plot scatter hist boxplot imshow cmap alpha bins tick_params annotate quiver contour barh stackplot subplots_adjust axhline axvline semilogx semilogy loglog polar streamplot hexbin pcolor tricontour errorbar clabel set_aspect violinplot set_axis_off spines text hatch plt axis plt.bar() plt.axis import figure pyplot highlight_text pypalettes plt.subplots() xlabel ylabel title legend colorbar savefig tight_layout grid set_xlim set_ylim plot scatter hist boxplot imshow cmap alpha bins tick_params annotate quiver contour barh stackplot subplots_adjust axhline axvline semilogx semilogy loglog polar streamplot hexbin pcolor tricontour errorbar clabel set_aspect violinplot set_axis_off spines text hatch plt axis plt.bar() plt.axis import figure pyplot highlight_text pypalettes plt.subplots() xlabel ylabel title legend colorbar savefig tight_layout grid set_xlim set_ylim plot scatter hist boxplot imshow cmap alpha bins tick_params annotate quiver contour barh stackplot subplots_adjust axhline axvline semilogx semilogy loglog polar streamplot hexbin pcolor tricontour errorbar clabel set_aspect violinplot set_axis_off spines text hatch plt axis plt.bar() plt.axis import figure pyplot highlight_text pypalettes plt.subplots() xlabel ylabel title legend colorbar savefig tight_layout grid set_xlim set_ylim plot scatter hist boxplot imshow cmap alpha bins tick_params annotate quiver contour barh stackplot subplots_adjust axhline axvline semilogx semilogy loglog polar streamplot hexbin pcolor tricontour errorbar clabel set_aspect violinplot set_axis_off spines text hatch plt axis plt.bar() plt.axis import figure pyplot highlight_text pypalettes plt.subplots() xlabel ylabel title legend colorbar savefig tight_layout grid set_xlim set_ylim plot scatter hist boxplot imshow cmap alpha bins tick_params annotate quiver contour barh stackplot subplots_adjust axhline axvline semilogx semilogy loglog polar streamplot hexbin pcolor tricontour errorbar clabel set_aspect violinplot set_axis_off spines text hatch plt axis plt.bar() plt.axis import figure pyplot highlight_text pypalettes plt.subplots() xlabel ylabel title legend colorbar savefig tight_layout grid set_xlim set_ylim plot scatter hist boxplot imshow cmap alpha bins tick_params annotate quiver contour barh stackplot subplots_adjust axhline axvline semilogx semilogy loglog polar streamplot hexbin pcolor tricontour errorbar clabel set_aspect violinplot set_axis_off spines text hatch plt axis plt.bar() plt.axis import figure pyplot highlight_text pypalettes plt.subplots() xlabel ylabel title legend colorbar savefig tight_layout grid set_xlim set_ylim plot scatter hist boxplot imshow cmap alpha bins tick_params annotate quiver contour barh stackplot subplots_adjust axhline axvline semilogx semilogy loglog polar streamplot hexbin pcolor tricontour errorbar clabel set_aspect violinplot set_axis_off spines text hatch plt axis plt.bar() plt.axis import figure pyplot highlight_text pypalettes plt.subplots() xlabel ylabel title legend colorbar savefig tight_layout grid set_xlim set_ylim plot scatter hist boxplot imshow cmap alpha bins tick_params annotate quiver contour barh stackplot subplots_adjust axhline axvline semilogx semilogy loglog polar streamplot hexbin pcolor tricontour errorbar clabel set_aspect violinplot set_axis_off spines text hatch plt axis plt.bar() plt.axis import figure pyplot highlight_text pypalettes plt.subplots() xlabel ylabel title legend colorbar savefig tight_layout grid set_xlim set_ylim plot scatter hist boxplot imshow cmap alpha bins tick_params annotate quiver contour barh stackplot subplots_adjust axhline axvline semilogx semilogy loglog polar streamplot hexbin pcolor tricontour errorbar clabel set_aspect violinplot set_axis_off spines text hatch plt axis plt.bar() plt.axis import figure pyplot highlight_text pypalettes plt.subplots() xlabel ylabel title legend colorbar savefig tight_layout grid set_xlim set_ylim plot scatter hist boxplot imshow cmap alpha bins tick_params annotate quiver contour barh stackplot subplots_adjust axhline axvline semilogx semilogy loglog polar streamplot hexbin pcolor tricontour errorbar clabel set_aspect violinplot set_axis_off spines text hatch plt axis plt.bar() plt.axis import figure pyplot highlight_text pypalettes plt.subplots() xlabel ylabel title legend colorbar savefig tight_layout grid set_xlim set_ylim plot scatter hist boxplot imshow cmap alpha bins tick_params annotate quiver contour barh stackplot subplots_adjust axhline axvline semilogx semilogy loglog polar streamplot hexbin pcolor tricontour errorbar clabel set_aspect violinplot set_axis_off spines text hatch plt axis plt.bar() plt.axis import figure pyplot highlight_text pypalettes plt.subplots() xlabel ylabel title legend colorbar savefig tight_layout grid set_xlim set_ylim plot scatter hist boxplot imshow cmap alpha bins tick_params annotate quiver contour barh stackplot subplots_adjust axhline axvline semilogx semilogy loglog polar streamplot hexbin pcolor tricontour errorbar clabel set_aspect violinplot set_axis_off spines text hatch plt axis plt.bar() plt.axis import figure pyplot highlight_text pypalettes plt.subplots() xlabel ylabel title legend colorbar savefig tight_layout grid set_xlim set_ylim plot scatter hist boxplot imshow cmap alpha bins tick_params annotate quiver contour barh stackplot subplots_adjust axhline axvline semilogx semilogy loglog polar streamplot hexbin pcolor tricontour errorbar clabel set_aspect violinplot set_axis_off spines text hatch plt axis plt.bar() plt.axis import figure pyplot highlight_text pypalettes plt.subplots() xlabel ylabel title legend colorbar savefig tight_layout grid set_xlim set_ylim plot scatter hist boxplot imshow cmap alpha bins tick_params annotate quiver contour barh stackplot subplots_adjust axhline axvline semilogx semilogy loglog polar streamplot hexbin pcolor tricontour errorbar clabel set_aspect violinplot set_axis_off spines text hatch plt axis plt.bar() plt.axis import figure pyplot highlight_text pypalettes plt.subplots() xlabel ylabel title legend colorbar savefig tight_layout grid set_xlim set_ylim plot scatter hist boxplot imshow cmap alpha bins tick_params annotate quiver contour barh stackplot subplots_adjust axhline axvline semilogx semilogy loglog polar streamplot hexbin pcolor tricontour errorbar clabel set_aspect violinplot set_axis_off spines text hatch plt axis plt.bar() plt.axis import figure pyplot highlight_text pypalettes plt.subplots() xlabel ylabel title legend colorbar savefig tight_layout grid set_xlim set_ylim plot scatter hist boxplot imshow cmap alpha bins tick_params annotate quiver contour barh stackplot subplots_adjust axhline axvline semilogx semilogy loglog polar streamplot hexbin pcolor tricontour errorbar clabel set_aspect violinplot set_axis_off spines text hatch plt axis plt.bar() plt.axis import figure pyplot highlight_text pypalettes plt.subplots() xlabel ylabel title legend colorbar savefig tight_layout grid set_xlim set_ylim plot scatter hist boxplot imshow cmap alpha bins tick_params annotate quiver contour barh stackplot subplots_adjust axhline axvline semilogx semilogy loglog polar streamplot hexbin pcolor tricontour errorbar clabel set_aspect violinplot set_axis_off spines text hatch plt axis plt.bar() plt.axis import figure pyplot highlight_text pypalettes plt.subplots() xlabel ylabel title legend colorbar savefig tight_layout grid set_xlim set_ylim plot scatter hist boxplot imshow cmap alpha bins tick_params annotate quiver contour barh stackplot subplots_adjust axhline axvline semilogx semilogy loglog polar streamplot hexbin pcolor tricontour errorbar clabel set_aspect violinplot set_axis_off spines text hatch plt axis plt.bar() plt.axis import figure pyplot highlight_text pypalettes plt.subplots() xlabel ylabel title legend colorbar savefig tight_layout grid set_xlim set_ylim plot scatter hist boxplot imshow cmap alpha bins tick_params annotate quiver contour barh stackplot subplots_adjust axhline axvline semilogx semilogy loglog polar streamplot hexbin pcolor tricontour errorbar clabel set_aspect violinplot set_axis_off spines text hatch plt axis plt.bar() plt.axis import figure pyplot highlight_text pypalettes plt.subplots() xlabel ylabel title legend colorbar savefig tight_layout grid set_xlim set_ylim plot scatter hist boxplot imshow cmap alpha bins tick_params annotate quiver contour barh stackplot subplots_adjust axhline axvline semilogx semilogy loglog polar streamplot hexbin pcolor tricontour errorbar clabel set_aspect violinplot set_axis_off spines text hatch plt axis plt.bar() plt.axis import figure pyplot highlight_text pypalettes plt.subplots() xlabel ylabel title legend colorbar savefig tight_layout grid set_xlim set_ylim plot scatter hist boxplot imshow cmap alpha bins tick_params annotate quiver contour barh stackplot subplots_adjust axhline axvline semilogx semilogy loglog polar streamplot hexbin pcolor tricontour errorbar clabel set_aspect violinplot set_axis_off spines text hatch plt axis plt.bar() plt.axis import figure pyplot highlight_text pypalettes plt.subplots() xlabel ylabel title legend colorbar savefig tight_layout grid set_xlim set_ylim plot scatter hist boxplot imshow cmap alpha bins tick_params annotate quiver contour barh stackplot subplots_adjust axhline axvline semilogx semilogy loglog polar streamplot hexbin pcolor tricontour errorbar clabel set_aspect violinplot set_axis_off spines text hatch plt axis plt.bar() plt.axis import figure pyplot highlight_text pypalettes plt.subplots() xlabel ylabel title legend colorbar savefig tight_layout grid set_xlim set_ylim plot scatter hist boxplot imshow cmap alpha bins tick_params annotate quiver contour barh stackplot subplots_adjust axhline axvline semilogx semilogy loglog polar streamplot hexbin pcolor tricontour errorbar clabel set_aspect violinplot set_axis_off spines text hatch plt axis plt.bar() plt.axis import figure pyplot highlight_text pypalettes plt.subplots() xlabel ylabel title legend colorbar savefig tight_layout grid set_xlim set_ylim plot scatter hist boxplot imshow cmap alpha bins tick_params annotate quiver contour barh stackplot subplots_adjust axhline axvline semilogx semilogy loglog polar streamplot hexbin pcolor tricontour errorbar clabel set_aspect violinplot set_axis_off spines text hatch plt axis plt.bar() plt.axis import figure pyplot highlight_text pypalettes plt.subplots() xlabel ylabel title legend colorbar savefig tight_layout grid set_xlim set_ylim plot scatter hist boxplot imshow cmap alpha bins tick_params annotate quiver contour barh stackplot subplots_adjust axhline axvline semilogx semilogy loglog polar streamplot hexbin pcolor tricontour errorbar clabel set_aspect violinplot set_axis_off spines text hatch plt axis plt.bar() plt.axis import figure pyplot highlight_text pypalettes plt.subplots() xlabel ylabel title legend colorbar savefig tight_layout grid set_xlim set_ylim plot scatter hist boxplot imshow cmap alpha bins tick_params annotate quiver contour barh stackplot subplots_adjust axhline axvline semilogx semilogy loglog polar streamplot hexbin pcolor tricontour errorbar clabel set_aspect violinplot set_axis_off spines text hatch plt axis plt.bar() plt.axis import figure pyplot highlight_text pypalettes plt.subplots() xlabel ylabel title legend colorbar savefig tight_layout grid set_xlim set_ylim plot scatter hist boxplot imshow cmap alpha bins tick_params annotate quiver contour barh stackplot subplots_adjust axhline axvline semilogx semilogy loglog polar streamplot hexbin pcolor tricontour errorbar clabel set_aspect violinplot set_axis_off spines text hatch plt axis plt.bar() plt.axis import figure pyplot highlight_text pypalettes plt.subplots() xlabel ylabel title legend colorbar savefig tight_layout grid set_xlim set_ylim plot scatter hist boxplot imshow cmap alpha bins tick_params annotate quiver contour barh stackplot subplots_adjust axhline axvline semilogx semilogy loglog polar streamplot hexbin pcolor tricontour errorbar clabel set_aspect violinplot set_axis_off spines text hatch plt axis plt.bar() plt.axis import figure pyplot highlight_text pypalettes plt.subplots() xlabel ylabel title legend colorbar savefig tight_layout grid set_xlim set_ylim plot scatter hist boxplot imshow cmap alpha bins tick_params annotate quiver contour barh stackplot subplots_adjust axhline axvline semilogx semilogy loglog polar streamplot hexbin pcolor tricontour errorbar clabel set_aspect violinplot set_axis_off spines text hatch plt axis plt.bar() plt.axis import figure pyplot highlight_text pypalettes plt.subplots() xlabel ylabel title legend colorbar savefig tight_layout grid set_xlim set_ylim plot scatter hist boxplot imshow cmap alpha bins tick_params annotate quiver contour barh stackplot subplots_adjust axhline axvline semilogx semilogy loglog polar streamplot hexbin pcolor tricontour errorbar clabel set_aspect violinplot set_axis_off spines text hatch plt axis plt.bar() plt.axis import figure pyplot highlight_text pypalettes plt.subplots() xlabel ylabel title legend colorbar savefig tight_layout grid set_xlim set_ylim plot scatter hist boxplot imshow cmap alpha bins tick_params annotate quiver contour barh stackplot subplots_adjust axhline axvline semilogx semilogy loglog polar streamplot hexbin pcolor tricontour errorbar clabel set_aspect violinplot set_axis_off spines text hatch plt axis plt.bar() plt.axis import figure pyplot highlight_text pypalettes plt.subplots() xlabel ylabel title legend colorbar savefig tight_layout grid set_xlim set_ylim plot scatter hist boxplot imshow cmap alpha bins tick_params annotate quiver contour barh stackplot subplots_adjust axhline axvline semilogx semilogy loglog polar streamplot hexbin pcolor tricontour errorbar clabel set_aspect violinplot set_axis_off spines text hatch plt axis plt.bar() plt.axis import figure pyplot highlight_text pypalettes plt.subplots() xlabel ylabel title legend colorbar savefig tight_layout grid set_xlim set_ylim plot scatter hist boxplot imshow cmap alpha bins tick_params annotate quiver contour barh stackplot subplots_adjust axhline axvline semilogx semilogy loglog polar streamplot hexbin pcolor tricontour errorbar clabel set_aspect violinplot set_axis_off spines text hatch plt axis plt.bar() plt.axis import figure pyplot highlight_text pypalettes plt.subplots() xlabel ylabel title legend colorbar savefig tight_layout grid set_xlim set_ylim plot scatter hist boxplot imshow cmap alpha bins tick_params annotate quiver contour barh stackplot subplots_adjust axhline axvline semilogx semilogy loglog polar streamplot hexbin pcolor tricontour errorbar clabel set_aspect violinplot set_axis_off spines text hatch plt axis plt.bar() plt.axis import figure pyplot highlight_text pypalettes plt.subplots() xlabel ylabel title legend colorbar savefig tight_layout grid set_xlim set_ylim plot scatter hist boxplot imshow cmap alpha bins tick_params annotate quiver contour barh stackplot subplots_adjust axhline axvline semilogx semilogy loglog polar streamplot hexbin pcolor tricontour errorbar clabel set_aspect violinplot set_axis_off spines text hatch plt axis plt.bar() plt.axis import figure pyplot highlight_text pypalettes plt.subplots() xlabel ylabel title legend colorbar savefig tight_layout grid set_xlim set_ylim plot scatter hist boxplot imshow cmap alpha bins tick_params annotate quiver contour barh stackplot subplots_adjust axhline axvline semilogx semilogy loglog polar streamplot hexbin pcolor tricontour errorbar clabel set_aspect violinplot set_axis_off spines text hatch plt axis plt.bar() plt.axis import figure pyplot highlight_text pypalettes plt.subplots() xlabel ylabel title legend colorbar savefig tight_layout grid set_xlim set_ylim plot scatter hist boxplot imshow cmap alpha bins tick_params annotate quiver contour barh stackplot subplots_adjust axhline axvline semilogx semilogy loglog polar streamplot hexbin pcolor tricontour errorbar clabel set_aspect violinplot set_axis_off spines text hatch plt axis plt.bar() plt.axis import figure pyplot highlight_text pypalettes plt.subplots() xlabel ylabel title legend colorbar savefig tight_layout grid set_xlim set_ylim plot scatter hist boxplot imshow cmap alpha bins tick_params annotate quiver contour barh stackplot subplots_adjust axhline axvline semilogx semilogy loglog polar streamplot hexbin pcolor tricontour errorbar clabel set_aspect violinplot set_axis_off spines text hatch plt axis plt.bar() plt.axis import figure pyplot highlight_text pypalettes plt.subplots() xlabel ylabel title legend colorbar savefig tight_layout grid set_xlim set_ylim plot scatter hist boxplot imshow cmap alpha bins tick_params annotate quiver contour barh stackplot subplots_adjust axhline axvline semilogx semilogy loglog polar streamplot hexbin pcolor tricontour errorbar clabel set_aspect violinplot set_axis_off spines text hatch plt axis plt.bar() plt.axis import figure pyplot highlight_text pypalettes plt.subplots() xlabel ylabel title legend colorbar savefig tight_layout grid set_xlim set_ylim plot scatter hist boxplot imshow cmap alpha bins tick_params annotate quiver contour barh stackplot subplots_adjust axhline axvline semilogx semilogy loglog polar streamplot hexbin pcolor tricontour errorbar clabel set_aspect violinplot set_axis_off spines text hatch plt axis plt.bar() plt.axis import figure pyplot highlight_text pypalettes plt.subplots() xlabel ylabel title legend colorbar savefig tight_layout grid set_xlim set_ylim plot scatter hist boxplot imshow cmap alpha bins tick_params annotate quiver contour barh stackplot subplots_adjust axhline axvline semilogx semilogy loglog polar streamplot hexbin pcolor tricontour errorbar clabel set_aspect violinplot set_axis_off spines text hatch plt axis plt.bar() plt.axis import figure pyplot highlight_text pypalettes plt.subplots() xlabel ylabel title legend colorbar savefig tight_layout grid set_xlim set_ylim plot scatter hist boxplot imshow cmap alpha bins tick_params annotate quiver contour barh stackplot subplots_adjust axhline axvline semilogx semilogy loglog polar streamplot hexbin pcolor tricontour errorbar clabel set_aspect violinplot set_axis_off spines text hatch plt axis plt.bar() plt.axis import figure pyplot highlight_text pypalettes plt.subplots() xlabel ylabel title legend colorbar savefig tight_layout grid set_xlim set_ylim plot scatter hist boxplot imshow cmap alpha bins tick_params annotate quiver contour barh stackplot subplots_adjust axhline axvline semilogx semilogy loglog polar streamplot hexbin pcolor tricontour errorbar clabel set_aspect violinplot set_axis_off spines text hatch plt axis plt.bar() plt.axis import figure pyplot highlight_text pypalettes plt.subplots() xlabel ylabel title legend colorbar savefig tight_layout grid set_xlim set_ylim plot scatter hist boxplot imshow cmap alpha bins tick_params annotate quiver contour barh stackplot subplots_adjust axhline axvline semilogx semilogy loglog polar streamplot hexbin pcolor tricontour errorbar clabel set_aspect violinplot set_axis_off spines text hatch plt axis plt.bar() plt.axis import figure pyplot highlight_text pypalettes plt.subplots() xlabel ylabel title legend colorbar savefig tight_layout grid set_xlim set_ylim plot scatter hist boxplot imshow cmap alpha bins tick_params annotate quiver contour barh stackplot subplots_adjust axhline axvline semilogx semilogy loglog polar streamplot hexbin pcolor tricontour errorbar clabel set_aspect violinplot set_axis_off spines text hatch plt axis plt.bar() plt.axis import figure pyplot highlight_text pypalettes plt.subplots() xlabel ylabel title legend colorbar savefig tight_layout grid set_xlim set_ylim plot scatter hist boxplot imshow cmap alpha bins tick_params annotate quiver contour barh stackplot subplots_adjust axhline axvline semilogx semilogy loglog polar streamplot hexbin pcolor tricontour errorbar clabel set_aspect violinplot set_axis_off spines text hatch plt axis plt.bar() plt.axis import figure pyplot highlight_text pypalettes plt.subplots() xlabel ylabel title legend colorbar savefig tight_layout grid set_xlim set_ylim plot scatter hist boxplot imshow cmap alpha bins tick_params annotate quiver contour barh stackplot subplots_adjust axhline axvline semilogx semilogy loglog polar streamplot hexbin pcolor tricontour errorbar clabel set_aspect violinplot set_axis_off spines text hatch plt axis plt.bar() plt.axis import figure pyplot highlight_text pypalettes plt.subplots() xlabel ylabel title legend colorbar savefig tight_layout grid set_xlim set_ylim plot scatter hist boxplot imshow cmap alpha bins tick_params annotate quiver contour barh stackplot subplots_adjust axhline axvline semilogx semilogy loglog polar streamplot hexbin pcolor tricontour errorbar clabel set_aspect violinplot set_axis_off spines text hatch plt axis plt.bar() plt.axis import figure pyplot highlight_text pypalettes plt.subplots() xlabel ylabel title legend colorbar savefig tight_layout grid set_xlim set_ylim plot scatter hist boxplot imshow cmap alpha bins tick_params annotate quiver contour barh stackplot subplots_adjust axhline axvline semilogx semilogy loglog polar streamplot hexbin pcolor tricontour errorbar clabel set_aspect violinplot set_axis_off spines text hatch plt axis plt.bar() plt.axis import figure pyplot highlight_text pypalettes plt.subplots() xlabel ylabel title legend colorbar savefig tight_layout grid set_xlim set_ylim plot scatter hist boxplot imshow cmap alpha bins tick_params annotate quiver contour barh stackplot subplots_adjust axhline axvline semilogx semilogy loglog polar streamplot hexbin pcolor tricontour errorbar clabel set_aspect violinplot set_axis_off spines text hatch plt axis plt.bar() plt.axis import figure pyplot highlight_text pypalettes plt.subplots() xlabel ylabel title legend colorbar savefig tight_layout grid set_xlim set_ylim plot scatter hist boxplot imshow cmap alpha bins tick_params annotate quiver contour barh stackplot subplots_adjust axhline axvline semilogx semilogy loglog polar streamplot hexbin pcolor tricontour errorbar clabel set_aspect violinplot set_axis_off spines text hatch plt axis plt.bar() plt.axis import figure pyplot highlight_text pypalettes plt.subplots() xlabel ylabel title legend colorbar savefig tight_layout grid set_xlim set_ylim plot scatter hist boxplot imshow cmap alpha bins tick_params annotate quiver contour barh stackplot subplots_adjust axhline axvline semilogx semilogy loglog polar streamplot hexbin pcolor tricontour errorbar clabel set_aspect violinplot set_axis_off spines text hatch plt axis plt.bar() plt.axis import figure pyplot highlight_text pypalettes plt.subplots() xlabel ylabel title legend colorbar savefig tight_layout grid set_xlim set_ylim plot scatter hist boxplot imshow cmap alpha bins tick_params annotate quiver contour barh stackplot subplots_adjust axhline axvline semilogx semilogy loglog polar streamplot hexbin pcolor tricontour errorbar clabel set_aspect violinplot set_axis_off spines text hatch plt axis plt.bar() plt.axis import figure pyplot highlight_text pypalettes plt.subplots() xlabel ylabel title legend colorbar savefig tight_layout grid set_xlim set_ylim plot scatter hist boxplot imshow cmap alpha bins tick_params annotate quiver contour barh stackplot subplots_adjust axhline axvline semilogx semilogy loglog polar streamplot hexbin pcolor tricontour errorbar clabel set_aspect violinplot set_axis_off spines text hatch plt axis plt.bar() plt.axis import figure pyplot highlight_text pypalettes plt.subplots() xlabel ylabel title legend colorbar savefig tight_layout grid set_xlim set_ylim plot scatter hist boxplot imshow cmap alpha bins tick_params annotate quiver contour barh stackplot subplots_adjust axhline axvline semilogx semilogy loglog polar streamplot hexbin pcolor tricontour errorbar clabel set_aspect violinplot set_axis_off spines text hatch plt axis plt.bar() plt.axis import figure pyplot highlight_text pypalettes plt.subplots() xlabel ylabel title legend colorbar savefig tight_layout grid set_xlim set_ylim plot scatter hist boxplot imshow cmap alpha bins tick_params annotate quiver contour barh stackplot subplots_adjust axhline axvline semilogx semilogy loglog polar streamplot hexbin pcolor tricontour errorbar clabel set_aspect violinplot set_axis_off spines text hatch plt axis plt.bar() plt.axis import figure pyplot highlight_text pypalettes plt.subplots() xlabel ylabel title legend colorbar savefig tight_layout grid set_xlim set_ylim plot scatter hist boxplot imshow cmap alpha bins tick_params annotate quiver contour barh stackplot subplots_adjust axhline axvline semilogx semilogy loglog polar streamplot hexbin pcolor tricontour errorbar clabel set_aspect violinplot set_axis_off spines text hatch plt axis plt.bar() plt.axis import figure pyplot highlight_text pypalettes plt.subplots() xlabel ylabel title legend colorbar savefig tight_layout grid set_xlim set_ylim plot scatter hist boxplot imshow cmap alpha bins tick_params annotate quiver contour barh stackplot subplots_adjust axhline axvline semilogx semilogy loglog polar streamplot hexbin pcolor tricontour errorbar clabel set_aspect violinplot set_axis_off spines text hatch plt axis plt.bar() plt.axis import figure pyplot highlight_text pypalettes plt.subplots() xlabel ylabel title legend colorbar savefig tight_layout grid set_xlim set_ylim plot scatter hist boxplot imshow cmap alpha bins tick_params annotate quiver contour barh stackplot subplots_adjust axhline axvline semilogx semilogy loglog polar streamplot hexbin pcolor tricontour errorbar clabel set_aspect violinplot set_axis_off spines text hatch plt axis plt.bar() plt.axis import figure pyplot highlight_text pypalettes plt.subplots() xlabel ylabel title legend colorbar savefig tight_layout grid set_xlim set_ylim plot scatter hist boxplot imshow cmap alpha bins tick_params annotate quiver contour barh stackplot subplots_adjust axhline axvline semilogx semilogy loglog polar streamplot hexbin pcolor tricontour errorbar clabel set_aspect violinplot set_axis_off spines text hatch plt axis plt.bar() plt.axis import figure pyplot highlight_text pypalettes plt.subplots() xlabel ylabel title legend colorbar savefig tight_layout grid set_xlim set_ylim plot scatter hist boxplot imshow cmap alpha bins tick_params annotate quiver contour barh stackplot subplots_adjust axhline axvline semilogx semilogy loglog polar streamplot hexbin pcolor tricontour errorbar clabel set_aspect violinplot set_axis_off spines text hatch plt axis plt.bar() plt.axis import figure pyplot highlight_text pypalettes plt.subplots() xlabel ylabel title legend colorbar savefig tight_layout grid set_xlim set_ylim plot scatter hist boxplot imshow cmap alpha bins tick_params annotate quiver contour barh stackplot subplots_adjust axhline axvline semilogx semilogy loglog polar streamplot hexbin pcolor tricontour errorbar clabel set_aspect violinplot set_axis_off spines text hatch plt axis plt.bar() plt.axis import figure pyplot highlight_text pypalettes plt.subplots() xlabel ylabel title legend colorbar savefig tight_layout grid set_xlim set_ylim plot scatter hist boxplot imshow cmap alpha bins tick_params annotate quiver contour barh stackplot subplots_adjust axhline axvline semilogx semilogy loglog polar streamplot hexbin pcolor tricontour errorbar clabel set_aspect violinplot set_axis_off spines text hatch plt axis plt.bar() plt.axis import figure pyplot highlight_text pypalettes plt.subplots() xlabel ylabel title legend colorbar savefig tight_layout grid set_xlim set_ylim plot scatter hist boxplot imshow cmap alpha bins tick_params annotate quiver contour barh stackplot subplots_adjust axhline axvline semilogx semilogy loglog polar streamplot hexbin pcolor tricontour errorbar clabel set_aspect violinplot set_axis_off spines text hatch plt axis plt.bar() plt.axis import figure pyplot highlight_text pypalettes plt.subplots() xlabel ylabel title legend colorbar savefig tight_layout grid set_xlim set_ylim plot scatter hist boxplot imshow cmap alpha bins tick_params annotate quiver contour barh stackplot subplots_adjust axhline axvline semilogx semilogy loglog polar streamplot hexbin pcolor tricontour errorbar clabel set_aspect violinplot set_axis_off spines text hatch plt axis plt.bar() plt.axis import figure pyplot highlight_text pypalettes plt.subplots() xlabel ylabel title legend colorbar savefig tight_layout grid set_xlim set_ylim plot scatter hist boxplot imshow cmap alpha bins tick_params annotate quiver contour barh stackplot subplots_adjust axhline axvline semilogx semilogy loglog polar streamplot hexbin pcolor tricontour errorbar clabel set_aspect violinplot set_axis_off spines text hatch plt axis plt.bar() plt.axis import figure pyplot highlight_text pypalettes plt.subplots() xlabel ylabel title legend colorbar savefig tight_layout grid set_xlim set_ylim plot scatter hist boxplot imshow cmap alpha bins tick_params annotate quiver contour barh stackplot subplots_adjust axhline axvline semilogx semilogy loglog polar streamplot hexbin pcolor tricontour errorbar clabel set_aspect violinplot set_axis_off spines text hatch plt axis plt.bar() plt.axis import figure pyplot highlight_text pypalettes plt.subplots() xlabel ylabel title legend colorbar savefig tight_layout grid set_xlim set_ylim plot scatter hist boxplot imshow cmap alpha bins tick_params annotate quiver contour barh stackplot subplots_adjust axhline axvline semilogx semilogy loglog polar streamplot hexbin pcolor tricontour errorbar clabel set_aspect violinplot set_axis_off spines text hatch plt axis plt.bar() plt.axis import figure pyplot highlight_text pypalettes plt.subplots() xlabel ylabel title legend colorbar savefig tight_layout grid set_xlim set_ylim plot scatter hist boxplot imshow cmap alpha bins tick_params annotate quiver contour barh stackplot subplots_adjust axhline axvline semilogx semilogy loglog polar streamplot hexbin pcolor tricontour errorbar clabel set_aspect violinplot set_axis_off spines text hatch plt axis plt.bar() plt.axis import figure pyplot highlight_text pypalettes plt.subplots() xlabel ylabel title legend colorbar savefig tight_layout grid set_xlim set_ylim plot scatter hist boxplot imshow cmap alpha bins tick_params annotate quiver contour barh stackplot subplots_adjust axhline axvline semilogx semilogy loglog polar streamplot hexbin pcolor tricontour errorbar clabel set_aspect violinplot set_axis_off spines text hatch plt axis plt.bar() plt.axis import figure pyplot highlight_text pypalettes plt.subplots() xlabel ylabel title legend colorbar savefig tight_layout grid set_xlim set_ylim plot scatter hist boxplot imshow cmap alpha bins tick_params annotate quiver contour barh stackplot subplots_adjust axhline axvline semilogx semilogy loglog polar streamplot hexbin pcolor tricontour errorbar clabel set_aspect violinplot set_axis_off spines text hatch plt axis plt.bar() plt.axis import figure pyplot highlight_text pypalettes plt.subplots() xlabel ylabel title legend colorbar savefig tight_layout grid set_xlim set_ylim plot scatter hist boxplot imshow cmap alpha bins tick_params annotate quiver contour barh stackplot subplots_adjust axhline axvline semilogx semilogy loglog polar streamplot hexbin pcolor tricontour errorbar clabel set_aspect violinplot set_axis_off spines text hatch plt axis plt.bar() plt.axis import figure pyplot highlight_text pypalettes plt.subplots() xlabel ylabel title legend colorbar savefig tight_layout grid set_xlim set_ylim plot scatter hist boxplot imshow cmap alpha bins tick_params annotate quiver contour barh stackplot subplots_adjust axhline axvline semilogx semilogy loglog polar streamplot hexbin pcolor tricontour errorbar clabel set_aspect violinplot set_axis_off spines text hatch plt axis plt.bar() plt.axis import figure pyplot highlight_text pypalettes plt.subplots() xlabel ylabel title legend colorbar savefig tight_layout grid set_xlim set_ylim plot scatter hist boxplot imshow cmap alpha bins tick_params annotate quiver contour barh stackplot subplots_adjust axhline axvline semilogx semilogy loglog polar streamplot hexbin pcolor tricontour errorbar clabel set_aspect violinplot set_axis_off spines text hatch plt axis plt.bar() plt.axis import figure pyplot highlight_text pypalettes plt.subplots() xlabel ylabel title legend colorbar savefig tight_layout grid set_xlim set_ylim plot scatter hist boxplot imshow cmap alpha bins tick_params annotate quiver contour barh stackplot subplots_adjust axhline axvline semilogx semilogy loglog polar streamplot hexbin pcolor tricontour errorbar clabel set_aspect violinplot set_axis_off spines text hatch plt axis plt.bar() plt.axis import figure pyplot highlight_text pypalettes plt.subplots() xlabel ylabel title legend colorbar savefig tight_layout grid set_xlim set_ylim plot scatter hist boxplot imshow cmap alpha bins tick_params annotate quiver contour barh stackplot subplots_adjust axhline axvline semilogx semilogy loglog polar streamplot hexbin pcolor tricontour errorbar clabel set_aspect violinplot set_axis_off spines text hatch plt axis plt.bar() plt.axis import figure pyplot highlight_text pypalettes plt.subplots() xlabel ylabel title legend colorbar savefig tight_layout grid set_xlim set_ylim plot scatter hist boxplot imshow cmap alpha bins tick_params annotate quiver contour barh stackplot subplots_adjust axhline axvline semilogx semilogy loglog polar streamplot hexbin pcolor tricontour errorbar clabel set_aspect violinplot set_axis_off spines text hatch plt axis plt.bar() plt.axis import figure pyplot highlight_text pypalettes plt.subplots() xlabel ylabel title legend colorbar savefig tight_layout grid set_xlim set_ylim plot scatter hist boxplot imshow cmap alpha bins tick_params annotate quiver contour barh stackplot subplots_adjust axhline axvline semilogx semilogy loglog polar streamplot hexbin pcolor tricontour errorbar clabel set_aspect violinplot set_axis_off spines text hatch plt axis plt.bar() plt.axis import figure pyplot highlight_text pypalettes plt.subplots() xlabel ylabel title legend colorbar savefig tight_layout grid set_xlim set_ylim plot scatter hist boxplot imshow cmap alpha bins tick_params annotate quiver contour barh stackplot subplots_adjust axhline axvline semilogx semilogy loglog polar streamplot hexbin pcolor tricontour errorbar clabel set_aspect violinplot set_axis_off spines text hatch plt axis plt.bar() plt.axis import figure pyplot highlight_text pypalettes plt.subplots() xlabel ylabel title legend colorbar savefig tight_layout grid set_xlim set_ylim plot scatter hist boxplot imshow cmap alpha bins tick_params annotate quiver contour barh stackplot subplots_adjust axhline axvline semilogx semilogy loglog polar streamplot hexbin pcolor tricontour errorbar clabel set_aspect violinplot set_axis_off spines text hatch plt axis plt.bar() plt.axis import figure pyplot highlight_text pypalettes plt.subplots() xlabel ylabel title legend colorbar savefig tight_layout grid set_xlim set_ylim plot scatter hist boxplot imshow cmap alpha bins tick_params annotate quiver contour barh stackplot subplots_adjust axhline axvline semilogx semilogy loglog polar streamplot hexbin pcolor tricontour errorbar clabel set_aspect violinplot set_axis_off spines text hatch plt axis plt.bar() plt.axis import figure pyplot highlight_text pypalettes plt.subplots() xlabel ylabel title legend colorbar savefig tight_layout grid set_xlim set_ylim plot scatter hist boxplot imshow cmap alpha bins tick_params annotate quiver contour barh stackplot subplots_adjust axhline axvline semilogx semilogy loglog polar streamplot hexbin pcolor tricontour errorbar clabel set_aspect violinplot set_axis_off spines text hatch plt axis plt.bar() plt.axis import figure pyplot highlight_text pypalettes plt.subplots() xlabel ylabel title legend colorbar savefig tight_layout grid set_xlim set_ylim plot scatter hist boxplot imshow cmap alpha bins tick_params annotate quiver contour barh stackplot subplots_adjust axhline axvline semilogx semilogy loglog polar streamplot hexbin pcolor tricontour errorbar clabel set_aspect violinplot set_axis_off spines text hatch plt axis plt.bar() plt.axis import figure pyplot highlight_text pypalettes plt.subplots() xlabel ylabel title legend colorbar savefig tight_layout grid set_xlim set_ylim plot scatter hist boxplot imshow cmap alpha bins tick_params annotate quiver contour barh stackplot subplots_adjust axhline axvline semilogx semilogy loglog polar streamplot hexbin pcolor tricontour errorbar clabel set_aspect violinplot set_axis_off spines text hatch plt axis plt.bar() plt.axis import figure pyplot highlight_text pypalettes plt.subplots() xlabel ylabel title legend colorbar savefig tight_layout grid set_xlim set_ylim plot scatter hist boxplot imshow cmap alpha bins tick_params annotate quiver contour barh stackplot subplots_adjust axhline axvline semilogx semilogy loglog polar streamplot hexbin pcolor tricontour errorbar clabel set_aspect violinplot set_axis_off spines text hatch plt axis plt.bar() plt.axis import figure pyplot highlight_text pypalettes plt.subplots() xlabel ylabel title legend colorbar savefig tight_layout grid set_xlim set_ylim plot scatter hist boxplot imshow cmap alpha bins tick_params annotate quiver contour barh stackplot subplots_adjust axhline axvline semilogx semilogy loglog polar streamplot hexbin pcolor tricontour errorbar clabel set_aspect violinplot set_axis_off spines text hatch plt axis plt.bar() plt.axis import figure pyplot highlight_text pypalettes plt.subplots() xlabel ylabel title legend colorbar savefig tight_layout grid set_xlim set_ylim plot scatter hist boxplot imshow cmap alpha bins tick_params annotate quiver contour barh stackplot subplots_adjust axhline axvline semilogx semilogy loglog polar streamplot hexbin pcolor tricontour errorbar clabel set_aspect violinplot set_axis_off spines text hatch plt axis plt.bar() plt.axis import figure pyplot highlight_text pypalettes plt.subplots() xlabel ylabel title legend colorbar savefig tight_layout grid set_xlim set_ylim plot scatter hist boxplot imshow cmap alpha bins tick_params annotate quiver contour barh stackplot subplots_adjust axhline axvline semilogx semilogy loglog polar streamplot hexbin pcolor tricontour errorbar clabel set_aspect violinplot set_axis_off spines text hatch plt axis plt.bar() plt.axis import figure pyplot highlight_text pypalettes plt.subplots() xlabel ylabel title legend colorbar savefig tight_layout grid set_xlim set_ylim plot scatter hist boxplot imshow cmap alpha bins tick_params annotate quiver contour barh stackplot subplots_adjust axhline axvline semilogx semilogy loglog polar streamplot hexbin pcolor tricontour errorbar clabel set_aspect violinplot set_axis_off spines text hatch plt axis plt.bar() plt.axis import figure pyplot highlight_text pypalettes plt.subplots() xlabel ylabel title legend colorbar savefig tight_layout grid set_xlim set_ylim plot scatter hist boxplot imshow cmap alpha bins tick_params annotate quiver contour barh stackplot subplots_adjust axhline axvline semilogx semilogy loglog polar streamplot hexbin pcolor tricontour errorbar clabel set_aspect violinplot set_axis_off spines text hatch plt axis plt.bar() plt.axis import figure pyplot highlight_text pypalettes plt.subplots() xlabel ylabel title legend colorbar savefig tight_layout grid set_xlim set_ylim plot scatter hist boxplot imshow cmap alpha bins tick_params annotate quiver contour barh stackplot subplots_adjust axhline axvline semilogx semilogy loglog polar streamplot hexbin pcolor tricontour errorbar clabel set_aspect violinplot set_axis_off spines text hatch plt axis plt.bar() plt.axis import figure pyplot highlight_text pypalettes plt.subplots() xlabel ylabel title legend colorbar savefig tight_layout grid set_xlim set_ylim plot scatter hist boxplot imshow cmap alpha bins tick_params annotate quiver contour barh stackplot subplots_adjust axhline axvline semilogx semilogy loglog polar streamplot hexbin pcolor tricontour errorbar clabel set_aspect violinplot set_axis_off spines text hatch plt axis plt.bar() plt.axis import figure pyplot highlight_text pypalettes plt.subplots() xlabel ylabel title legend colorbar savefig tight_layout grid set_xlim set_ylim plot scatter hist boxplot imshow cmap alpha bins tick_params annotate quiver contour barh stackplot subplots_adjust axhline axvline semilogx semilogy loglog polar streamplot hexbin pcolor tricontour errorbar clabel set_aspect violinplot set_axis_off spines text hatch plt axis plt.bar() plt.axis import figure pyplot highlight_text pypalettes plt.subplots() xlabel ylabel title legend colorbar savefig tight_layout grid set_xlim set_ylim plot scatter hist boxplot imshow cmap alpha bins tick_params annotate quiver contour barh stackplot subplots_adjust axhline axvline semilogx semilogy loglog polar streamplot hexbin pcolor tricontour errorbar clabel set_aspect violinplot set_axis_off spines text hatch plt axis plt.bar() plt.axis import figure pyplot highlight_text pypalettes plt.subplots() xlabel ylabel title legend colorbar savefig tight_layout grid set_xlim set_ylim plot scatter hist boxplot imshow cmap alpha bins tick_params annotate quiver contour barh stackplot subplots_adjust axhline axvline semilogx semilogy loglog polar streamplot hexbin pcolor tricontour errorbar clabel set_aspect violinplot set_axis_off spines text hatch plt axis plt.bar() plt.axis import figure pyplot highlight_text pypalettes plt.subplots() xlabel ylabel title legend colorbar savefig tight_layout grid set_xlim set_ylim plot scatter hist boxplot imshow cmap alpha bins tick_params annotate quiver contour barh stackplot subplots_adjust axhline axvline semilogx semilogy loglog polar streamplot hexbin pcolor tricontour errorbar clabel set_aspect violinplot set_axis_off spines text hatch plt axis plt.bar() plt.axis import figure pyplot highlight_text pypalettes plt.subplots() xlabel ylabel title legend colorbar savefig tight_layout grid set_xlim set_ylim plot scatter hist boxplot imshow cmap alpha bins tick_params annotate quiver contour barh stackplot subplots_adjust axhline axvline semilogx semilogy loglog polar streamplot hexbin pcolor tricontour errorbar clabel set_aspect violinplot set_axis_off spines text hatch plt axis plt.bar() plt.axis import figure pyplot highlight_text pypalettes plt.subplots() xlabel ylabel title legend colorbar savefig tight_layout grid set_xlim set_ylim plot scatter hist boxplot imshow cmap alpha bins tick_params annotate quiver contour barh stackplot subplots_adjust axhline axvline semilogx semilogy loglog polar streamplot hexbin pcolor tricontour errorbar clabel set_aspect violinplot set_axis_off spines text hatch plt axis plt.bar() plt.axis import figure pyplot highlight_text pypalettes plt.subplots() xlabel ylabel title legend colorbar savefig tight_layout grid set_xlim set_ylim plot scatter hist boxplot imshow cmap alpha bins tick_params annotate quiver contour barh stackplot subplots_adjust axhline axvline semilogx semilogy loglog polar streamplot hexbin pcolor tricontour errorbar clabel set_aspect violinplot set_axis_off spines text hatch plt axis plt.bar() plt.axis import figure pyplot highlight_text pypalettes plt.subplots() xlabel ylabel title legend colorbar savefig tight_layout grid set_xlim set_ylim plot scatter hist boxplot imshow cmap alpha bins tick_params annotate quiver contour barh stackplot subplots_adjust axhline axvline semilogx semilogy loglog polar streamplot hexbin pcolor tricontour errorbar clabel set_aspect violinplot set_axis_off spines text hatch plt axis plt.bar() plt.axis import figure pyplot highlight_text pypalettes plt.subplots() xlabel ylabel title legend colorbar savefig tight_layout grid set_xlim set_ylim plot scatter hist boxplot imshow cmap alpha bins tick_params annotate quiver contour barh stackplot subplots_adjust axhline axvline semilogx semilogy loglog polar streamplot hexbin pcolor tricontour errorbar clabel set_aspect violinplot set_axis_off spines text hatch plt axis plt.bar() plt.axis import figure pyplot highlight_text pypalettes plt.subplots() xlabel ylabel title legend colorbar savefig tight_layout grid set_xlim set_ylim plot scatter hist boxplot imshow cmap alpha bins tick_params annotate quiver contour barh stackplot subplots_adjust axhline axvline semilogx semilogy loglog polar streamplot hexbin pcolor tricontour errorbar clabel set_aspect violinplot set_axis_off spines text hatch plt axis plt.bar() plt.axis import figure pyplot highlight_text pypalettes plt.subplots() xlabel ylabel title legend colorbar savefig tight_layout grid set_xlim set_ylim plot scatter hist boxplot imshow cmap alpha bins tick_params annotate quiver contour barh stackplot subplots_adjust axhline axvline semilogx semilogy loglog polar streamplot hexbin pcolor tricontour errorbar clabel set_aspect violinplot set_axis_off spines text hatch plt axis plt.bar() plt.axis import figure pyplot highlight_text pypalettes plt.subplots() xlabel ylabel title legend colorbar savefig tight_layout grid set_xlim set_ylim plot scatter hist boxplot imshow cmap alpha bins tick_params annotate quiver contour barh stackplot subplots_adjust axhline axvline semilogx semilogy loglog polar streamplot hexbin pcolor tricontour errorbar clabel set_aspect violinplot set_axis_off spines text hatch plt axis plt.bar() plt.axis import figure pyplot highlight_text pypalettes plt.subplots() xlabel ylabel title legend colorbar savefig tight_layout grid set_xlim set_ylim plot scatter hist boxplot imshow cmap alpha bins tick_params annotate quiver contour barh stackplot subplots_adjust axhline axvline semilogx semilogy loglog polar streamplot hexbin pcolor tricontour errorbar clabel set_aspect violinplot set_axis_off spines text hatch plt axis plt.bar() plt.axis import figure pyplot highlight_text pypalettes plt.subplots() xlabel ylabel title legend colorbar savefig tight_layout grid set_xlim set_ylim plot scatter hist boxplot imshow cmap alpha bins tick_params annotate quiver contour barh stackplot subplots_adjust axhline axvline semilogx semilogy loglog polar streamplot hexbin pcolor tricontour errorbar clabel set_aspect violinplot set_axis_off spines text hatch plt axis plt.bar() plt.axis import figure pyplot highlight_text pypalettes plt.subplots() xlabel ylabel title legend colorbar savefig tight_layout grid set_xlim set_ylim plot scatter hist boxplot imshow cmap alpha bins tick_params annotate quiver contour barh stackplot subplots_adjust axhline axvline semilogx semilogy loglog polar streamplot hexbin pcolor tricontour errorbar clabel set_aspect violinplot set_axis_off spines text hatch plt axis plt.bar() plt.axis import figure pyplot highlight_text pypalettes plt.subplots() xlabel ylabel title legend colorbar savefig tight_layout grid set_xlim set_ylim plot scatter hist boxplot imshow cmap alpha bins tick_params annotate quiver contour barh stackplot subplots_adjust axhline axvline semilogx semilogy loglog polar streamplot hexbin pcolor tricontour errorbar clabel set_aspect violinplot set_axis_off spines text hatch plt axis plt.bar() plt.axis import figure pyplot highlight_text pypalettes plt.subplots() xlabel ylabel title legend colorbar savefig tight_layout grid set_xlim set_ylim plot scatter hist boxplot imshow cmap alpha bins tick_params annotate quiver contour barh stackplot subplots_adjust axhline axvline semilogx semilogy loglog polar streamplot hexbin pcolor tricontour errorbar clabel set_aspect violinplot set_axis_off spines text hatch plt axis plt.bar() plt.axis import figure pyplot highlight_text pypalettes plt.subplots() xlabel ylabel title legend colorbar savefig tight_layout grid set_xlim set_ylim plot scatter hist boxplot imshow cmap alpha bins tick_params annotate quiver contour barh stackplot subplots_adjust axhline axvline semilogx semilogy loglog polar streamplot hexbin pcolor tricontour errorbar clabel set_aspect violinplot set_axis_off spines text hatch plt axis plt.bar() plt.axis import figure pyplot highlight_text pypalettes plt.subplots() xlabel ylabel title legend colorbar savefig tight_layout grid set_xlim set_ylim plot scatter hist boxplot imshow cmap alpha bins tick_params annotate quiver contour barh stackplot subplots_adjust axhline axvline semilogx semilogy loglog polar streamplot hexbin pcolor tricontour errorbar clabel set_aspect violinplot set_axis_off spines text hatch plt axis plt.bar() plt.axis import figure pyplot highlight_text pypalettes plt.subplots() xlabel ylabel title legend colorbar savefig tight_layout grid set_xlim set_ylim plot scatter hist boxplot imshow cmap alpha bins tick_params annotate quiver contour barh stackplot subplots_adjust axhline axvline semilogx semilogy loglog polar streamplot hexbin pcolor tricontour errorbar clabel set_aspect violinplot set_axis_off spines text hatch plt axis plt.bar() plt.axis import figure pyplot highlight_text pypalettes plt.subplots() xlabel ylabel title legend colorbar savefig tight_layout grid set_xlim set_ylim plot scatter hist boxplot imshow cmap alpha bins tick_params annotate quiver contour barh stackplot subplots_adjust axhline axvline semilogx semilogy loglog polar streamplot hexbin pcolor tricontour errorbar clabel set_aspect violinplot set_axis_off spines text hatch plt axis plt.bar() plt.axis import figure pyplot highlight_text pypalettes plt.subplots() xlabel ylabel title legend colorbar savefig tight_layout grid set_xlim set_ylim plot scatter hist boxplot imshow cmap alpha bins tick_params annotate quiver contour barh stackplot subplots_adjust axhline axvline semilogx semilogy loglog polar streamplot hexbin pcolor tricontour errorbar clabel set_aspect violinplot set_axis_off spines text hatch plt axis plt.bar() plt.axis import figure pyplot highlight_text pypalettes plt.subplots() xlabel ylabel title legend colorbar savefig tight_layout grid set_xlim set_ylim plot scatter hist boxplot imshow cmap alpha bins tick_params annotate quiver contour barh stackplot subplots_adjust axhline axvline semilogx semilogy loglog polar streamplot hexbin pcolor tricontour errorbar clabel set_aspect violinplot set_axis_off spines text hatch plt axis plt.bar() plt.axis import figure pyplot highlight_text pypalettes plt.subplots() xlabel ylabel title legend colorbar savefig tight_layout grid set_xlim set_ylim plot scatter hist boxplot imshow cmap alpha bins tick_params annotate quiver contour barh stackplot subplots_adjust axhline axvline semilogx semilogy loglog polar streamplot hexbin pcolor tricontour errorbar clabel set_aspect violinplot set_axis_off spines text hatch plt axis plt.bar() plt.axis import figure pyplot highlight_text pypalettes plt.subplots() xlabel ylabel title legend colorbar savefig tight_layout grid set_xlim set_ylim plot scatter hist boxplot imshow cmap alpha bins tick_params annotate quiver contour barh stackplot subplots_adjust axhline axvline semilogx semilogy loglog polar streamplot hexbin pcolor tricontour errorbar clabel set_aspect violinplot set_axis_off spines text hatch plt axis plt.bar() plt.axis import figure pyplot highlight_text pypalettes plt.subplots() xlabel ylabel title legend colorbar savefig tight_layout grid set_xlim set_ylim plot scatter hist boxplot imshow cmap alpha bins tick_params annotate quiver contour barh stackplot subplots_adjust axhline axvline semilogx semilogy loglog polar streamplot hexbin pcolor tricontour errorbar clabel set_aspect violinplot set_axis_off spines text hatch plt axis plt.bar() plt.axis import figure pyplot highlight_text pypalettes plt.subplots() xlabel ylabel title legend colorbar savefig tight_layout grid set_xlim set_ylim plot scatter hist boxplot imshow cmap alpha bins tick_params annotate quiver contour barh stackplot subplots_adjust axhline axvline semilogx semilogy loglog polar streamplot hexbin pcolor tricontour errorbar clabel set_aspect violinplot set_axis_off spines text hatch plt axis plt.bar() plt.axis import figure pyplot highlight_text pypalettes plt.subplots() xlabel ylabel title legend colorbar savefig tight_layout grid set_xlim set_ylim plot scatter hist boxplot imshow cmap alpha bins tick_params annotate quiver contour barh stackplot subplots_adjust axhline axvline semilogx semilogy loglog polar streamplot hexbin pcolor tricontour errorbar clabel set_aspect violinplot set_axis_off spines text hatch plt axis plt.bar() plt.axis import figure pyplot highlight_text pypalettes plt.subplots() xlabel ylabel title legend colorbar savefig tight_layout grid set_xlim set_ylim plot scatter hist boxplot imshow cmap alpha bins tick_params annotate quiver contour barh stackplot subplots_adjust axhline axvline semilogx semilogy loglog polar streamplot hexbin pcolor tricontour errorbar clabel set_aspect violinplot set_axis_off spines text hatch plt axis plt.bar() plt.axis import figure pyplot highlight_text pypalettes plt.subplots() xlabel ylabel title legend colorbar savefig tight_layout grid set_xlim set_ylim plot scatter hist boxplot imshow cmap alpha bins tick_params annotate quiver contour barh stackplot subplots_adjust axhline axvline semilogx semilogy loglog polar streamplot hexbin pcolor tricontour errorbar clabel set_aspect violinplot set_axis_off spines text hatch plt axis plt.bar() plt.axis import figure pyplot highlight_text pypalettes plt.subplots() xlabel ylabel title legend colorbar savefig tight_layout grid set_xlim set_ylim plot scatter hist boxplot imshow cmap alpha bins tick_params annotate quiver contour barh stackplot subplots_adjust axhline axvline semilogx semilogy loglog polar streamplot hexbin pcolor tricontour errorbar clabel set_aspect violinplot set_axis_off spines text hatch plt axis plt.bar() plt.axis import figure pyplot highlight_text pypalettes plt.subplots() xlabel ylabel title legend colorbar savefig tight_layout grid set_xlim set_ylim plot scatter hist boxplot imshow cmap alpha bins tick_params annotate quiver contour barh stackplot subplots_adjust axhline axvline semilogx semilogy loglog polar streamplot hexbin pcolor tricontour errorbar clabel set_aspect violinplot set_axis_off spines text hatch plt axis plt.bar() plt.axis import figure pyplot highlight_text pypalettes plt.subplots() xlabel ylabel title legend colorbar savefig tight_layout grid set_xlim set_ylim plot scatter hist boxplot imshow cmap alpha bins tick_params annotate quiver contour barh stackplot subplots_adjust axhline axvline semilogx semilogy loglog polar streamplot hexbin pcolor tricontour errorbar clabel set_aspect violinplot set_axis_off spines text hatch plt axis plt.bar() plt.axis import figure pyplot highlight_text pypalettes plt.subplots() xlabel ylabel title legend colorbar savefig tight_layout grid set_xlim set_ylim plot scatter hist boxplot imshow cmap alpha bins tick_params annotate quiver contour barh stackplot subplots_adjust axhline axvline semilogx semilogy loglog polar streamplot hexbin pcolor tricontour errorbar clabel set_aspect violinplot set_axis_off spines text hatch plt axis plt.bar() plt.axis import figure pyplot highlight_text pypalettes plt.subplots() xlabel ylabel title legend colorbar savefig tight_layout grid set_xlim set_ylim plot scatter hist boxplot imshow cmap alpha bins tick_params annotate quiver contour barh stackplot subplots_adjust axhline axvline semilogx semilogy loglog polar streamplot hexbin pcolor tricontour errorbar clabel set_aspect violinplot set_axis_off spines text hatch plt axis plt.bar() plt.axis import figure pyplot highlight_text pypalettes plt.subplots() xlabel ylabel title legend colorbar savefig tight_layout grid set_xlim set_ylim plot scatter hist boxplot imshow cmap alpha bins tick_params annotate quiver contour barh stackplot subplots_adjust axhline axvline semilogx semilogy loglog polar streamplot hexbin pcolor tricontour errorbar clabel set_aspect violinplot set_axis_off spines text hatch plt axis plt.bar() plt.axis import figure pyplot highlight_text pypalettes plt.subplots() xlabel ylabel title legend colorbar savefig tight_layout grid set_xlim set_ylim plot scatter hist boxplot imshow cmap alpha bins tick_params annotate quiver contour barh stackplot subplots_adjust axhline axvline semilogx semilogy loglog polar streamplot hexbin pcolor tricontour errorbar clabel set_aspect violinplot set_axis_off spines text hatch plt axis plt.bar() plt.axis import figure pyplot highlight_text pypalettes plt.subplots() xlabel ylabel title legend colorbar savefig tight_layout grid set_xlim set_ylim plot scatter hist boxplot imshow cmap alpha bins tick_params annotate quiver contour barh stackplot subplots_adjust axhline axvline semilogx semilogy loglog polar streamplot hexbin pcolor tricontour errorbar clabel set_aspect violinplot set_axis_off spines text hatch plt axis plt.bar() plt.axis import figure pyplot highlight_text pypalettes plt.subplots() xlabel ylabel title legend colorbar savefig tight_layout grid set_xlim set_ylim plot scatter hist boxplot imshow cmap alpha bins tick_params annotate quiver contour barh stackplot subplots_adjust axhline axvline semilogx semilogy loglog polar streamplot hexbin pcolor tricontour errorbar clabel set_aspect violinplot set_axis_off spines text hatch plt axis plt.bar() plt.axis import figure pyplot highlight_text pypalettes plt.subplots() xlabel ylabel title legend colorbar savefig tight_layout grid set_xlim set_ylim plot scatter hist boxplot imshow cmap alpha bins tick_params annotate quiver contour barh stackplot subplots_adjust axhline axvline semilogx semilogy loglog polar streamplot hexbin pcolor tricontour errorbar clabel set_aspect violinplot set_axis_off spines text hatch plt axis plt.bar() plt.axis import figure pyplot highlight_text pypalettes plt.subplots() xlabel ylabel title legend colorbar savefig tight_layout grid set_xlim set_ylim plot scatter hist boxplot imshow cmap alpha bins tick_params annotate quiver contour barh stackplot subplots_adjust axhline axvline semilogx semilogy loglog polar streamplot hexbin pcolor tricontour errorbar clabel set_aspect violinplot set_axis_off spines text hatch plt axis plt.bar() plt.axis import figure pyplot highlight_text pypalettes plt.subplots() xlabel ylabel title legend colorbar savefig tight_layout grid set_xlim set_ylim plot scatter hist boxplot imshow cmap alpha bins tick_params annotate quiver contour barh stackplot subplots_adjust axhline axvline semilogx semilogy loglog polar streamplot hexbin pcolor tricontour errorbar clabel set_aspect violinplot set_axis_off spines text hatch plt axis plt.bar() plt.axis import figure pyplot highlight_text pypalettes plt.subplots() xlabel ylabel title legend colorbar savefig tight_layout grid set_xlim set_ylim plot scatter hist boxplot imshow cmap alpha bins tick_params annotate quiver contour barh stackplot subplots_adjust axhline axvline semilogx semilogy loglog polar streamplot hexbin pcolor tricontour errorbar clabel set_aspect violinplot set_axis_off spines text hatch plt axis plt.bar() plt.axis import figure pyplot highlight_text pypalettes plt.subplots() xlabel ylabel title legend colorbar savefig tight_layout grid set_xlim set_ylim plot scatter hist boxplot imshow cmap alpha bins tick_params annotate quiver contour barh stackplot subplots_adjust axhline axvline semilogx semilogy loglog polar streamplot hexbin pcolor tricontour errorbar clabel set_aspect violinplot set_axis_off spines text hatch plt axis plt.bar() plt.axis import figure pyplot highlight_text pypalettes plt.subplots() xlabel ylabel title legend colorbar savefig tight_layout grid set_xlim set_ylim plot scatter hist boxplot imshow cmap alpha bins tick_params annotate quiver contour barh stackplot subplots_adjust axhline axvline semilogx semilogy loglog polar streamplot hexbin pcolor tricontour errorbar clabel set_aspect violinplot set_axis_off spines text hatch plt axis plt.bar() plt.axis import figure pyplot highlight_text pypalettes plt.subplots() xlabel ylabel title legend colorbar savefig tight_layout grid set_xlim set_ylim plot scatter hist boxplot imshow cmap alpha bins tick_params annotate quiver contour barh stackplot subplots_adjust axhline axvline semilogx semilogy loglog polar streamplot hexbin pcolor tricontour errorbar clabel set_aspect violinplot set_axis_off spines text hatch plt axis plt.bar() plt.axis import figure pyplot highlight_text pypalettes plt.subplots() xlabel ylabel title legend colorbar savefig tight_layout grid set_xlim set_ylim plot scatter hist boxplot imshow cmap alpha bins tick_params annotate quiver contour barh stackplot subplots_adjust axhline axvline semilogx semilogy loglog polar streamplot hexbin pcolor tricontour errorbar clabel set_aspect violinplot set_axis_off spines text hatch plt axis plt.bar() plt.axis import figure pyplot highlight_text pypalettes plt.subplots() xlabel ylabel title legend colorbar savefig tight_layout grid set_xlim set_ylim plot scatter hist boxplot imshow cmap alpha bins tick_params annotate quiver contour barh stackplot subplots_adjust axhline axvline semilogx semilogy loglog polar streamplot hexbin pcolor tricontour errorbar clabel set_aspect violinplot set_axis_off spines text hatch plt axis plt.bar() plt.axis import figure pyplot highlight_text pypalettes plt.subplots() xlabel ylabel title legend colorbar savefig tight_layout grid set_xlim set_ylim plot scatter hist boxplot imshow cmap alpha bins tick_params annotate quiver contour barh stackplot subplots_adjust axhline axvline semilogx semilogy loglog polar streamplot hexbin pcolor tricontour errorbar clabel set_aspect violinplot set_axis_off spines text hatch plt axis plt.bar() plt.axis import figure pyplot highlight_text pypalettes plt.subplots() xlabel ylabel title legend colorbar savefig tight_layout grid set_xlim set_ylim plot scatter hist boxplot imshow cmap alpha bins tick_params annotate quiver contour barh stackplot subplots_adjust axhline axvline semilogx semilogy loglog polar streamplot hexbin pcolor tricontour errorbar clabel set_aspect violinplot set_axis_off spines text hatch plt axis plt.bar() plt.axis import figure pyplot highlight_text pypalettes plt.subplots() xlabel ylabel title legend colorbar savefig tight_layout grid set_xlim set_ylim plot scatter hist boxplot imshow cmap alpha bins tick_params annotate quiver contour barh stackplot subplots_adjust axhline axvline semilogx semilogy loglog polar streamplot hexbin pcolor tricontour errorbar clabel set_aspect violinplot set_axis_off spines text hatch plt axis plt.bar() plt.axis import figure pyplot highlight_text pypalettes plt.subplots() xlabel ylabel title legend colorbar savefig tight_layout grid set_xlim set_ylim plot scatter hist boxplot imshow cmap alpha bins tick_params annotate quiver contour barh stackplot subplots_adjust axhline axvline semilogx semilogy loglog polar streamplot hexbin pcolor tricontour errorbar clabel set_aspect violinplot set_axis_off spines text hatch plt axis plt.bar() plt.axis import figure pyplot highlight_text pypalettes plt.subplots() xlabel ylabel title legend colorbar savefig tight_layout grid set_xlim set_ylim plot scatter hist boxplot imshow cmap alpha bins tick_params annotate quiver contour barh stackplot subplots_adjust axhline axvline semilogx semilogy loglog polar streamplot hexbin pcolor tricontour errorbar clabel set_aspect violinplot set_axis_off spines text hatch plt axis plt.bar() plt.axis import figure pyplot highlight_text pypalettes plt.subplots() xlabel ylabel title legend colorbar savefig tight_layout grid set_xlim set_ylim plot scatter hist boxplot imshow cmap alpha bins tick_params annotate quiver contour barh stackplot subplots_adjust axhline axvline semilogx semilogy loglog polar streamplot hexbin pcolor tricontour errorbar clabel set_aspect violinplot set_axis_off spines text hatch plt axis plt.bar() plt.axis import figure pyplot highlight_text pypalettes plt.subplots() xlabel ylabel title legend colorbar savefig tight_layout grid set_xlim set_ylim plot scatter hist boxplot imshow cmap alpha bins tick_params annotate quiver contour barh stackplot subplots_adjust axhline axvline semilogx semilogy loglog polar streamplot hexbin pcolor tricontour errorbar clabel set_aspect violinplot set_axis_off spines text hatch plt axis plt.bar() plt.axis import figure pyplot highlight_text pypalettes plt.subplots() xlabel ylabel title legend colorbar savefig tight_layout grid set_xlim set_ylim plot scatter hist boxplot imshow cmap alpha bins tick_params annotate quiver contour barh stackplot subplots_adjust axhline axvline semilogx semilogy loglog polar streamplot hexbin pcolor tricontour errorbar clabel set_aspect violinplot set_axis_off spines text hatch plt axis plt.bar() plt.axis import figure pyplot highlight_text pypalettes plt.subplots() xlabel ylabel title legend colorbar savefig tight_layout grid set_xlim set_ylim plot scatter hist boxplot imshow cmap alpha bins tick_params annotate quiver contour barh stackplot subplots_adjust axhline axvline semilogx semilogy loglog polar streamplot hexbin pcolor tricontour errorbar clabel set_aspect violinplot set_axis_off spines text hatch plt axis plt.bar() plt.axis import figure pyplot highlight_text pypalettes plt.subplots() xlabel ylabel title legend colorbar savefig tight_layout grid set_xlim set_ylim plot scatter hist boxplot imshow cmap alpha bins tick_params annotate quiver contour barh stackplot subplots_adjust axhline axvline semilogx semilogy loglog polar streamplot hexbin pcolor tricontour errorbar clabel set_aspect violinplot set_axis_off spines text hatch plt axis plt.bar() plt.axis import figure pyplot highlight_text pypalettes plt.subplots() xlabel ylabel title legend colorbar savefig tight_layout grid set_xlim set_ylim plot scatter hist boxplot imshow cmap alpha bins tick_params annotate quiver contour barh stackplot subplots_adjust axhline axvline semilogx semilogy loglog polar streamplot hexbin pcolor tricontour errorbar clabel set_aspect violinplot set_axis_off spines text hatch plt axis plt.bar() plt.axis import figure pyplot highlight_text pypalettes plt.subplots() xlabel ylabel title legend colorbar savefig tight_layout grid set_xlim set_ylim plot scatter hist boxplot imshow cmap alpha bins tick_params annotate quiver contour barh stackplot subplots_adjust axhline axvline semilogx semilogy loglog polar streamplot hexbin pcolor tricontour errorbar clabel set_aspect violinplot set_axis_off spines text hatch plt axis plt.bar() plt.axis import figure pyplot highlight_text pypalettes plt.subplots() xlabel ylabel title legend colorbar savefig tight_layout grid set_xlim set_ylim plot scatter hist boxplot imshow cmap alpha bins tick_params annotate quiver contour barh stackplot subplots_adjust axhline axvline semilogx semilogy loglog polar streamplot hexbin pcolor tricontour errorbar clabel set_aspect violinplot set_axis_off spines text hatch plt axis plt.bar() plt.axis import figure pyplot highlight_text pypalettes plt.subplots() xlabel ylabel title legend colorbar savefig tight_layout grid set_xlim set_ylim plot scatter hist boxplot imshow cmap alpha bins tick_params annotate quiver contour barh stackplot subplots_adjust axhline axvline semilogx semilogy loglog polar streamplot hexbin pcolor tricontour errorbar clabel set_aspect violinplot set_axis_off spines text hatch plt axis plt.bar() plt.axis import figure pyplot highlight_text pypalettes plt.subplots() xlabel ylabel title legend colorbar savefig tight_layout grid set_xlim set_ylim plot scatter hist boxplot imshow cmap alpha bins tick_params annotate quiver contour barh stackplot subplots_adjust axhline axvline semilogx semilogy loglog polar streamplot hexbin pcolor tricontour errorbar clabel set_aspect violinplot set_axis_off spines text hatch plt axis plt.bar() plt.axis import figure pyplot highlight_text pypalettes plt.subplots() xlabel ylabel title legend colorbar savefig tight_layout grid set_xlim set_ylim plot scatter hist boxplot imshow cmap alpha bins tick_params annotate quiver contour barh stackplot subplots_adjust axhline axvline semilogx semilogy loglog polar streamplot hexbin pcolor tricontour errorbar clabel set_aspect violinplot set_axis_off spines text hatch plt axis plt.bar() plt.axis import figure pyplot highlight_text pypalettes plt.subplots() xlabel ylabel title legend colorbar savefig tight_layout grid set_xlim set_ylim plot scatter hist boxplot imshow cmap alpha bins tick_params annotate quiver contour barh stackplot subplots_adjust axhline axvline semilogx semilogy loglog polar streamplot hexbin pcolor tricontour errorbar clabel set_aspect violinplot set_axis_off spines text hatch plt axis plt.bar() plt.axis import figure pyplot highlight_text pypalettes plt.subplots() xlabel ylabel title legend colorbar savefig tight_layout grid set_xlim set_ylim plot scatter hist boxplot imshow cmap alpha bins tick_params annotate quiver contour barh stackplot subplots_adjust axhline axvline semilogx semilogy loglog polar streamplot hexbin pcolor tricontour errorbar clabel set_aspect violinplot set_axis_off spines text hatch plt axis plt.bar() plt.axis import figure pyplot highlight_text pypalettes plt.subplots() xlabel ylabel title legend colorbar savefig tight_layout grid set_xlim set_ylim plot scatter hist boxplot imshow cmap alpha bins tick_params annotate quiver contour barh stackplot subplots_adjust axhline axvline semilogx semilogy loglog polar streamplot hexbin pcolor tricontour errorbar clabel set_aspect violinplot set_axis_off spines text hatch plt axis plt.bar() plt.axis import figure pyplot highlight_text pypalettes plt.subplots() xlabel ylabel title legend colorbar savefig tight_layout grid set_xlim set_ylim plot scatter hist boxplot imshow cmap alpha bins tick_params annotate quiver contour barh stackplot subplots_adjust axhline axvline semilogx semilogy loglog polar streamplot hexbin pcolor tricontour errorbar clabel set_aspect violinplot set_axis_off spines text hatch plt axis plt.bar() plt.axis import figure pyplot highlight_text pypalettes plt.subplots() xlabel ylabel title legend colorbar savefig tight_layout grid set_xlim set_ylim plot scatter hist boxplot imshow cmap alpha bins tick_params annotate quiver contour barh stackplot subplots_adjust axhline axvline semilogx semilogy loglog polar streamplot hexbin pcolor tricontour errorbar clabel set_aspect violinplot set_axis_off spines text hatch plt axis plt.bar() plt.axis import figure pyplot highlight_text pypalettes plt.subplots() xlabel ylabel title legend colorbar savefig tight_layout grid set_xlim set_ylim plot scatter hist boxplot imshow cmap alpha bins tick_params annotate quiver contour barh stackplot subplots_adjust axhline axvline semilogx semilogy loglog polar streamplot hexbin pcolor tricontour errorbar clabel set_aspect violinplot set_axis_off spines text hatch plt axis plt.bar() plt.axis import figure pyplot highlight_text pypalettes plt.subplots() xlabel ylabel title legend colorbar savefig tight_layout grid set_xlim set_ylim plot scatter hist boxplot imshow cmap alpha bins tick_params annotate quiver contour barh stackplot subplots_adjust axhline axvline semilogx semilogy loglog polar streamplot hexbin pcolor tricontour errorbar clabel set_aspect violinplot set_axis_off spines text hatch plt axis plt.bar() plt.axis import figure pyplot highlight_text pypalettes plt.subplots() xlabel ylabel title legend colorbar savefig tight_layout grid set_xlim set_ylim plot scatter hist boxplot imshow cmap alpha bins tick_params annotate quiver contour barh stackplot subplots_adjust axhline axvline semilogx semilogy loglog polar streamplot hexbin pcolor tricontour errorbar clabel set_aspect violinplot set_axis_off spines text hatch plt axis plt.bar() plt.axis import figure pyplot highlight_text pypalettes plt.subplots() xlabel ylabel title legend colorbar savefig tight_layout grid set_xlim set_ylim plot scatter hist boxplot imshow cmap alpha bins tick_params annotate quiver contour barh stackplot subplots_adjust axhline axvline semilogx semilogy loglog polar streamplot hexbin pcolor tricontour errorbar clabel set_aspect violinplot set_axis_off spines text hatch plt axis plt.bar() plt.axis import figure pyplot highlight_text pypalettes plt.subplots() xlabel ylabel title legend colorbar savefig tight_layout grid set_xlim set_ylim plot scatter hist boxplot imshow cmap alpha bins tick_params annotate quiver contour barh stackplot subplots_adjust axhline axvline semilogx semilogy loglog polar streamplot hexbin pcolor tricontour errorbar clabel set_aspect violinplot set_axis_off spines text hatch plt axis plt.bar() plt.axis import figure pyplot highlight_text pypalettes plt.subplots() xlabel ylabel title legend colorbar savefig tight_layout grid set_xlim set_ylim plot scatter hist boxplot imshow cmap alpha bins tick_params annotate quiver contour barh stackplot subplots_adjust axhline axvline semilogx semilogy loglog polar streamplot hexbin pcolor tricontour errorbar clabel set_aspect violinplot set_axis_off spines text hatch plt axis plt.bar() plt.axis import figure pyplot highlight_text pypalettes plt.subplots() xlabel ylabel title legend colorbar savefig tight_layout grid set_xlim set_ylim plot scatter hist boxplot imshow cmap alpha bins tick_params annotate quiver contour barh stackplot subplots_adjust axhline axvline semilogx semilogy loglog polar streamplot hexbin pcolor tricontour errorbar clabel set_aspect violinplot set_axis_off spines text hatch plt axis plt.bar() plt.axis import figure pyplot highlight_text pypalettes plt.subplots() xlabel ylabel title legend colorbar savefig tight_layout grid set_xlim set_ylim plot scatter hist boxplot imshow cmap alpha bins tick_params annotate quiver contour barh stackplot subplots_adjust axhline axvline semilogx semilogy loglog polar streamplot hexbin pcolor tricontour errorbar clabel set_aspect violinplot set_axis_off spines text hatch plt axis plt.bar() plt.axis import figure pyplot highlight_text pypalettes plt.subplots() xlabel ylabel title legend colorbar savefig tight_layout grid set_xlim set_ylim plot scatter hist boxplot imshow cmap alpha bins tick_params annotate quiver contour barh stackplot subplots_adjust axhline axvline semilogx semilogy loglog polar streamplot hexbin pcolor tricontour errorbar clabel set_aspect violinplot set_axis_off spines text hatch plt axis plt.bar() plt.axis import figure pyplot highlight_text pypalettes plt.subplots() xlabel ylabel title legend colorbar savefig tight_layout grid set_xlim set_ylim plot scatter hist boxplot imshow cmap alpha bins tick_params annotate quiver contour barh stackplot subplots_adjust axhline axvline semilogx semilogy loglog polar streamplot hexbin pcolor tricontour errorbar clabel set_aspect violinplot set_axis_off spines text hatch plt axis plt.bar() plt.axis import figure pyplot highlight_text pypalettes plt.subplots() xlabel ylabel title legend colorbar savefig tight_layout grid set_xlim set_ylim plot scatter hist boxplot imshow cmap alpha bins tick_params annotate quiver contour barh stackplot subplots_adjust axhline axvline semilogx semilogy loglog polar streamplot hexbin pcolor tricontour errorbar clabel set_aspect violinplot set_axis_off spines text hatch plt axis plt.bar() plt.axis import figure pyplot highlight_text pypalettes plt.subplots() xlabel ylabel title legend colorbar savefig tight_layout grid set_xlim set_ylim plot scatter hist boxplot imshow cmap alpha bins tick_params annotate quiver contour barh stackplot subplots_adjust axhline axvline semilogx semilogy loglog polar streamplot hexbin pcolor tricontour errorbar clabel set_aspect violinplot set_axis_off spines text hatch plt axis plt.bar() plt.axis import figure pyplot highlight_text pypalettes plt.subplots() xlabel ylabel title legend colorbar savefig tight_layout grid set_xlim set_ylim plot scatter hist boxplot imshow cmap alpha bins tick_params annotate quiver contour barh stackplot subplots_adjust axhline axvline semilogx semilogy loglog polar streamplot hexbin pcolor tricontour errorbar clabel set_aspect violinplot set_axis_off spines text hatch plt axis plt.bar() plt.axis import figure pyplot highlight_text pypalettes plt.subplots() xlabel ylabel title legend colorbar savefig tight_layout grid set_xlim set_ylim plot scatter hist boxplot imshow cmap alpha bins tick_params annotate quiver contour barh stackplot subplots_adjust axhline axvline semilogx semilogy loglog polar streamplot hexbin pcolor tricontour errorbar clabel set_aspect violinplot set_axis_off spines text hatch plt axis plt.bar() plt.axis import figure pyplot highlight_text pypalettes plt.subplots() xlabel ylabel title legend colorbar savefig tight_layout grid set_xlim set_ylim plot scatter hist boxplot imshow cmap alpha bins tick_params annotate quiver contour barh stackplot subplots_adjust axhline axvline semilogx semilogy loglog polar streamplot hexbin pcolor tricontour errorbar clabel set_aspect violinplot set_axis_off spines text hatch plt axis plt.bar() plt.axis import figure pyplot highlight_text pypalettes plt.subplots() xlabel ylabel title legend colorbar savefig tight_layout grid set_xlim set_ylim plot scatter hist boxplot imshow cmap alpha bins tick_params annotate quiver contour barh stackplot subplots_adjust axhline axvline semilogx semilogy loglog polar streamplot hexbin pcolor tricontour errorbar clabel set_aspect violinplot set_axis_off spines text hatch plt axis plt.bar() plt.axis import figure pyplot highlight_text pypalettes plt.subplots() xlabel ylabel title legend colorbar savefig tight_layout grid set_xlim set_ylim plot scatter hist boxplot imshow cmap alpha bins tick_params annotate quiver contour barh stackplot subplots_adjust axhline axvline semilogx semilogy loglog polar streamplot hexbin pcolor tricontour errorbar clabel set_aspect violinplot set_axis_off spines text hatch plt axis plt.bar() plt.axis import figure pyplot highlight_text pypalettes plt.subplots() xlabel ylabel title legend colorbar savefig tight_layout grid set_xlim set_ylim plot scatter hist boxplot imshow cmap alpha bins tick_params annotate quiver contour barh stackplot subplots_adjust axhline axvline semilogx semilogy loglog polar streamplot hexbin pcolor tricontour errorbar clabel set_aspect violinplot set_axis_off spines text hatch plt axis plt.bar() plt.axis import figure pyplot highlight_text pypalettes plt.subplots() xlabel ylabel title legend colorbar savefig tight_layout grid set_xlim set_ylim plot scatter hist boxplot imshow cmap alpha bins tick_params annotate quiver contour barh stackplot subplots_adjust axhline axvline semilogx semilogy loglog polar streamplot hexbin pcolor tricontour errorbar clabel set_aspect violinplot set_axis_off spines text hatch plt axis plt.bar() plt.axis import figure pyplot highlight_text pypalettes plt.subplots() xlabel ylabel title legend colorbar savefig tight_layout grid set_xlim set_ylim plot scatter hist boxplot imshow cmap alpha bins tick_params annotate quiver contour barh stackplot subplots_adjust axhline axvline semilogx semilogy loglog polar streamplot hexbin pcolor tricontour errorbar clabel set_aspect violinplot set_axis_off spines text hatch plt axis plt.bar() plt.axis import figure pyplot highlight_text pypalettes plt.subplots() xlabel ylabel title legend colorbar savefig tight_layout grid set_xlim set_ylim plot scatter hist boxplot imshow cmap alpha bins tick_params annotate quiver contour barh stackplot subplots_adjust axhline axvline semilogx semilogy loglog polar streamplot hexbin pcolor tricontour errorbar clabel set_aspect violinplot set_axis_off spines text hatch plt axis plt.bar() plt.axis import figure pyplot highlight_text pypalettes plt.subplots() xlabel ylabel title legend colorbar savefig tight_layout grid set_xlim set_ylim plot scatter hist boxplot imshow cmap alpha bins tick_params annotate quiver contour barh stackplot subplots_adjust axhline axvline semilogx semilogy loglog polar streamplot hexbin pcolor tricontour errorbar clabel set_aspect violinplot set_axis_off spines text hatch plt axis plt.bar() plt.axis import figure pyplot highlight_text pypalettes plt.subplots() xlabel ylabel title legend colorbar savefig tight_layout grid set_xlim set_ylim plot scatter hist boxplot imshow cmap alpha bins tick_params annotate quiver contour barh stackplot subplots_adjust axhline axvline semilogx semilogy loglog polar streamplot hexbin pcolor tricontour errorbar clabel set_aspect violinplot set_axis_off spines text hatch plt axis plt.bar() plt.axis import figure pyplot highlight_text pypalettes plt.subplots() xlabel ylabel title legend colorbar savefig tight_layout grid set_xlim set_ylim plot scatter hist boxplot imshow cmap alpha bins tick_params annotate quiver contour barh stackplot subplots_adjust axhline axvline semilogx semilogy loglog polar streamplot hexbin pcolor tricontour errorbar clabel set_aspect violinplot set_axis_off spines text hatch plt axis plt.bar() plt.axis import figure pyplot highlight_text pypalettes plt.subplots() xlabel ylabel title legend colorbar savefig tight_layout grid set_xlim set_ylim plot scatter hist boxplot imshow cmap alpha bins tick_params annotate quiver contour barh stackplot subplots_adjust axhline axvline semilogx semilogy loglog polar streamplot hexbin pcolor tricontour errorbar clabel set_aspect violinplot set_axis_off spines text hatch plt axis plt.bar() plt.axis import figure pyplot highlight_text pypalettes plt.subplots() xlabel ylabel title legend colorbar savefig tight_layout grid set_xlim set_ylim plot scatter hist boxplot imshow cmap alpha bins tick_params annotate quiver contour barh stackplot subplots_adjust axhline axvline semilogx semilogy loglog polar streamplot hexbin pcolor tricontour errorbar clabel set_aspect violinplot set_axis_off spines text hatch plt axis plt.bar() plt.axis import figure pyplot highlight_text pypalettes plt.subplots() xlabel ylabel title legend colorbar savefig tight_layout grid set_xlim set_ylim plot scatter hist boxplot imshow cmap alpha bins tick_params annotate quiver contour barh stackplot subplots_adjust axhline axvline semilogx semilogy loglog polar streamplot hexbin pcolor tricontour errorbar clabel set_aspect violinplot set_axis_off spines text hatch plt axis plt.bar() plt.axis import figure pyplot highlight_text pypalettes plt.subplots() xlabel ylabel title legend colorbar savefig tight_layout grid set_xlim set_ylim plot scatter hist boxplot imshow cmap alpha bins tick_params annotate quiver contour barh stackplot subplots_adjust axhline axvline semilogx semilogy loglog polar streamplot hexbin pcolor tricontour errorbar clabel set_aspect violinplot set_axis_off spines text hatch plt axis plt.bar() plt.axis import figure pyplot highlight_text pypalettes plt.subplots() xlabel ylabel title legend colorbar savefig tight_layout grid set_xlim set_ylim plot scatter hist boxplot imshow cmap alpha bins tick_params annotate quiver contour barh stackplot subplots_adjust axhline axvline semilogx semilogy loglog polar streamplot hexbin pcolor tricontour errorbar clabel set_aspect violinplot set_axis_off spines text hatch plt axis plt.bar() plt.axis import figure pyplot highlight_text pypalettes plt.subplots() xlabel ylabel title legend colorbar savefig tight_layout grid set_xlim set_ylim plot scatter hist boxplot imshow cmap alpha bins tick_params annotate quiver contour barh stackplot subplots_adjust axhline axvline semilogx semilogy loglog polar streamplot hexbin pcolor tricontour errorbar clabel set_aspect violinplot set_axis_off spines text hatch plt axis plt.bar() plt.axis import figure pyplot highlight_text pypalettes plt.subplots() xlabel ylabel title legend colorbar savefig tight_layout grid set_xlim set_ylim plot scatter hist boxplot imshow cmap alpha bins tick_params annotate quiver contour barh stackplot subplots_adjust axhline axvline semilogx semilogy loglog polar streamplot hexbin pcolor tricontour errorbar clabel set_aspect violinplot set_axis_off spines text hatch plt axis plt.bar() plt.axis import figure pyplot highlight_text pypalettes plt.subplots() xlabel ylabel title legend colorbar savefig tight_layout grid set_xlim set_ylim plot scatter hist boxplot imshow cmap alpha bins tick_params annotate quiver contour barh stackplot subplots_adjust axhline axvline semilogx semilogy loglog polar streamplot hexbin pcolor tricontour errorbar clabel set_aspect violinplot set_axis_off spines text hatch plt axis plt.bar() plt.axis import figure pyplot highlight_text pypalettes plt.subplots() xlabel ylabel title legend colorbar savefig tight_layout grid set_xlim set_ylim plot scatter hist boxplot imshow cmap alpha bins tick_params annotate quiver contour barh stackplot subplots_adjust axhline axvline semilogx semilogy loglog polar streamplot hexbin pcolor tricontour errorbar clabel set_aspect violinplot set_axis_off spines text hatch plt axis plt.bar() plt.axis import figure pyplot highlight_text pypalettes plt.subplots() xlabel ylabel title legend colorbar savefig tight_layout grid set_xlim set_ylim plot scatter hist boxplot imshow cmap alpha bins tick_params annotate quiver contour barh stackplot subplots_adjust axhline axvline semilogx semilogy loglog polar streamplot hexbin pcolor tricontour errorbar clabel set_aspect violinplot set_axis_off spines text hatch plt axis plt.bar() plt.axis import figure pyplot highlight_text pypalettes plt.subplots() xlabel ylabel title legend colorbar savefig tight_layout grid set_xlim set_ylim plot scatter hist boxplot imshow cmap alpha bins tick_params annotate quiver contour barh stackplot subplots_adjust axhline axvline semilogx semilogy loglog polar streamplot hexbin pcolor tricontour errorbar clabel set_aspect violinplot set_axis_off spines text hatch plt axis plt.bar() plt.axis import figure pyplot highlight_text pypalettes plt.subplots() xlabel ylabel title legend colorbar savefig tight_layout grid set_xlim set_ylim plot scatter hist boxplot imshow cmap alpha bins tick_params annotate quiver contour barh stackplot subplots_adjust axhline axvline semilogx semilogy loglog polar streamplot hexbin pcolor tricontour errorbar clabel set_aspect violinplot set_axis_off spines text hatch plt axis plt.bar() plt.axis import figure pyplot highlight_text pypalettes plt.subplots() xlabel ylabel title legend colorbar savefig tight_layout grid set_xlim set_ylim plot scatter hist boxplot imshow cmap alpha bins tick_params annotate quiver contour barh stackplot subplots_adjust axhline axvline semilogx semilogy loglog polar streamplot hexbin pcolor tricontour errorbar clabel set_aspect violinplot set_axis_off spines text hatch plt axis plt.bar() plt.axis import figure pyplot highlight_text pypalettes plt.subplots() xlabel ylabel title legend colorbar savefig tight_layout grid set_xlim set_ylim plot scatter hist boxplot imshow cmap alpha bins tick_params annotate quiver contour barh stackplot subplots_adjust axhline axvline semilogx semilogy loglog polar streamplot hexbin pcolor tricontour errorbar clabel set_aspect violinplot set_axis_off spines text hatch plt axis plt.bar() plt.axis import figure pyplot highlight_text pypalettes plt.subplots() xlabel ylabel title legend colorbar savefig tight_layout grid set_xlim set_ylim plot scatter hist boxplot imshow cmap alpha bins tick_params annotate quiver contour barh stackplot subplots_adjust axhline axvline semilogx semilogy loglog polar streamplot hexbin pcolor tricontour errorbar clabel set_aspect violinplot set_axis_off spines text hatch plt axis plt.bar() plt.axis import figure pyplot highlight_text pypalettes plt.subplots() xlabel ylabel title legend colorbar savefig tight_layout grid set_xlim set_ylim plot scatter hist boxplot imshow cmap alpha bins tick_params annotate quiver contour barh stackplot subplots_adjust axhline axvline semilogx semilogy loglog polar streamplot hexbin pcolor tricontour errorbar clabel set_aspect violinplot set_axis_off spines text hatch plt axis plt.bar() plt.axis import figure pyplot highlight_text pypalettes plt.subplots() xlabel ylabel title legend colorbar savefig tight_layout grid set_xlim set_ylim plot scatter hist boxplot imshow cmap alpha bins tick_params annotate quiver contour barh stackplot subplots_adjust axhline axvline semilogx semilogy loglog polar streamplot hexbin pcolor tricontour errorbar clabel set_aspect violinplot set_axis_off spines text hatch plt axis plt.bar() plt.axis import figure pyplot highlight_text pypalettes plt.subplots() xlabel ylabel title legend colorbar savefig tight_layout grid set_xlim set_ylim plot scatter hist boxplot imshow cmap alpha bins tick_params annotate quiver contour barh stackplot subplots_adjust axhline axvline semilogx semilogy loglog polar streamplot hexbin pcolor tricontour errorbar clabel set_aspect violinplot set_axis_off spines text hatch plt axis plt.bar() plt.axis import figure pyplot highlight_text pypalettes plt.subplots() xlabel ylabel title legend colorbar savefig tight_layout grid set_xlim set_ylim plot scatter hist boxplot imshow cmap alpha bins tick_params annotate quiver contour barh stackplot subplots_adjust axhline axvline semilogx semilogy loglog polar streamplot hexbin pcolor tricontour errorbar clabel set_aspect violinplot set_axis_off spines text hatch plt axis plt.bar() plt.axis import figure pyplot highlight_text pypalettes plt.subplots() xlabel ylabel title legend colorbar savefig tight_layout grid set_xlim set_ylim plot scatter hist boxplot imshow cmap alpha bins tick_params annotate quiver contour barh stackplot subplots_adjust axhline axvline semilogx semilogy loglog polar streamplot hexbin pcolor tricontour errorbar clabel set_aspect violinplot set_axis_off spines text hatch plt axis plt.bar() plt.axis import figure pyplot highlight_text pypalettes plt.subplots() xlabel ylabel title legend colorbar savefig tight_layout grid set_xlim set_ylim plot scatter hist boxplot imshow cmap alpha bins tick_params annotate quiver contour barh stackplot subplots_adjust axhline axvline semilogx semilogy loglog polar streamplot hexbin pcolor tricontour errorbar clabel set_aspect violinplot set_axis_off spines text hatch plt axis plt.bar() plt.axis import figure pyplot highlight_text pypalettes plt.subplots() xlabel ylabel title legend colorbar savefig tight_layout grid set_xlim set_ylim plot scatter hist boxplot imshow cmap alpha bins tick_params annotate quiver contour barh stackplot subplots_adjust axhline axvline semilogx semilogy loglog polar streamplot hexbin pcolor tricontour errorbar clabel set_aspect violinplot set_axis_off spines text hatch plt axis plt.bar() plt.axis import figure pyplot highlight_text pypalettes plt.subplots() xlabel ylabel title legend colorbar savefig tight_layout grid set_xlim set_ylim plot scatter hist boxplot imshow cmap alpha bins tick_params annotate quiver contour barh stackplot subplots_adjust axhline axvline semilogx semilogy loglog polar streamplot hexbin pcolor tricontour errorbar clabel set_aspect violinplot set_axis_off spines text hatch plt axis plt.bar() plt.axis import figure pyplot highlight_text pypalettes plt.subplots() xlabel ylabel title legend colorbar savefig tight_layout grid set_xlim set_ylim plot scatter hist boxplot imshow cmap alpha bins tick_params annotate quiver contour barh stackplot subplots_adjust axhline axvline semilogx semilogy loglog polar streamplot hexbin pcolor tricontour errorbar clabel set_aspect violinplot set_axis_off spines text hatch plt axis plt.bar() plt.axis import figure pyplot highlight_text pypalettes plt.subplots() xlabel ylabel title legend colorbar savefig tight_layout grid set_xlim set_ylim plot scatter hist boxplot imshow cmap alpha bins tick_params annotate quiver contour barh stackplot subplots_adjust axhline axvline semilogx semilogy loglog polar streamplot hexbin pcolor tricontour errorbar clabel set_aspect violinplot set_axis_off spines text hatch plt axis plt.bar() plt.axis import figure pyplot highlight_text pypalettes plt.subplots() xlabel ylabel title legend colorbar savefig tight_layout grid set_xlim set_ylim plot scatter hist boxplot imshow cmap alpha bins tick_params annotate quiver contour barh stackplot subplots_adjust axhline axvline semilogx semilogy loglog polar streamplot hexbin pcolor tricontour errorbar clabel set_aspect violinplot set_axis_off spines text hatch plt axis plt.bar() plt.axis import figure pyplot highlight_text pypalettes plt.subplots() xlabel ylabel title legend colorbar savefig tight_layout grid set_xlim set_ylim plot scatter hist boxplot imshow cmap alpha bins tick_params annotate quiver contour barh stackplot subplots_adjust axhline axvline semilogx semilogy loglog polar streamplot hexbin pcolor tricontour errorbar clabel set_aspect violinplot set_axis_off spines text hatch plt axis plt.bar() plt.axis import figure pyplot highlight_text pypalettes plt.subplots() xlabel ylabel title legend colorbar savefig tight_layout grid set_xlim set_ylim plot scatter hist boxplot imshow cmap alpha bins tick_params annotate quiver contour barh stackplot subplots_adjust axhline axvline semilogx semilogy loglog polar streamplot hexbin pcolor tricontour errorbar clabel set_aspect violinplot set_axis_off spines text hatch plt axis plt.bar() plt.axis import figure pyplot highlight_text pypalettes plt.subplots() xlabel ylabel title legend colorbar savefig tight_layout grid set_xlim set_ylim plot scatter hist boxplot imshow cmap alpha bins tick_params annotate quiver contour barh stackplot subplots_adjust axhline axvline semilogx semilogy loglog polar streamplot hexbin pcolor tricontour errorbar clabel set_aspect violinplot set_axis_off spines text hatch plt axis plt.bar() plt.axis import figure pyplot highlight_text pypalettes plt.subplots() xlabel ylabel title legend colorbar savefig tight_layout grid set_xlim set_ylim plot scatter hist boxplot imshow cmap alpha bins tick_params annotate quiver contour barh stackplot subplots_adjust axhline axvline semilogx semilogy loglog polar streamplot hexbin pcolor tricontour errorbar clabel set_aspect violinplot set_axis_off spines text hatch plt axis plt.bar() plt.axis import figure pyplot highlight_text pypalettes plt.subplots() xlabel ylabel title legend colorbar savefig tight_layout grid set_xlim set_ylim plot scatter hist boxplot imshow cmap alpha bins tick_params annotate quiver contour barh stackplot subplots_adjust axhline axvline semilogx semilogy loglog polar streamplot hexbin pcolor tricontour errorbar clabel set_aspect violinplot set_axis_off spines text hatch plt axis plt.bar() plt.axis import figure pyplot highlight_text pypalettes plt.subplots() xlabel ylabel title legend colorbar savefig tight_layout grid set_xlim set_ylim plot scatter hist boxplot imshow cmap alpha bins tick_params annotate quiver contour barh stackplot subplots_adjust axhline axvline semilogx semilogy loglog polar streamplot hexbin pcolor tricontour errorbar clabel set_aspect violinplot set_axis_off spines text hatch plt axis plt.bar() plt.axis import figure pyplot highlight_text pypalettes plt.subplots() xlabel ylabel title legend colorbar savefig tight_layout grid set_xlim set_ylim plot scatter hist boxplot imshow cmap alpha bins tick_params annotate quiver contour barh stackplot subplots_adjust axhline axvline semilogx semilogy loglog polar streamplot hexbin pcolor tricontour errorbar clabel set_aspect violinplot set_axis_off spines text hatch plt axis plt.bar() plt.axis import figure pyplot highlight_text pypalettes plt.subplots() xlabel ylabel title legend colorbar savefig tight_layout grid set_xlim set_ylim plot scatter hist boxplot imshow cmap alpha bins tick_params annotate quiver contour barh stackplot subplots_adjust axhline axvline semilogx semilogy loglog polar streamplot hexbin pcolor tricontour errorbar clabel set_aspect violinplot set_axis_off spines text hatch plt axis plt.bar() plt.axis import figure pyplot highlight_text pypalettes plt.subplots() xlabel ylabel title legend colorbar savefig tight_layout grid set_xlim set_ylim plot scatter hist boxplot imshow cmap alpha bins tick_params annotate quiver contour barh stackplot subplots_adjust axhline axvline semilogx semilogy loglog polar streamplot hexbin pcolor tricontour errorbar clabel set_aspect violinplot set_axis_off spines text hatch plt axis plt.bar() plt.axis import figure pyplot highlight_text pypalettes plt.subplots() xlabel ylabel title legend colorbar savefig tight_layout grid set_xlim set_ylim plot scatter hist boxplot imshow cmap alpha bins tick_params annotate quiver contour barh stackplot subplots_adjust axhline axvline semilogx semilogy loglog polar streamplot hexbin pcolor tricontour errorbar clabel set_aspect violinplot set_axis_off spines text hatch plt axis plt.bar() plt.axis import figure pyplot highlight_text pypalettes plt.subplots() xlabel ylabel title legend colorbar savefig tight_layout grid set_xlim set_ylim plot scatter hist boxplot imshow cmap alpha bins tick_params annotate quiver contour barh stackplot subplots_adjust axhline axvline semilogx semilogy loglog polar streamplot hexbin pcolor tricontour errorbar clabel set_aspect violinplot set_axis_off spines text hatch plt axis plt.bar() plt.axis import figure pyplot highlight_text pypalettes plt.subplots() xlabel ylabel title legend colorbar savefig tight_layout grid set_xlim set_ylim plot scatter hist boxplot imshow cmap alpha bins tick_params annotate quiver contour barh stackplot subplots_adjust axhline axvline semilogx semilogy loglog polar streamplot hexbin pcolor tricontour errorbar clabel set_aspect violinplot set_axis_off spines text hatch plt axis plt.bar() plt.axis import figure pyplot highlight_text pypalettes plt.subplots() xlabel ylabel title legend colorbar savefig tight_layout grid set_xlim set_ylim plot scatter hist boxplot imshow cmap alpha bins tick_params annotate quiver contour barh stackplot subplots_adjust axhline axvline semilogx semilogy loglog polar streamplot hexbin pcolor tricontour errorbar clabel set_aspect violinplot set_axis_off spines text hatch plt axis plt.bar() plt.axis import figure pyplot highlight_text pypalettes plt.subplots() xlabel ylabel title legend colorbar savefig tight_layout grid set_xlim set_ylim plot scatter hist boxplot imshow cmap alpha bins tick_params annotate quiver contour barh stackplot subplots_adjust axhline axvline semilogx semilogy loglog polar streamplot hexbin pcolor tricontour errorbar clabel set_aspect violinplot set_axis_off spines text hatch plt axis plt.bar() plt.axis import figure pyplot highlight_text pypalettes plt.subplots() xlabel ylabel title legend colorbar savefig tight_layout grid set_xlim set_ylim plot scatter hist boxplot imshow cmap alpha bins tick_params annotate quiver contour barh stackplot subplots_adjust axhline axvline semilogx semilogy loglog polar streamplot hexbin pcolor tricontour errorbar clabel set_aspect violinplot set_axis_off spines text hatch plt axis plt.bar() plt.axis import figure pyplot highlight_text pypalettes plt.subplots() xlabel ylabel title legend colorbar savefig tight_layout grid set_xlim set_ylim plot scatter hist boxplot imshow cmap alpha bins tick_params annotate quiver contour barh stackplot subplots_adjust axhline axvline semilogx semilogy loglog polar streamplot hexbin pcolor tricontour errorbar clabel set_aspect violinplot set_axis_off spines text hatch plt axis plt.bar() plt.axis import figure pyplot highlight_text pypalettes plt.subplots() xlabel ylabel title legend colorbar savefig tight_layout grid set_xlim set_ylim plot scatter hist boxplot imshow cmap alpha bins tick_params annotate quiver contour barh stackplot subplots_adjust axhline axvline semilogx semilogy loglog polar streamplot hexbin pcolor tricontour errorbar clabel set_aspect violinplot set_axis_off spines text hatch plt axis plt.bar() plt.axis import figure pyplot highlight_text pypalettes plt.subplots() xlabel ylabel title legend colorbar savefig tight_layout grid set_xlim set_ylim plot scatter hist boxplot imshow cmap alpha bins tick_params annotate quiver contour barh stackplot subplots_adjust axhline axvline semilogx semilogy loglog polar streamplot hexbin pcolor tricontour errorbar clabel set_aspect violinplot set_axis_off spines text hatch plt axis plt.bar() plt.axis import figure pyplot highlight_text pypalettes plt.subplots() xlabel ylabel title legend colorbar savefig tight_layout grid set_xlim set_ylim plot scatter hist boxplot imshow cmap alpha bins tick_params annotate quiver contour barh stackplot subplots_adjust axhline axvline semilogx semilogy loglog polar streamplot hexbin pcolor tricontour errorbar clabel set_aspect violinplot set_axis_off spines text hatch plt axis plt.bar() plt.axis import figure pyplot highlight_text pypalettes plt.subplots() xlabel ylabel title legend colorbar savefig tight_layout grid set_xlim set_ylim plot scatter hist boxplot imshow cmap alpha bins tick_params annotate quiver contour barh stackplot subplots_adjust axhline axvline semilogx semilogy loglog polar streamplot hexbin pcolor tricontour errorbar clabel set_aspect violinplot set_axis_off spines text hatch plt axis plt.bar() plt.axis import figure pyplot highlight_text pypalettes plt.subplots() xlabel ylabel title legend colorbar savefig tight_layout grid set_xlim set_ylim plot scatter hist boxplot imshow cmap alpha bins tick_params annotate quiver contour barh stackplot subplots_adjust axhline axvline semilogx semilogy loglog polar streamplot hexbin pcolor tricontour errorbar clabel set_aspect violinplot set_axis_off spines text hatch plt axis plt.bar() plt.axis import figure pyplot highlight_text pypalettes plt.subplots() xlabel ylabel title legend colorbar savefig tight_layout grid set_xlim set_ylim plot scatter hist boxplot imshow cmap alpha bins tick_params annotate quiver contour barh stackplot subplots_adjust axhline axvline semilogx semilogy loglog polar streamplot hexbin pcolor tricontour errorbar clabel set_aspect violinplot set_axis_off spines text hatch plt axis plt.bar() plt.axis import figure pyplot highlight_text pypalettes plt.subplots() xlabel ylabel title legend colorbar savefig tight_layout grid set_xlim set_ylim plot scatter hist boxplot imshow cmap alpha bins tick_params annotate quiver contour barh stackplot subplots_adjust axhline axvline semilogx semilogy loglog polar streamplot hexbin pcolor tricontour errorbar clabel set_aspect violinplot set_axis_off spines text hatch plt axis plt.bar() plt.axis import figure pyplot highlight_text pypalettes plt.subplots() xlabel ylabel title legend colorbar savefig tight_layout grid set_xlim set_ylim plot scatter hist boxplot imshow cmap alpha bins tick_params annotate quiver contour barh stackplot subplots_adjust axhline axvline semilogx semilogy loglog polar streamplot hexbin pcolor tricontour errorbar clabel set_aspect violinplot set_axis_off spines text hatch plt axis plt.bar() plt.axis import figure pyplot highlight_text pypalettes plt.subplots() xlabel ylabel title legend colorbar savefig tight_layout grid set_xlim set_ylim plot scatter hist boxplot imshow cmap alpha bins tick_params annotate quiver contour barh stackplot subplots_adjust axhline axvline semilogx semilogy loglog polar streamplot hexbin pcolor tricontour errorbar clabel set_aspect violinplot set_axis_off spines text hatch plt axis plt.bar() plt.axis import figure pyplot highlight_text pypalettes plt.subplots() xlabel ylabel title legend colorbar savefig tight_layout grid set_xlim set_ylim plot scatter hist boxplot imshow cmap alpha bins tick_params annotate quiver contour barh stackplot subplots_adjust axhline axvline semilogx semilogy loglog polar streamplot hexbin pcolor tricontour errorbar clabel set_aspect violinplot set_axis_off spines text hatch plt axis plt.bar() plt.axis import figure pyplot highlight_text pypalettes plt.subplots() xlabel ylabel title legend colorbar savefig tight_layout grid set_xlim set_ylim plot scatter hist boxplot imshow cmap alpha bins tick_params annotate quiver contour barh stackplot subplots_adjust axhline axvline semilogx semilogy loglog polar streamplot hexbin pcolor tricontour errorbar clabel set_aspect violinplot set_axis_off spines text hatch plt axis plt.bar() plt.axis import figure pyplot highlight_text pypalettes plt.subplots() xlabel ylabel title legend colorbar savefig tight_layout grid set_xlim set_ylim plot scatter hist boxplot imshow cmap alpha bins tick_params annotate quiver contour barh stackplot subplots_adjust axhline axvline semilogx semilogy loglog polar streamplot hexbin pcolor tricontour errorbar clabel set_aspect violinplot set_axis_off spines text hatch plt axis plt.bar() plt.axis import figure pyplot highlight_text pypalettes plt.subplots() xlabel ylabel title legend colorbar savefig tight_layout grid set_xlim set_ylim plot scatter hist boxplot imshow cmap alpha bins tick_params annotate quiver contour barh stackplot subplots_adjust axhline axvline semilogx semilogy loglog polar streamplot hexbin pcolor tricontour errorbar clabel set_aspect violinplot set_axis_off spines text hatch plt axis plt.bar() plt.axis import figure pyplot highlight_text pypalettes plt.subplots() xlabel ylabel title legend colorbar savefig tight_layout grid set_xlim set_ylim plot scatter hist boxplot imshow cmap alpha bins tick_params annotate quiver contour barh stackplot subplots_adjust axhline axvline semilogx semilogy loglog polar streamplot hexbin pcolor tricontour errorbar clabel set_aspect violinplot set_axis_off spines text hatch plt axis plt.bar() plt.axis import figure pyplot highlight_text pypalettes plt.subplots() xlabel ylabel title legend colorbar savefig tight_layout grid set_xlim set_ylim plot scatter hist boxplot imshow cmap alpha bins tick_params annotate quiver contour barh stackplot subplots_adjust axhline axvline semilogx semilogy loglog polar streamplot hexbin pcolor tricontour errorbar clabel set_aspect violinplot set_axis_off spines text hatch plt axis plt.bar() plt.axis import figure pyplot highlight_text pypalettes plt.subplots() xlabel ylabel title legend colorbar savefig tight_layout grid set_xlim set_ylim plot scatter hist boxplot imshow cmap alpha bins tick_params annotate quiver contour barh stackplot subplots_adjust axhline axvline semilogx semilogy loglog polar streamplot hexbin pcolor tricontour errorbar clabel set_aspect violinplot set_axis_off spines text hatch plt axis plt.bar() plt.axis import figure pyplot highlight_text pypalettes plt.subplots() xlabel ylabel title legend colorbar savefig tight_layout grid set_xlim set_ylim plot scatter hist boxplot imshow cmap alpha bins tick_params annotate quiver contour barh stackplot subplots_adjust axhline axvline semilogx semilogy loglog polar streamplot hexbin pcolor tricontour errorbar clabel set_aspect violinplot set_axis_off spines text hatch plt axis plt.bar() plt.axis import figure pyplot highlight_text pypalettes plt.subplots() xlabel ylabel title legend colorbar savefig tight_layout grid set_xlim set_ylim plot scatter hist boxplot imshow cmap alpha bins tick_params annotate quiver contour barh stackplot subplots_adjust axhline axvline semilogx semilogy loglog polar streamplot hexbin pcolor tricontour errorbar clabel set_aspect violinplot set_axis_off spines text hatch plt axis plt.bar() plt.axis import figure pyplot highlight_text pypalettes plt.subplots() xlabel ylabel title legend colorbar savefig tight_layout grid set_xlim set_ylim plot scatter hist boxplot imshow cmap alpha bins tick_params annotate quiver contour barh stackplot subplots_adjust axhline axvline semilogx semilogy loglog polar streamplot hexbin pcolor tricontour errorbar clabel set_aspect violinplot set_axis_off spines text hatch plt axis plt.bar() plt.axis import figure pyplot highlight_text pypalettes plt.subplots() xlabel ylabel title legend colorbar savefig tight_layout grid set_xlim set_ylim plot scatter hist boxplot imshow cmap alpha bins tick_params annotate quiver contour barh stackplot subplots_adjust axhline axvline semilogx semilogy loglog polar streamplot hexbin pcolor tricontour errorbar clabel set_aspect violinplot set_axis_off spines text hatch plt axis plt.bar() plt.axis import figure pyplot highlight_text pypalettes plt.subplots() xlabel ylabel title legend colorbar savefig tight_layout grid set_xlim set_ylim plot scatter hist boxplot imshow cmap alpha bins tick_params annotate quiver contour barh stackplot subplots_adjust axhline axvline semilogx semilogy loglog polar streamplot hexbin pcolor tricontour errorbar clabel set_aspect violinplot set_axis_off spines text hatch plt axis plt.bar() plt.axis import figure pyplot highlight_text pypalettes plt.subplots() xlabel ylabel title legend colorbar savefig tight_layout grid set_xlim set_ylim plot scatter hist boxplot imshow cmap alpha bins tick_params annotate quiver contour barh stackplot subplots_adjust axhline axvline semilogx semilogy loglog polar streamplot hexbin pcolor tricontour errorbar clabel set_aspect violinplot set_axis_off spines text hatch plt axis plt.bar() plt.axis import figure pyplot highlight_text pypalettes plt.subplots() xlabel ylabel title legend colorbar savefig tight_layout grid set_xlim set_ylim plot scatter hist boxplot imshow cmap alpha bins tick_params annotate quiver contour barh stackplot subplots_adjust axhline axvline semilogx semilogy loglog polar streamplot hexbin pcolor tricontour errorbar clabel set_aspect violinplot set_axis_off spines text hatch plt axis plt.bar() plt.axis import figure pyplot highlight_text pypalettes plt.subplots() xlabel ylabel title legend colorbar savefig tight_layout grid set_xlim set_ylim plot scatter hist boxplot imshow cmap alpha bins tick_params annotate quiver contour barh stackplot subplots_adjust axhline axvline semilogx semilogy loglog polar streamplot hexbin pcolor tricontour errorbar clabel set_aspect violinplot set_axis_off spines text hatch plt axis plt.bar() plt.axis import figure pyplot highlight_text pypalettes plt.subplots() xlabel ylabel title legend colorbar savefig tight_layout grid set_xlim set_ylim plot scatter hist boxplot imshow cmap alpha bins tick_params annotate quiver contour barh stackplot subplots_adjust axhline axvline semilogx semilogy loglog polar streamplot hexbin pcolor tricontour errorbar clabel set_aspect violinplot set_axis_off spines text hatch plt axis plt.bar() plt.axis import figure pyplot highlight_text pypalettes plt.subplots() xlabel ylabel title legend colorbar savefig tight_layout grid set_xlim set_ylim plot scatter hist boxplot imshow cmap alpha bins tick_params annotate quiver contour barh stackplot subplots_adjust axhline axvline semilogx semilogy loglog polar streamplot hexbin pcolor tricontour errorbar clabel set_aspect violinplot set_axis_off spines text hatch plt axis plt.bar() plt.axis import figure pyplot highlight_text pypalettes plt.subplots() xlabel ylabel title legend colorbar savefig tight_layout grid set_xlim set_ylim plot scatter hist boxplot imshow cmap alpha bins tick_params annotate quiver contour barh stackplot subplots_adjust axhline axvline semilogx semilogy loglog polar streamplot hexbin pcolor tricontour errorbar clabel set_aspect violinplot set_axis_off spines text hatch plt axis plt.bar() plt.axis import figure pyplot highlight_text pypalettes plt.subplots() xlabel ylabel title legend colorbar savefig tight_layout grid set_xlim set_ylim plot scatter hist boxplot imshow cmap alpha bins tick_params annotate quiver contour barh stackplot subplots_adjust axhline axvline semilogx semilogy loglog polar streamplot hexbin pcolor tricontour errorbar clabel set_aspect violinplot set_axis_off spines text hatch plt axis plt.bar() plt.axis import figure pyplot highlight_text pypalettes plt.subplots() xlabel ylabel title legend colorbar savefig tight_layout grid set_xlim set_ylim plot scatter hist boxplot imshow cmap alpha bins tick_params annotate quiver contour barh stackplot subplots_adjust axhline axvline semilogx semilogy loglog polar streamplot hexbin pcolor tricontour errorbar clabel set_aspect violinplot set_axis_off spines text hatch plt axis plt.bar() plt.axis import figure pyplot highlight_text pypalettes plt.subplots() xlabel ylabel title legend colorbar savefig tight_layout grid set_xlim set_ylim plot scatter hist boxplot imshow cmap alpha bins tick_params annotate quiver contour barh stackplot subplots_adjust axhline axvline semilogx semilogy loglog polar streamplot hexbin pcolor tricontour errorbar clabel set_aspect violinplot set_axis_off spines text hatch plt axis plt.bar() plt.axis import figure pyplot highlight_text pypalettes plt.subplots() xlabel ylabel title legend colorbar savefig tight_layout grid set_xlim set_ylim plot scatter hist boxplot imshow cmap alpha bins tick_params annotate quiver contour barh stackplot subplots_adjust axhline axvline semilogx semilogy loglog polar streamplot hexbin pcolor tricontour errorbar clabel set_aspect violinplot set_axis_off spines text hatch plt axis plt.bar() plt.axis import figure pyplot highlight_text pypalettes plt.subplots() xlabel ylabel title legend colorbar savefig tight_layout grid set_xlim set_ylim plot scatter hist boxplot imshow cmap alpha bins tick_params annotate quiver contour barh stackplot subplots_adjust axhline axvline semilogx semilogy loglog polar streamplot hexbin pcolor tricontour errorbar clabel set_aspect violinplot set_axis_off spines text hatch plt axis plt.bar() plt.axis import figure pyplot highlight_text pypalettes plt.subplots() xlabel ylabel title legend colorbar savefig tight_layout grid set_xlim set_ylim plot scatter hist boxplot imshow cmap alpha bins tick_params annotate quiver contour barh stackplot subplots_adjust axhline axvline semilogx semilogy loglog polar streamplot hexbin pcolor tricontour errorbar clabel set_aspect violinplot set_axis_off spines text hatch plt axis plt.bar() plt.axis import figure pyplot highlight_text pypalettes plt.subplots() xlabel ylabel title legend colorbar savefig tight_layout grid set_xlim set_ylim plot scatter hist boxplot imshow cmap alpha bins tick_params annotate quiver contour barh stackplot subplots_adjust axhline axvline semilogx semilogy loglog polar streamplot hexbin pcolor tricontour errorbar clabel set_aspect violinplot set_axis_off spines text hatch plt axis plt.bar() plt.axis import figure pyplot highlight_text pypalettes plt.subplots() xlabel ylabel title legend colorbar savefig tight_layout grid set_xlim set_ylim plot scatter hist boxplot imshow cmap alpha bins tick_params annotate quiver contour barh stackplot subplots_adjust axhline axvline semilogx semilogy loglog polar streamplot hexbin pcolor tricontour errorbar clabel set_aspect violinplot set_axis_off spines text hatch plt axis plt.bar() plt.axis import figure pyplot highlight_text pypalettes plt.subplots() xlabel ylabel title legend colorbar savefig tight_layout grid set_xlim set_ylim plot scatter hist boxplot imshow cmap alpha bins tick_params annotate quiver contour barh stackplot subplots_adjust axhline axvline semilogx semilogy loglog polar streamplot hexbin pcolor tricontour errorbar clabel set_aspect violinplot set_axis_off spines text hatch plt axis plt.bar() plt.axis import figure pyplot highlight_text pypalettes plt.subplots() xlabel ylabel title legend colorbar savefig tight_layout grid set_xlim set_ylim plot scatter hist boxplot imshow cmap alpha bins tick_params annotate quiver contour barh stackplot subplots_adjust axhline axvline semilogx semilogy loglog polar streamplot hexbin pcolor tricontour errorbar clabel set_aspect violinplot set_axis_off spines text hatch plt axis plt.bar() plt.axis import figure pyplot highlight_text pypalettes plt.subplots() xlabel ylabel title legend colorbar savefig tight_layout grid set_xlim set_ylim plot scatter hist boxplot imshow cmap alpha bins tick_params annotate quiver contour barh stackplot subplots_adjust axhline axvline semilogx semilogy loglog polar streamplot hexbin pcolor tricontour errorbar clabel set_aspect violinplot set_axis_off spines text hatch plt axis plt.bar() plt.axis import figure pyplot highlight_text pypalettes plt.subplots() xlabel ylabel title legend colorbar savefig tight_layout grid set_xlim set_ylim plot scatter hist boxplot imshow cmap alpha bins tick_params annotate quiver contour barh stackplot subplots_adjust axhline axvline semilogx semilogy loglog polar streamplot hexbin pcolor tricontour errorbar clabel set_aspect violinplot set_axis_off spines text hatch plt axis plt.bar() plt.axis import figure pyplot highlight_text pypalettes plt.subplots() xlabel ylabel title legend colorbar savefig tight_layout grid set_xlim set_ylim plot scatter hist boxplot imshow cmap alpha bins tick_params annotate quiver contour barh stackplot subplots_adjust axhline axvline semilogx semilogy loglog polar streamplot hexbin pcolor tricontour errorbar clabel set_aspect violinplot set_axis_off spines text hatch plt axis plt.bar() plt.axis import figure pyplot highlight_text pypalettes plt.subplots() xlabel ylabel title legend colorbar savefig tight_layout grid set_xlim set_ylim plot scatter hist boxplot imshow cmap alpha bins tick_params annotate quiver contour barh stackplot subplots_adjust axhline axvline semilogx semilogy loglog polar streamplot hexbin pcolor tricontour errorbar clabel set_aspect violinplot set_axis_off spines text hatch plt axis plt.bar() plt.axis import figure pyplot highlight_text pypalettes plt.subplots() xlabel ylabel title legend colorbar savefig tight_layout grid set_xlim set_ylim plot scatter hist boxplot imshow cmap alpha bins tick_params annotate quiver contour barh stackplot subplots_adjust axhline axvline semilogx semilogy loglog polar streamplot hexbin pcolor tricontour errorbar clabel set_aspect violinplot set_axis_off spines text hatch plt axis plt.bar() plt.axis import figure pyplot highlight_text pypalettes plt.subplots() xlabel ylabel title legend colorbar savefig tight_layout grid set_xlim set_ylim plot scatter hist boxplot imshow cmap alpha bins tick_params annotate quiver contour barh stackplot subplots_adjust axhline axvline semilogx semilogy loglog polar streamplot hexbin pcolor tricontour errorbar clabel set_aspect violinplot set_axis_off spines text hatch plt axis plt.bar() plt.axis import figure pyplot highlight_text pypalettes plt.subplots() xlabel ylabel title legend colorbar savefig tight_layout grid set_xlim set_ylim plot scatter hist boxplot imshow cmap alpha bins tick_params annotate quiver contour barh stackplot subplots_adjust axhline axvline semilogx semilogy loglog polar streamplot hexbin pcolor tricontour errorbar clabel set_aspect violinplot set_axis_off spines text hatch plt axis plt.bar() plt.axis import figure pyplot highlight_text pypalettes plt.subplots() xlabel ylabel title legend colorbar savefig tight_layout grid set_xlim set_ylim plot scatter hist boxplot imshow cmap alpha bins tick_params annotate quiver contour barh stackplot subplots_adjust axhline axvline semilogx semilogy loglog polar streamplot hexbin pcolor tricontour errorbar clabel set_aspect violinplot set_axis_off spines text hatch plt axis plt.bar() plt.axis import figure pyplot highlight_text pypalettes plt.subplots() xlabel ylabel title legend colorbar savefig tight_layout grid set_xlim set_ylim plot scatter hist boxplot imshow cmap alpha bins tick_params annotate quiver contour barh stackplot subplots_adjust axhline axvline semilogx semilogy loglog polar streamplot hexbin pcolor tricontour errorbar clabel set_aspect violinplot set_axis_off spines text hatch plt axis plt.bar() plt.axis import figure pyplot highlight_text pypalettes plt.subplots() xlabel ylabel title legend colorbar savefig tight_layout grid set_xlim set_ylim plot scatter hist boxplot imshow cmap alpha bins tick_params annotate quiver contour barh stackplot subplots_adjust axhline axvline semilogx semilogy loglog polar streamplot hexbin pcolor tricontour errorbar clabel set_aspect violinplot set_axis_off spines text hatch plt axis plt.bar() plt.axis import figure pyplot highlight_text pypalettes plt.subplots() xlabel ylabel title legend colorbar savefig tight_layout grid set_xlim set_ylim plot scatter hist boxplot imshow cmap alpha bins tick_params annotate quiver contour barh stackplot subplots_adjust axhline axvline semilogx semilogy loglog polar streamplot hexbin pcolor tricontour errorbar clabel set_aspect violinplot set_axis_off spines text hatch plt axis plt.bar() plt.axis import figure pyplot highlight_text pypalettes plt.subplots() xlabel ylabel title legend colorbar savefig tight_layout grid set_xlim set_ylim plot scatter hist boxplot imshow cmap alpha bins tick_params annotate quiver contour barh stackplot subplots_adjust axhline axvline semilogx semilogy loglog polar streamplot hexbin pcolor tricontour errorbar clabel set_aspect violinplot set_axis_off spines text hatch plt axis plt.bar() plt.axis import figure pyplot highlight_text pypalettes plt.subplots() xlabel ylabel title legend colorbar savefig tight_layout grid set_xlim set_ylim plot scatter hist boxplot imshow cmap alpha bins tick_params annotate quiver contour barh stackplot subplots_adjust axhline axvline semilogx semilogy loglog polar streamplot hexbin pcolor tricontour errorbar clabel set_aspect violinplot set_axis_off spines text hatch plt axis plt.bar() plt.axis import figure pyplot highlight_text pypalettes plt.subplots() xlabel ylabel title legend colorbar savefig tight_layout grid set_xlim set_ylim plot scatter hist boxplot imshow cmap alpha bins tick_params annotate quiver contour barh stackplot subplots_adjust axhline axvline semilogx semilogy loglog polar streamplot hexbin pcolor tricontour errorbar clabel set_aspect violinplot set_axis_off spines text hatch plt axis plt.bar() plt.axis import figure pyplot highlight_text pypalettes plt.subplots() xlabel ylabel title legend colorbar savefig tight_layout grid set_xlim set_ylim plot scatter hist boxplot imshow cmap alpha bins tick_params annotate quiver contour barh stackplot subplots_adjust axhline axvline semilogx semilogy loglog polar streamplot hexbin pcolor tricontour errorbar clabel set_aspect violinplot set_axis_off spines text hatch plt axis plt.bar() plt.axis import figure pyplot highlight_text pypalettes plt.subplots() xlabel ylabel title legend colorbar savefig tight_layout grid set_xlim set_ylim plot scatter hist boxplot imshow cmap alpha bins tick_params annotate quiver contour barh stackplot subplots_adjust axhline axvline semilogx semilogy loglog polar streamplot hexbin pcolor tricontour errorbar clabel set_aspect violinplot set_axis_off spines text hatch plt axis plt.bar() plt.axis import figure pyplot highlight_text pypalettes plt.subplots() xlabel ylabel title legend colorbar savefig tight_layout grid set_xlim set_ylim plot scatter hist boxplot imshow cmap alpha bins tick_params annotate quiver contour barh stackplot subplots_adjust axhline axvline semilogx semilogy loglog polar streamplot hexbin pcolor tricontour errorbar clabel set_aspect violinplot set_axis_off spines text hatch plt axis plt.bar() plt.axis import figure pyplot highlight_text pypalettes plt.subplots() xlabel ylabel title legend colorbar savefig tight_layout grid set_xlim set_ylim plot scatter hist boxplot imshow cmap alpha bins tick_params annotate quiver contour barh stackplot subplots_adjust axhline axvline semilogx semilogy loglog polar streamplot hexbin pcolor tricontour errorbar clabel set_aspect violinplot set_axis_off spines text hatch plt axis plt.bar() plt.axis import figure pyplot highlight_text pypalettes plt.subplots() xlabel ylabel title legend colorbar savefig tight_layout grid set_xlim set_ylim plot scatter hist boxplot imshow cmap alpha bins tick_params annotate quiver contour barh stackplot subplots_adjust axhline axvline semilogx semilogy loglog polar streamplot hexbin pcolor tricontour errorbar clabel set_aspect violinplot set_axis_off spines text hatch plt axis plt.bar() plt.axis import figure pyplot highlight_text pypalettes plt.subplots() xlabel ylabel title legend colorbar savefig tight_layout grid set_xlim set_ylim plot scatter hist boxplot imshow cmap alpha bins tick_params annotate quiver contour barh stackplot subplots_adjust axhline axvline semilogx semilogy loglog polar streamplot hexbin pcolor tricontour errorbar clabel set_aspect violinplot set_axis_off spines text hatch plt axis plt.bar() plt.axis import figure pyplot highlight_text pypalettes plt.subplots() xlabel ylabel title legend colorbar savefig tight_layout grid set_xlim set_ylim plot scatter hist boxplot imshow cmap alpha bins tick_params annotate quiver contour barh stackplot subplots_adjust axhline axvline semilogx semilogy loglog polar streamplot hexbin pcolor tricontour errorbar clabel set_aspect violinplot set_axis_off spines text hatch plt axis plt.bar() plt.axis import figure pyplot highlight_text pypalettes plt.subplots() xlabel ylabel title legend colorbar savefig tight_layout grid set_xlim set_ylim plot scatter hist boxplot imshow cmap alpha bins tick_params annotate quiver contour barh stackplot subplots_adjust axhline axvline semilogx semilogy loglog polar streamplot hexbin pcolor tricontour errorbar clabel set_aspect violinplot set_axis_off spines text hatch plt axis plt.bar() plt.axis import figure pyplot highlight_text pypalettes plt.subplots() xlabel ylabel title legend colorbar savefig tight_layout grid set_xlim set_ylim plot scatter hist boxplot imshow cmap alpha bins tick_params annotate quiver contour barh stackplot subplots_adjust axhline axvline semilogx semilogy loglog polar streamplot hexbin pcolor tricontour errorbar clabel set_aspect violinplot set_axis_off spines text hatch plt axis plt.bar() plt.axis import figure pyplot highlight_text pypalettes plt.subplots() xlabel ylabel title legend colorbar savefig tight_layout grid set_xlim set_ylim plot scatter hist boxplot imshow cmap alpha bins tick_params annotate quiver contour barh stackplot subplots_adjust axhline axvline semilogx semilogy loglog polar streamplot hexbin pcolor tricontour errorbar clabel set_aspect violinplot set_axis_off spines text hatch plt axis plt.bar() plt.axis import figure pyplot highlight_text pypalettes plt.subplots() xlabel ylabel title legend colorbar savefig tight_layout grid set_xlim set_ylim plot scatter hist boxplot imshow cmap alpha bins tick_params annotate quiver contour barh stackplot subplots_adjust axhline axvline semilogx semilogy loglog polar streamplot hexbin pcolor tricontour errorbar clabel set_aspect violinplot set_axis_off spines text hatch plt axis plt.bar() plt.axis import figure pyplot highlight_text pypalettes plt.subplots() xlabel ylabel title legend colorbar savefig tight_layout grid set_xlim set_ylim plot scatter hist boxplot imshow cmap alpha bins tick_params annotate quiver contour barh stackplot subplots_adjust axhline axvline semilogx semilogy loglog polar streamplot hexbin pcolor tricontour errorbar clabel set_aspect violinplot set_axis_off spines text hatch plt axis plt.bar() plt.axis import figure pyplot highlight_text pypalettes plt.subplots() xlabel ylabel title legend colorbar savefig tight_layout grid set_xlim set_ylim plot scatter hist boxplot imshow cmap alpha bins tick_params annotate quiver contour barh stackplot subplots_adjust axhline axvline semilogx semilogy loglog polar streamplot hexbin pcolor tricontour errorbar clabel set_aspect violinplot set_axis_off spines text hatch plt axis plt.bar() plt.axis import figure pyplot highlight_text pypalettes plt.subplots() xlabel ylabel title legend colorbar savefig tight_layout grid set_xlim set_ylim plot scatter hist boxplot imshow cmap alpha bins tick_params annotate quiver contour barh stackplot subplots_adjust axhline axvline semilogx semilogy loglog polar streamplot hexbin pcolor tricontour errorbar clabel set_aspect violinplot set_axis_off spines text hatch plt axis plt.bar() plt.axis import figure pyplot highlight_text pypalettes plt.subplots() xlabel ylabel title legend colorbar savefig tight_layout grid set_xlim set_ylim plot scatter hist boxplot imshow cmap alpha bins tick_params annotate quiver contour barh stackplot subplots_adjust axhline axvline semilogx semilogy loglog polar streamplot hexbin pcolor tricontour errorbar clabel set_aspect violinplot set_axis_off spines text hatch plt axis plt.bar() plt.axis import figure pyplot highlight_text pypalettes plt.subplots() xlabel ylabel title legend colorbar savefig tight_layout grid set_xlim set_ylim plot scatter hist boxplot imshow cmap alpha bins tick_params annotate quiver contour barh stackplot subplots_adjust axhline axvline semilogx semilogy loglog polar streamplot hexbin pcolor tricontour errorbar clabel set_aspect violinplot set_axis_off spines text hatch plt axis plt.bar() plt.axis import figure pyplot highlight_text pypalettes plt.subplots() xlabel ylabel title legend colorbar savefig tight_layout grid set_xlim set_ylim plot scatter hist boxplot imshow cmap alpha bins tick_params annotate quiver contour barh stackplot subplots_adjust axhline axvline semilogx semilogy loglog polar streamplot hexbin pcolor tricontour errorbar clabel set_aspect violinplot set_axis_off spines text hatch plt axis plt.bar() plt.axis import figure pyplot highlight_text pypalettes plt.subplots() xlabel ylabel title legend colorbar savefig tight_layout grid set_xlim set_ylim plot scatter hist boxplot imshow cmap alpha bins tick_params annotate quiver contour barh stackplot subplots_adjust axhline axvline semilogx semilogy loglog polar streamplot hexbin pcolor tricontour errorbar clabel set_aspect violinplot set_axis_off spines text hatch plt axis plt.bar() plt.axis import figure pyplot highlight_text pypalettes plt.subplots() xlabel ylabel title legend colorbar savefig tight_layout grid set_xlim set_ylim plot scatter hist boxplot imshow cmap alpha bins tick_params annotate quiver contour barh stackplot subplots_adjust axhline axvline semilogx semilogy loglog polar streamplot hexbin pcolor tricontour errorbar clabel set_aspect violinplot set_axis_off spines text hatch plt axis plt.bar() plt.axis import figure pyplot highlight_text pypalettes plt.subplots() xlabel ylabel title legend colorbar savefig tight_layout grid set_xlim set_ylim plot scatter hist boxplot imshow cmap alpha bins tick_params annotate quiver contour barh stackplot subplots_adjust axhline axvline semilogx semilogy loglog polar streamplot hexbin pcolor tricontour errorbar clabel set_aspect violinplot set_axis_off spines text hatch plt axis plt.bar() plt.axis import figure pyplot highlight_text pypalettes plt.subplots() xlabel ylabel title legend colorbar savefig tight_layout grid set_xlim set_ylim plot scatter hist boxplot imshow cmap alpha bins tick_params annotate quiver contour barh stackplot subplots_adjust axhline axvline semilogx semilogy loglog polar streamplot hexbin pcolor tricontour errorbar clabel set_aspect violinplot set_axis_off spines text hatch plt axis plt.bar() plt.axis import figure pyplot highlight_text pypalettes plt.subplots() xlabel ylabel title legend colorbar savefig tight_layout grid set_xlim set_ylim plot scatter hist boxplot imshow cmap alpha bins tick_params annotate quiver contour barh stackplot subplots_adjust axhline axvline semilogx semilogy loglog polar streamplot hexbin pcolor tricontour errorbar clabel set_aspect violinplot set_axis_off spines text hatch plt axis plt.bar() plt.axis import figure pyplot highlight_text pypalettes plt.subplots() xlabel ylabel title legend colorbar savefig tight_layout grid set_xlim set_ylim plot scatter hist boxplot imshow cmap alpha bins tick_params annotate quiver contour barh stackplot subplots_adjust axhline axvline semilogx semilogy loglog polar streamplot hexbin pcolor tricontour errorbar clabel set_aspect violinplot set_axis_off spines text hatch plt axis plt.bar() plt.axis import figure pyplot highlight_text pypalettes plt.subplots() xlabel ylabel title legend colorbar savefig tight_layout grid set_xlim set_ylim plot scatter hist boxplot imshow cmap alpha bins tick_params annotate quiver contour barh stackplot subplots_adjust axhline axvline semilogx semilogy loglog polar streamplot hexbin pcolor tricontour errorbar clabel set_aspect violinplot set_axis_off spines text hatch plt axis plt.bar() plt.axis import figure pyplot highlight_text pypalettes plt.subplots() xlabel ylabel title legend colorbar savefig tight_layout grid set_xlim set_ylim plot scatter hist boxplot imshow cmap alpha bins tick_params annotate quiver contour barh stackplot subplots_adjust axhline axvline semilogx semilogy loglog polar streamplot hexbin pcolor tricontour errorbar clabel set_aspect violinplot set_axis_off spines text hatch plt axis plt.bar() plt.axis import figure pyplot highlight_text pypalettes plt.subplots() xlabel ylabel title legend colorbar savefig tight_layout grid set_xlim set_ylim plot scatter hist boxplot imshow cmap alpha bins tick_params annotate quiver contour barh stackplot subplots_adjust axhline axvline semilogx semilogy loglog polar streamplot hexbin pcolor tricontour errorbar clabel set_aspect violinplot set_axis_off spines text hatch plt axis plt.bar() plt.axis import figure pyplot highlight_text pypalettes plt.subplots() xlabel ylabel title legend colorbar savefig tight_layout grid set_xlim set_ylim plot scatter hist boxplot imshow cmap alpha bins tick_params annotate quiver contour barh stackplot subplots_adjust axhline axvline semilogx semilogy loglog polar streamplot hexbin pcolor tricontour errorbar clabel set_aspect violinplot set_axis_off spines text hatch plt axis plt.bar() plt.axis import figure pyplot highlight_text pypalettes plt.subplots() xlabel ylabel title legend colorbar savefig tight_layout grid set_xlim set_ylim plot scatter hist boxplot imshow cmap alpha bins tick_params annotate quiver contour barh stackplot subplots_adjust axhline axvline semilogx semilogy loglog polar streamplot hexbin pcolor tricontour errorbar clabel set_aspect violinplot set_axis_off spines text hatch plt axis plt.bar() plt.axis import figure pyplot highlight_text pypalettes plt.subplots() xlabel ylabel title legend colorbar savefig tight_layout grid set_xlim set_ylim plot scatter hist boxplot imshow cmap alpha bins tick_params annotate quiver contour barh stackplot subplots_adjust axhline axvline semilogx semilogy loglog polar streamplot hexbin pcolor tricontour errorbar clabel set_aspect violinplot set_axis_off spines text hatch plt axis plt.bar() plt.axis import figure pyplot highlight_text pypalettes plt.subplots() xlabel ylabel title legend colorbar savefig tight_layout grid set_xlim set_ylim plot scatter hist boxplot imshow cmap alpha bins tick_params annotate quiver contour barh stackplot subplots_adjust axhline axvline semilogx semilogy loglog polar streamplot hexbin pcolor tricontour errorbar clabel set_aspect violinplot set_axis_off spines text hatch plt axis plt.bar() plt.axis import figure pyplot highlight_text pypalettes plt.subplots() xlabel ylabel title legend colorbar savefig tight_layout grid set_xlim set_ylim plot scatter hist boxplot imshow cmap alpha bins tick_params annotate quiver contour barh stackplot subplots_adjust axhline axvline semilogx semilogy loglog polar streamplot hexbin pcolor tricontour errorbar clabel set_aspect violinplot set_axis_off spines text hatch plt axis plt.bar() plt.axis import figure pyplot highlight_text pypalettes plt.subplots() xlabel ylabel title legend colorbar savefig tight_layout grid set_xlim set_ylim plot scatter hist boxplot imshow cmap alpha bins tick_params annotate quiver contour barh stackplot subplots_adjust axhline axvline semilogx semilogy loglog polar streamplot hexbin pcolor tricontour errorbar clabel set_aspect violinplot set_axis_off spines text hatch plt axis plt.bar() plt.axis import figure pyplot highlight_text pypalettes plt.subplots() xlabel ylabel title legend colorbar savefig tight_layout grid set_xlim set_ylim plot scatter hist boxplot imshow cmap alpha bins tick_params annotate quiver contour barh stackplot subplots_adjust axhline axvline semilogx semilogy loglog polar streamplot hexbin pcolor tricontour errorbar clabel set_aspect violinplot set_axis_off spines text hatch plt axis plt.bar() plt.axis import figure pyplot highlight_text pypalettes plt.subplots() xlabel ylabel title legend colorbar savefig tight_layout grid set_xlim set_ylim plot scatter hist boxplot imshow cmap alpha bins tick_params annotate quiver contour barh stackplot subplots_adjust axhline axvline semilogx semilogy loglog polar streamplot hexbin pcolor tricontour errorbar clabel set_aspect violinplot set_axis_off spines text hatch plt axis plt.bar() plt.axis import figure pyplot highlight_text pypalettes plt.subplots() xlabel ylabel title legend colorbar savefig tight_layout grid set_xlim set_ylim plot scatter hist boxplot imshow cmap alpha bins tick_params annotate quiver contour barh stackplot subplots_adjust axhline axvline semilogx semilogy loglog polar streamplot hexbin pcolor tricontour errorbar clabel set_aspect violinplot set_axis_off spines text hatch plt axis plt.bar() plt.axis import figure pyplot highlight_text pypalettes plt.subplots() xlabel ylabel title legend colorbar savefig tight_layout grid set_xlim set_ylim plot scatter hist boxplot imshow cmap alpha bins tick_params annotate quiver contour barh stackplot subplots_adjust axhline axvline semilogx semilogy loglog polar streamplot hexbin pcolor tricontour errorbar clabel set_aspect violinplot set_axis_off spines text hatch plt axis plt.bar() plt.axis import figure pyplot highlight_text pypalettes plt.subplots() xlabel ylabel title legend colorbar savefig tight_layout grid set_xlim set_ylim plot scatter hist boxplot imshow cmap alpha bins tick_params annotate quiver contour barh stackplot subplots_adjust axhline axvline semilogx semilogy loglog polar streamplot hexbin pcolor tricontour errorbar clabel set_aspect violinplot set_axis_off spines text hatch plt axis plt.bar() plt.axis import figure pyplot highlight_text pypalettes plt.subplots() xlabel ylabel title legend colorbar savefig tight_layout grid set_xlim set_ylim plot scatter hist boxplot imshow cmap alpha bins tick_params annotate quiver contour barh stackplot subplots_adjust axhline axvline semilogx semilogy loglog polar streamplot hexbin pcolor tricontour errorbar clabel set_aspect violinplot set_axis_off spines text hatch plt axis plt.bar() plt.axis import figure pyplot highlight_text pypalettes plt.subplots() xlabel ylabel title legend colorbar savefig tight_layout grid set_xlim set_ylim plot scatter hist boxplot imshow cmap alpha bins tick_params annotate quiver contour barh stackplot subplots_adjust axhline axvline semilogx semilogy loglog polar streamplot hexbin pcolor tricontour errorbar clabel set_aspect violinplot set_axis_off spines text hatch plt axis plt.bar() plt.axis import figure pyplot highlight_text pypalettes plt.subplots() xlabel ylabel title legend colorbar savefig tight_layout grid set_xlim set_ylim plot scatter hist boxplot imshow cmap alpha bins tick_params annotate quiver contour barh stackplot subplots_adjust axhline axvline semilogx semilogy loglog polar streamplot hexbin pcolor tricontour errorbar clabel set_aspect violinplot set_axis_off spines text hatch plt axis plt.bar() plt.axis import figure pyplot highlight_text pypalettes plt.subplots() xlabel ylabel title legend colorbar savefig tight_layout grid set_xlim set_ylim plot scatter hist boxplot imshow cmap alpha bins tick_params annotate quiver contour barh stackplot subplots_adjust axhline axvline semilogx semilogy loglog polar streamplot hexbin pcolor tricontour errorbar clabel set_aspect violinplot set_axis_off spines text hatch plt axis plt.bar() plt.axis import figure pyplot highlight_text pypalettes plt.subplots() xlabel ylabel title legend colorbar savefig tight_layout grid set_xlim set_ylim plot scatter hist boxplot imshow cmap alpha bins tick_params annotate quiver contour barh stackplot subplots_adjust axhline axvline semilogx semilogy loglog polar streamplot hexbin pcolor tricontour errorbar clabel set_aspect violinplot set_axis_off spines text hatch plt axis plt.bar() plt.axis import figure pyplot highlight_text pypalettes plt.subplots() xlabel ylabel title legend colorbar savefig tight_layout grid set_xlim set_ylim plot scatter hist boxplot imshow cmap alpha bins tick_params annotate quiver contour barh stackplot subplots_adjust axhline axvline semilogx semilogy loglog polar streamplot hexbin pcolor tricontour errorbar clabel set_aspect violinplot set_axis_off spines text hatch plt axis plt.bar() plt.axis import figure pyplot highlight_text pypalettes plt.subplots() xlabel ylabel title legend colorbar savefig tight_layout grid set_xlim set_ylim plot scatter hist boxplot imshow cmap alpha bins tick_params annotate quiver contour barh stackplot subplots_adjust axhline axvline semilogx semilogy loglog polar streamplot hexbin pcolor tricontour errorbar clabel set_aspect violinplot set_axis_off spines text hatch plt axis plt.bar() plt.axis import figure pyplot highlight_text pypalettes plt.subplots() xlabel ylabel title legend colorbar savefig tight_layout grid set_xlim set_ylim plot scatter hist boxplot imshow cmap alpha bins tick_params annotate quiver contour barh stackplot subplots_adjust axhline axvline semilogx semilogy loglog polar streamplot hexbin pcolor tricontour errorbar clabel set_aspect violinplot set_axis_off spines text hatch plt axis plt.bar() plt.axis import figure pyplot highlight_text pypalettes plt.subplots() xlabel ylabel title legend colorbar savefig tight_layout grid set_xlim set_ylim plot scatter hist boxplot imshow cmap alpha bins tick_params annotate quiver contour barh stackplot subplots_adjust axhline axvline semilogx semilogy loglog polar streamplot hexbin pcolor tricontour errorbar clabel set_aspect violinplot set_axis_off spines text hatch plt axis plt.bar() plt.axis import figure pyplot highlight_text pypalettes plt.subplots() xlabel ylabel title legend colorbar savefig tight_layout grid set_xlim set_ylim plot scatter hist boxplot imshow cmap alpha bins tick_params annotate quiver contour barh stackplot subplots_adjust axhline axvline semilogx semilogy loglog polar streamplot hexbin pcolor tricontour errorbar clabel set_aspect violinplot set_axis_off spines text hatch plt axis plt.bar() plt.axis import figure pyplot highlight_text pypalettes plt.subplots() xlabel ylabel title legend colorbar savefig tight_layout grid set_xlim set_ylim plot scatter hist boxplot imshow cmap alpha bins tick_params annotate quiver contour barh stackplot subplots_adjust axhline axvline semilogx semilogy loglog polar streamplot hexbin pcolor tricontour errorbar clabel set_aspect violinplot set_axis_off spines text hatch plt axis plt.bar() plt.axis import figure pyplot highlight_text pypalettes plt.subplots() xlabel ylabel title legend colorbar savefig tight_layout grid set_xlim set_ylim plot scatter hist boxplot imshow cmap alpha bins tick_params annotate quiver contour barh stackplot subplots_adjust axhline axvline semilogx semilogy loglog polar streamplot hexbin pcolor tricontour errorbar clabel set_aspect violinplot set_axis_off spines text hatch plt axis plt.bar() plt.axis import figure pyplot highlight_text pypalettes plt.subplots() xlabel ylabel title legend colorbar savefig tight_layout grid set_xlim set_ylim plot scatter hist boxplot imshow cmap alpha bins tick_params annotate quiver contour barh stackplot subplots_adjust axhline axvline semilogx semilogy loglog polar streamplot hexbin pcolor tricontour errorbar clabel set_aspect violinplot set_axis_off spines text hatch plt axis plt.bar() plt.axis import figure pyplot highlight_text pypalettes plt.subplots() xlabel ylabel title legend colorbar savefig tight_layout grid set_xlim set_ylim plot scatter hist boxplot imshow cmap alpha bins tick_params annotate quiver contour barh stackplot subplots_adjust axhline axvline semilogx semilogy loglog polar streamplot hexbin pcolor tricontour errorbar clabel set_aspect violinplot set_axis_off spines text hatch plt axis plt.bar() plt.axis import figure pyplot highlight_text pypalettes plt.subplots() xlabel ylabel title legend colorbar savefig tight_layout grid set_xlim set_ylim plot scatter hist boxplot imshow cmap alpha bins tick_params annotate quiver contour barh stackplot subplots_adjust axhline axvline semilogx semilogy loglog polar streamplot hexbin pcolor tricontour errorbar clabel set_aspect violinplot set_axis_off spines text hatch plt axis plt.bar() plt.axis import figure pyplot highlight_text pypalettes plt.subplots() xlabel ylabel title legend colorbar savefig tight_layout grid set_xlim set_ylim plot scatter hist boxplot imshow cmap alpha bins tick_params annotate quiver contour barh stackplot subplots_adjust axhline axvline semilogx semilogy loglog polar streamplot hexbin pcolor tricontour errorbar clabel set_aspect violinplot set_axis_off spines text hatch plt axis plt.bar() plt.axis import figure pyplot highlight_text pypalettes plt.subplots() xlabel ylabel title legend colorbar savefig tight_layout grid set_xlim set_ylim plot scatter hist boxplot imshow cmap alpha bins tick_params annotate quiver contour barh stackplot subplots_adjust axhline axvline semilogx semilogy loglog polar streamplot hexbin pcolor tricontour errorbar clabel set_aspect violinplot set_axis_off spines text hatch plt axis plt.bar() plt.axis import figure pyplot highlight_text pypalettes plt.subplots() xlabel ylabel title legend colorbar savefig tight_layout grid set_xlim set_ylim plot scatter hist boxplot imshow cmap alpha bins tick_params annotate quiver contour barh stackplot subplots_adjust axhline axvline semilogx semilogy loglog polar streamplot hexbin pcolor tricontour errorbar clabel set_aspect violinplot set_axis_off spines text hatch plt axis plt.bar() plt.axis import figure pyplot highlight_text pypalettes plt.subplots() xlabel ylabel title legend colorbar savefig tight_layout grid set_xlim set_ylim plot scatter hist boxplot imshow cmap alpha bins tick_params annotate quiver contour barh stackplot subplots_adjust axhline axvline semilogx semilogy loglog polar streamplot hexbin pcolor tricontour errorbar clabel set_aspect violinplot set_axis_off spines text hatch plt axis plt.bar() plt.axis import figure pyplot highlight_text pypalettes plt.subplots() xlabel ylabel title legend colorbar savefig tight_layout grid set_xlim set_ylim plot scatter hist boxplot imshow cmap alpha bins tick_params annotate quiver contour barh stackplot subplots_adjust axhline axvline semilogx semilogy loglog polar streamplot hexbin pcolor tricontour errorbar clabel set_aspect violinplot set_axis_off spines text hatch plt axis plt.bar() plt.axis import figure pyplot highlight_text pypalettes plt.subplots() xlabel ylabel title legend colorbar savefig tight_layout grid set_xlim set_ylim plot scatter hist boxplot imshow cmap alpha bins tick_params annotate quiver contour barh stackplot subplots_adjust axhline axvline semilogx semilogy loglog polar streamplot hexbin pcolor tricontour errorbar clabel set_aspect violinplot set_axis_off spines text hatch plt axis plt.bar() plt.axis import figure pyplot highlight_text pypalettes plt.subplots() xlabel ylabel title legend colorbar savefig tight_layout grid set_xlim set_ylim plot scatter hist boxplot imshow cmap alpha bins tick_params annotate quiver contour barh stackplot subplots_adjust axhline axvline semilogx semilogy loglog polar streamplot hexbin pcolor tricontour errorbar clabel set_aspect violinplot set_axis_off spines text hatch plt axis plt.bar() plt.axis import figure pyplot highlight_text pypalettes plt.subplots() xlabel ylabel title legend colorbar savefig tight_layout grid set_xlim set_ylim plot scatter hist boxplot imshow cmap alpha bins tick_params annotate quiver contour barh stackplot subplots_adjust axhline axvline semilogx semilogy loglog polar streamplot hexbin pcolor tricontour errorbar clabel set_aspect violinplot set_axis_off spines text hatch plt axis plt.bar() plt.axis import figure pyplot highlight_text pypalettes plt.subplots() xlabel ylabel title legend colorbar savefig tight_layout grid set_xlim set_ylim plot scatter hist boxplot imshow cmap alpha bins tick_params annotate quiver contour barh stackplot subplots_adjust axhline axvline semilogx semilogy loglog polar streamplot hexbin pcolor tricontour errorbar clabel set_aspect violinplot set_axis_off spines text hatch plt axis plt.bar() plt.axis import figure pyplot highlight_text pypalettes plt.subplots() xlabel ylabel title legend colorbar savefig tight_layout grid set_xlim set_ylim plot scatter hist boxplot imshow cmap alpha bins tick_params annotate quiver contour barh stackplot subplots_adjust axhline axvline semilogx semilogy loglog polar streamplot hexbin pcolor tricontour errorbar clabel set_aspect violinplot set_axis_off spines text hatch plt axis plt.bar() plt.axis import figure pyplot highlight_text pypalettes plt.subplots() xlabel ylabel title legend colorbar savefig tight_layout grid set_xlim set_ylim plot scatter hist boxplot imshow cmap alpha bins tick_params annotate quiver contour barh stackplot subplots_adjust axhline axvline semilogx semilogy loglog polar streamplot hexbin pcolor tricontour errorbar clabel set_aspect violinplot set_axis_off spines text hatch plt axis plt.bar() plt.axis import figure pyplot highlight_text pypalettes plt.subplots() xlabel ylabel title legend colorbar savefig tight_layout grid set_xlim set_ylim plot scatter hist boxplot imshow cmap alpha bins tick_params annotate quiver contour barh stackplot subplots_adjust axhline axvline semilogx semilogy loglog polar streamplot hexbin pcolor tricontour errorbar clabel set_aspect violinplot set_axis_off spines text hatch plt axis plt.bar() plt.axis import figure pyplot highlight_text pypalettes plt.subplots() xlabel ylabel title legend colorbar savefig tight_layout grid set_xlim set_ylim plot scatter hist boxplot imshow cmap alpha bins tick_params annotate quiver contour barh stackplot subplots_adjust axhline axvline semilogx semilogy loglog polar streamplot hexbin pcolor tricontour errorbar clabel set_aspect violinplot set_axis_off spines text hatch plt axis plt.bar() plt.axis import figure pyplot highlight_text pypalettes plt.subplots() xlabel ylabel title legend colorbar savefig tight_layout grid set_xlim set_ylim plot scatter hist boxplot imshow cmap alpha bins tick_params annotate quiver contour barh stackplot subplots_adjust axhline axvline semilogx semilogy loglog polar streamplot hexbin pcolor tricontour errorbar clabel set_aspect violinplot set_axis_off spines text hatch plt axis plt.bar() plt.axis import figure pyplot highlight_text pypalettes plt.subplots() xlabel ylabel title legend colorbar savefig tight_layout grid set_xlim set_ylim plot scatter hist boxplot imshow cmap alpha bins tick_params annotate quiver contour barh stackplot subplots_adjust axhline axvline semilogx semilogy loglog polar streamplot hexbin pcolor tricontour errorbar clabel set_aspect violinplot set_axis_off spines text hatch plt axis plt.bar() plt.axis import figure pyplot highlight_text pypalettes plt.subplots() xlabel ylabel title legend colorbar savefig tight_layout grid set_xlim set_ylim plot scatter hist boxplot imshow cmap alpha bins tick_params annotate quiver contour barh stackplot subplots_adjust axhline axvline semilogx semilogy loglog polar streamplot hexbin pcolor tricontour errorbar clabel set_aspect violinplot set_axis_off spines text hatch plt axis plt.bar() plt.axis import figure pyplot highlight_text pypalettes plt.subplots() xlabel ylabel title legend colorbar savefig tight_layout grid set_xlim set_ylim plot scatter hist boxplot imshow cmap alpha bins tick_params annotate quiver contour barh stackplot subplots_adjust axhline axvline semilogx semilogy loglog polar streamplot hexbin pcolor tricontour errorbar clabel set_aspect violinplot set_axis_off spines text hatch plt axis plt.bar() plt.axis import figure pyplot highlight_text pypalettes plt.subplots() xlabel ylabel title legend colorbar savefig tight_layout grid set_xlim set_ylim plot scatter hist boxplot imshow cmap alpha bins tick_params annotate quiver contour barh stackplot subplots_adjust axhline axvline semilogx semilogy loglog polar streamplot hexbin pcolor tricontour errorbar clabel set_aspect violinplot set_axis_off spines text hatch plt axis plt.bar() plt.axis import figure pyplot highlight_text pypalettes plt.subplots() xlabel ylabel title legend colorbar savefig tight_layout grid set_xlim set_ylim plot scatter hist boxplot imshow cmap alpha bins tick_params annotate quiver contour barh stackplot subplots_adjust axhline axvline semilogx semilogy loglog polar streamplot hexbin pcolor tricontour errorbar clabel set_aspect violinplot set_axis_off spines text hatch plt axis plt.bar() plt.axis import figure pyplot highlight_text pypalettes plt.subplots() xlabel ylabel title legend colorbar savefig tight_layout grid set_xlim set_ylim plot scatter hist boxplot imshow cmap alpha bins tick_params annotate quiver contour barh stackplot subplots_adjust axhline axvline semilogx semilogy loglog polar streamplot hexbin pcolor tricontour errorbar clabel set_aspect violinplot set_axis_off spines text hatch plt axis plt.bar() plt.axis import figure pyplot highlight_text pypalettes plt.subplots() xlabel ylabel title legend colorbar savefig tight_layout grid set_xlim set_ylim plot scatter hist boxplot imshow cmap alpha bins tick_params annotate quiver contour barh stackplot subplots_adjust axhline axvline semilogx semilogy loglog polar streamplot hexbin pcolor tricontour errorbar clabel set_aspect violinplot set_axis_off spines text hatch plt axis plt.bar() plt.axis import figure pyplot highlight_text pypalettes plt.subplots() xlabel ylabel title legend colorbar savefig tight_layout grid set_xlim set_ylim plot scatter hist boxplot imshow cmap alpha bins tick_params annotate quiver contour barh stackplot subplots_adjust axhline axvline semilogx semilogy loglog polar streamplot hexbin pcolor tricontour errorbar clabel set_aspect violinplot set_axis_off spines text hatch plt axis plt.bar() plt.axis import figure pyplot highlight_text pypalettes plt.subplots() xlabel ylabel title legend colorbar savefig tight_layout grid set_xlim set_ylim plot scatter hist boxplot imshow cmap alpha bins tick_params annotate quiver contour barh stackplot subplots_adjust axhline axvline semilogx semilogy loglog polar streamplot hexbin pcolor tricontour errorbar clabel set_aspect violinplot set_axis_off spines text hatch plt axis plt.bar() plt.axis import figure pyplot highlight_text pypalettes plt.subplots() xlabel ylabel title legend colorbar savefig tight_layout grid set_xlim set_ylim plot scatter hist boxplot imshow cmap alpha bins tick_params annotate quiver contour barh stackplot subplots_adjust axhline axvline semilogx semilogy loglog polar streamplot hexbin pcolor tricontour errorbar clabel set_aspect violinplot set_axis_off spines text hatch plt axis plt.bar() plt.axis import figure pyplot highlight_text pypalettes plt.subplots() xlabel ylabel title legend colorbar savefig tight_layout grid set_xlim set_ylim plot scatter hist boxplot imshow cmap alpha bins tick_params annotate quiver contour barh stackplot subplots_adjust axhline axvline semilogx semilogy loglog polar streamplot hexbin pcolor tricontour errorbar clabel set_aspect violinplot set_axis_off spines text hatch plt axis plt.bar() plt.axis import figure pyplot highlight_text pypalettes plt.subplots() xlabel ylabel title legend colorbar savefig tight_layout grid set_xlim set_ylim plot scatter hist boxplot imshow cmap alpha bins tick_params annotate quiver contour barh stackplot subplots_adjust axhline axvline semilogx semilogy loglog polar streamplot hexbin pcolor tricontour errorbar clabel set_aspect violinplot set_axis_off spines text hatch plt axis plt.bar() plt.axis import figure pyplot highlight_text pypalettes plt.subplots() xlabel ylabel title legend colorbar savefig tight_layout grid set_xlim set_ylim plot scatter hist boxplot imshow cmap alpha bins tick_params annotate quiver contour barh stackplot subplots_adjust axhline axvline semilogx semilogy loglog polar streamplot hexbin pcolor tricontour errorbar clabel set_aspect violinplot set_axis_off spines text hatch plt axis plt.bar() plt.axis import figure pyplot highlight_text pypalettes plt.subplots() xlabel ylabel title legend colorbar savefig tight_layout grid set_xlim set_ylim plot scatter hist boxplot imshow cmap alpha bins tick_params annotate quiver contour barh stackplot subplots_adjust axhline axvline semilogx semilogy loglog polar streamplot hexbin pcolor tricontour errorbar clabel set_aspect violinplot set_axis_off spines text hatch plt axis plt.bar() plt.axis import figure pyplot highlight_text pypalettes plt.subplots() xlabel ylabel title legend colorbar savefig tight_layout grid set_xlim set_ylim plot scatter hist boxplot imshow cmap alpha bins tick_params annotate quiver contour barh stackplot subplots_adjust axhline axvline semilogx semilogy loglog polar streamplot hexbin pcolor tricontour errorbar clabel set_aspect violinplot set_axis_off spines text hatch plt axis plt.bar() plt.axis import figure pyplot highlight_text pypalettes plt.subplots() xlabel ylabel title legend colorbar savefig tight_layout grid set_xlim set_ylim plot scatter hist boxplot imshow cmap alpha bins tick_params annotate quiver contour barh stackplot subplots_adjust axhline axvline semilogx semilogy loglog polar streamplot hexbin pcolor tricontour errorbar clabel set_aspect violinplot set_axis_off spines text hatch plt axis plt.bar() plt.axis import figure pyplot highlight_text pypalettes plt.subplots() xlabel ylabel title legend colorbar savefig tight_layout grid set_xlim set_ylim plot scatter hist boxplot imshow cmap alpha bins tick_params annotate quiver contour barh stackplot subplots_adjust axhline axvline semilogx semilogy loglog polar streamplot hexbin pcolor tricontour errorbar clabel set_aspect violinplot set_axis_off spines text hatch plt axis plt.bar() plt.axis import figure pyplot highlight_text pypalettes plt.subplots() xlabel ylabel title legend colorbar savefig tight_layout grid set_xlim set_ylim plot scatter hist boxplot imshow cmap alpha bins tick_params annotate quiver contour barh stackplot subplots_adjust axhline axvline semilogx semilogy loglog polar streamplot hexbin pcolor tricontour errorbar clabel set_aspect violinplot set_axis_off spines text hatch plt axis plt.bar() plt.axis import figure pyplot highlight_text pypalettes plt.subplots() xlabel ylabel title legend colorbar savefig tight_layout grid set_xlim set_ylim plot scatter hist boxplot imshow cmap alpha bins tick_params annotate quiver contour barh stackplot subplots_adjust axhline axvline semilogx semilogy loglog polar streamplot hexbin pcolor tricontour errorbar clabel set_aspect violinplot set_axis_off spines text hatch plt axis plt.bar() plt.axis import figure pyplot highlight_text pypalettes plt.subplots() xlabel ylabel title legend colorbar savefig tight_layout grid set_xlim set_ylim plot scatter hist boxplot imshow cmap alpha bins tick_params annotate quiver contour barh stackplot subplots_adjust axhline axvline semilogx semilogy loglog polar streamplot hexbin pcolor tricontour errorbar clabel set_aspect violinplot set_axis_off spines text hatch plt axis plt.bar() plt.axis import figure pyplot highlight_text pypalettes plt.subplots() xlabel ylabel title legend colorbar savefig tight_layout grid set_xlim set_ylim plot scatter hist boxplot imshow cmap alpha bins tick_params annotate quiver contour barh stackplot subplots_adjust axhline axvline semilogx semilogy loglog polar streamplot hexbin pcolor tricontour errorbar clabel set_aspect violinplot set_axis_off spines text hatch plt axis plt.bar() plt.axis import figure pyplot highlight_text pypalettes plt.subplots() xlabel ylabel title legend colorbar savefig tight_layout grid set_xlim set_ylim plot scatter hist boxplot imshow cmap alpha bins tick_params annotate quiver contour barh stackplot subplots_adjust axhline axvline semilogx semilogy loglog polar streamplot hexbin pcolor tricontour errorbar clabel set_aspect violinplot set_axis_off spines text hatch plt axis plt.bar() plt.axis import figure pyplot highlight_text pypalettes plt.subplots() xlabel ylabel title legend colorbar savefig tight_layout grid set_xlim set_ylim plot scatter hist boxplot imshow cmap alpha bins tick_params annotate quiver contour barh stackplot subplots_adjust axhline axvline semilogx semilogy loglog polar streamplot hexbin pcolor tricontour errorbar clabel set_aspect violinplot set_axis_off spines text hatch plt axis plt.bar() plt.axis import figure pyplot highlight_text pypalettes plt.subplots() xlabel ylabel title legend colorbar savefig tight_layout grid set_xlim set_ylim plot scatter hist boxplot imshow cmap alpha bins tick_params annotate quiver contour barh stackplot subplots_adjust axhline axvline semilogx semilogy loglog polar streamplot hexbin pcolor tricontour errorbar clabel set_aspect violinplot set_axis_off spines text hatch plt axis plt.bar() plt.axis import figure pyplot highlight_text pypalettes plt.subplots() xlabel ylabel title legend colorbar savefig tight_layout grid set_xlim set_ylim plot scatter hist boxplot imshow cmap alpha bins tick_params annotate quiver contour barh stackplot subplots_adjust axhline axvline semilogx semilogy loglog polar streamplot hexbin pcolor tricontour errorbar clabel set_aspect violinplot set_axis_off spines text hatch plt axis plt.bar() plt.axis import figure pyplot highlight_text pypalettes plt.subplots() xlabel ylabel title legend colorbar savefig tight_layout grid set_xlim set_ylim plot scatter hist boxplot imshow cmap alpha bins tick_params annotate quiver contour barh stackplot subplots_adjust axhline axvline semilogx semilogy loglog polar streamplot hexbin pcolor tricontour errorbar clabel set_aspect violinplot set_axis_off spines text hatch plt axis plt.bar() plt.axis import figure pyplot highlight_text pypalettes plt.subplots() xlabel ylabel title legend colorbar savefig tight_layout grid set_xlim set_ylim plot scatter hist boxplot imshow cmap alpha bins tick_params annotate quiver contour barh stackplot subplots_adjust axhline axvline semilogx semilogy loglog polar streamplot hexbin pcolor tricontour errorbar clabel set_aspect violinplot set_axis_off spines text hatch plt axis plt.bar() plt.axis import figure pyplot highlight_text pypalettes plt.subplots() xlabel ylabel title legend colorbar savefig tight_layout grid set_xlim set_ylim plot scatter hist boxplot imshow cmap alpha bins tick_params annotate quiver contour barh stackplot subplots_adjust axhline axvline semilogx semilogy loglog polar streamplot hexbin pcolor tricontour errorbar clabel set_aspect violinplot set_axis_off spines text hatch plt axis plt.bar() plt.axis import figure pyplot highlight_text pypalettes plt.subplots() xlabel ylabel title legend colorbar savefig tight_layout grid set_xlim set_ylim plot scatter hist boxplot imshow cmap alpha bins tick_params annotate quiver contour barh stackplot subplots_adjust axhline axvline semilogx semilogy loglog polar streamplot hexbin pcolor tricontour errorbar clabel set_aspect violinplot set_axis_off spines text hatch plt axis plt.bar() plt.axis import figure pyplot highlight_text pypalettes plt.subplots() xlabel ylabel title legend colorbar savefig tight_layout grid set_xlim set_ylim plot scatter hist boxplot imshow cmap alpha bins tick_params annotate quiver contour barh stackplot subplots_adjust axhline axvline semilogx semilogy loglog polar streamplot hexbin pcolor tricontour errorbar clabel set_aspect violinplot set_axis_off spines text hatch plt axis plt.bar() plt.axis import figure pyplot highlight_text pypalettes plt.subplots() xlabel ylabel title legend colorbar savefig tight_layout grid set_xlim set_ylim plot scatter hist boxplot imshow cmap alpha bins tick_params annotate quiver contour barh stackplot subplots_adjust axhline axvline semilogx semilogy loglog polar streamplot hexbin pcolor tricontour errorbar clabel set_aspect violinplot set_axis_off spines text hatch plt axis plt.bar() plt.axis import figure pyplot highlight_text pypalettes plt.subplots() xlabel ylabel title legend colorbar savefig tight_layout grid set_xlim set_ylim plot scatter hist boxplot imshow cmap alpha bins tick_params annotate quiver contour barh stackplot subplots_adjust axhline axvline semilogx semilogy loglog polar streamplot hexbin pcolor tricontour errorbar clabel set_aspect violinplot set_axis_off spines text hatch plt axis plt.bar() plt.axis import figure pyplot highlight_text pypalettes plt.subplots() xlabel ylabel title legend colorbar savefig tight_layout grid set_xlim set_ylim plot scatter hist boxplot imshow cmap alpha bins tick_params annotate quiver contour barh stackplot subplots_adjust axhline axvline semilogx semilogy loglog polar streamplot hexbin pcolor tricontour errorbar clabel set_aspect violinplot set_axis_off spines text hatch plt axis plt.bar() plt.axis import figure pyplot highlight_text pypalettes plt.subplots() xlabel ylabel title legend colorbar savefig tight_layout grid set_xlim set_ylim plot scatter hist boxplot imshow cmap alpha bins tick_params annotate quiver contour barh stackplot subplots_adjust axhline axvline semilogx semilogy loglog polar streamplot hexbin pcolor tricontour errorbar clabel set_aspect violinplot set_axis_off spines text hatch plt axis plt.bar() plt.axis import figure pyplot highlight_text pypalettes plt.subplots() xlabel ylabel title legend colorbar savefig tight_layout grid set_xlim set_ylim plot scatter hist boxplot imshow cmap alpha bins tick_params annotate quiver contour barh stackplot subplots_adjust axhline axvline semilogx semilogy loglog polar streamplot hexbin pcolor tricontour errorbar clabel set_aspect violinplot set_axis_off spines text hatch plt axis plt.bar() plt.axis import figure pyplot highlight_text pypalettes plt.subplots() xlabel ylabel title legend colorbar savefig tight_layout grid set_xlim set_ylim plot scatter hist boxplot imshow cmap alpha bins tick_params annotate quiver contour barh stackplot subplots_adjust axhline axvline semilogx semilogy loglog polar streamplot hexbin pcolor tricontour errorbar clabel set_aspect violinplot set_axis_off spines text hatch plt axis plt.bar() plt.axis import figure pyplot highlight_text pypalettes plt.subplots() xlabel ylabel title legend colorbar savefig tight_layout grid set_xlim set_ylim plot scatter hist boxplot imshow cmap alpha bins tick_params annotate quiver contour barh stackplot subplots_adjust axhline axvline semilogx semilogy loglog polar streamplot hexbin pcolor tricontour errorbar clabel set_aspect violinplot set_axis_off spines text hatch plt axis plt.bar() plt.axis import figure pyplot highlight_text pypalettes plt.subplots() xlabel ylabel title legend colorbar savefig tight_layout grid set_xlim set_ylim plot scatter hist boxplot imshow cmap alpha bins tick_params annotate quiver contour barh stackplot subplots_adjust axhline axvline semilogx semilogy loglog polar streamplot hexbin pcolor tricontour errorbar clabel set_aspect violinplot set_axis_off spines text hatch plt axis plt.bar() plt.axis import figure pyplot highlight_text pypalettes plt.subplots() xlabel ylabel title legend colorbar savefig tight_layout grid set_xlim set_ylim plot scatter hist boxplot imshow cmap alpha bins tick_params annotate quiver contour barh stackplot subplots_adjust axhline axvline semilogx semilogy loglog polar streamplot hexbin pcolor tricontour errorbar clabel set_aspect violinplot set_axis_off spines text hatch plt axis plt.bar() plt.axis import figure pyplot highlight_text pypalettes plt.subplots() xlabel ylabel title legend colorbar savefig tight_layout grid set_xlim set_ylim plot scatter hist boxplot imshow cmap alpha bins tick_params annotate quiver contour barh stackplot subplots_adjust axhline axvline semilogx semilogy loglog polar streamplot hexbin pcolor tricontour errorbar clabel set_aspect violinplot set_axis_off spines text hatch plt axis plt.bar() plt.axis import figure pyplot highlight_text pypalettes plt.subplots() xlabel ylabel title legend colorbar savefig tight_layout grid set_xlim set_ylim plot scatter hist boxplot imshow cmap alpha bins tick_params annotate quiver contour barh stackplot subplots_adjust axhline axvline semilogx semilogy loglog polar streamplot hexbin pcolor tricontour errorbar clabel set_aspect violinplot set_axis_off spines text hatch plt axis plt.bar() plt.axis import figure pyplot highlight_text pypalettes plt.subplots() xlabel ylabel title legend colorbar savefig tight_layout grid set_xlim set_ylim plot scatter hist boxplot imshow cmap alpha bins tick_params annotate quiver contour barh stackplot subplots_adjust axhline axvline semilogx semilogy loglog polar streamplot hexbin pcolor tricontour errorbar clabel set_aspect violinplot set_axis_off spines text hatch plt axis plt.bar() plt.axis import figure pyplot highlight_text pypalettes plt.subplots() xlabel ylabel title legend colorbar savefig tight_layout grid set_xlim set_ylim plot scatter hist boxplot imshow cmap alpha bins tick_params annotate quiver contour barh stackplot subplots_adjust axhline axvline semilogx semilogy loglog polar streamplot hexbin pcolor tricontour errorbar clabel set_aspect violinplot set_axis_off spines text hatch plt axis plt.bar() plt.axis import figure pyplot highlight_text pypalettes plt.subplots() xlabel ylabel title legend colorbar savefig tight_layout grid set_xlim set_ylim plot scatter hist boxplot imshow cmap alpha bins tick_params annotate quiver contour barh stackplot subplots_adjust axhline axvline semilogx semilogy loglog polar streamplot hexbin pcolor tricontour errorbar clabel set_aspect violinplot set_axis_off spines text hatch plt axis plt.bar() plt.axis import figure pyplot highlight_text pypalettes plt.subplots() xlabel ylabel title legend colorbar savefig tight_layout grid set_xlim set_ylim plot scatter hist boxplot imshow cmap alpha bins tick_params annotate quiver contour barh stackplot subplots_adjust axhline axvline semilogx semilogy loglog polar streamplot hexbin pcolor tricontour errorbar clabel set_aspect violinplot set_axis_off spines text hatch plt axis plt.bar() plt.axis import figure pyplot highlight_text pypalettes plt.subplots() xlabel ylabel title legend colorbar savefig tight_layout grid set_xlim set_ylim plot scatter hist boxplot imshow cmap alpha bins tick_params annotate quiver contour barh stackplot subplots_adjust axhline axvline semilogx semilogy loglog polar streamplot hexbin pcolor tricontour errorbar clabel set_aspect violinplot set_axis_off spines text hatch plt axis plt.bar() plt.axis import figure pyplot highlight_text pypalettes plt.subplots() xlabel ylabel title legend colorbar savefig tight_layout grid set_xlim set_ylim plot scatter hist boxplot imshow cmap alpha bins tick_params annotate quiver contour barh stackplot subplots_adjust axhline axvline semilogx semilogy loglog polar streamplot hexbin pcolor tricontour errorbar clabel set_aspect violinplot set_axis_off spines text hatch plt axis plt.bar() plt.axis import figure pyplot highlight_text pypalettes plt.subplots() xlabel ylabel title legend colorbar savefig tight_layout grid set_xlim set_ylim plot scatter hist boxplot imshow cmap alpha bins tick_params annotate quiver contour barh stackplot subplots_adjust axhline axvline semilogx semilogy loglog polar streamplot hexbin pcolor tricontour errorbar clabel set_aspect violinplot set_axis_off spines text hatch plt axis plt.bar() plt.axis import figure pyplot highlight_text pypalettes plt.subplots() xlabel ylabel title legend colorbar savefig tight_layout grid set_xlim set_ylim plot scatter hist boxplot imshow cmap alpha bins tick_params annotate quiver contour barh stackplot subplots_adjust axhline axvline semilogx semilogy loglog polar streamplot hexbin pcolor tricontour errorbar clabel set_aspect violinplot set_axis_off spines text hatch plt axis plt.bar() plt.axis import figure pyplot highlight_text pypalettes plt.subplots() xlabel ylabel title legend colorbar savefig tight_layout grid set_xlim set_ylim plot scatter hist boxplot imshow cmap alpha bins tick_params annotate quiver contour barh stackplot subplots_adjust axhline axvline semilogx semilogy loglog polar streamplot hexbin pcolor tricontour errorbar clabel set_aspect violinplot set_axis_off spines text hatch plt axis plt.bar() plt.axis import figure pyplot highlight_text pypalettes plt.subplots() xlabel ylabel title legend colorbar savefig tight_layout grid set_xlim set_ylim plot scatter hist boxplot imshow cmap alpha bins tick_params annotate quiver contour barh stackplot subplots_adjust axhline axvline semilogx semilogy loglog polar streamplot hexbin pcolor tricontour errorbar clabel set_aspect violinplot set_axis_off spines text hatch plt axis plt.bar() plt.axis import figure pyplot highlight_text pypalettes plt.subplots() xlabel ylabel title legend colorbar savefig tight_layout grid set_xlim set_ylim plot scatter hist boxplot imshow cmap alpha bins tick_params annotate quiver contour barh stackplot subplots_adjust axhline axvline semilogx semilogy loglog polar streamplot hexbin pcolor tricontour errorbar clabel set_aspect violinplot set_axis_off spines text hatch plt axis plt.bar() plt.axis import figure pyplot highlight_text pypalettes plt.subplots() xlabel ylabel title legend colorbar savefig tight_layout grid set_xlim set_ylim plot scatter hist boxplot imshow cmap alpha bins tick_params annotate quiver contour barh stackplot subplots_adjust axhline axvline semilogx semilogy loglog polar streamplot hexbin pcolor tricontour errorbar clabel set_aspect violinplot set_axis_off spines text hatch plt axis plt.bar() plt.axis import figure pyplot highlight_text pypalettes plt.subplots() xlabel ylabel title legend colorbar savefig tight_layout grid set_xlim set_ylim plot scatter hist boxplot imshow cmap alpha bins tick_params annotate quiver contour barh stackplot subplots_adjust axhline axvline semilogx semilogy loglog polar streamplot hexbin pcolor tricontour errorbar clabel set_aspect violinplot set_axis_off spines text hatch plt axis plt.bar() plt.axis import figure pyplot highlight_text pypalettes plt.subplots() xlabel ylabel title legend colorbar savefig tight_layout grid set_xlim set_ylim plot scatter hist boxplot imshow cmap alpha bins tick_params annotate quiver contour barh stackplot subplots_adjust axhline axvline semilogx semilogy loglog polar streamplot hexbin pcolor tricontour errorbar clabel set_aspect violinplot set_axis_off spines text hatch plt axis plt.bar() plt.axis import figure pyplot highlight_text pypalettes plt.subplots() xlabel ylabel title legend colorbar savefig tight_layout grid set_xlim set_ylim plot scatter hist boxplot imshow cmap alpha bins tick_params annotate quiver contour barh stackplot subplots_adjust axhline axvline semilogx semilogy loglog polar streamplot hexbin pcolor tricontour errorbar clabel set_aspect violinplot set_axis_off spines text hatch plt axis plt.bar() plt.axis import figure pyplot highlight_text pypalettes plt.subplots() xlabel ylabel title legend colorbar savefig tight_layout grid set_xlim set_ylim plot scatter hist boxplot imshow cmap alpha bins tick_params annotate quiver contour barh stackplot subplots_adjust axhline axvline semilogx semilogy loglog polar streamplot hexbin pcolor tricontour errorbar clabel set_aspect violinplot set_axis_off spines text hatch plt axis plt.bar() plt.axis import figure pyplot highlight_text pypalettes plt.subplots() xlabel ylabel title legend colorbar savefig tight_layout grid set_xlim set_ylim plot scatter hist boxplot imshow cmap alpha bins tick_params annotate quiver contour barh stackplot subplots_adjust axhline axvline semilogx semilogy loglog polar streamplot hexbin pcolor tricontour errorbar clabel set_aspect violinplot set_axis_off spines text hatch plt axis plt.bar() plt.axis import figure pyplot highlight_text pypalettes plt.subplots() xlabel ylabel title legend colorbar savefig tight_layout grid set_xlim set_ylim plot scatter hist boxplot imshow cmap alpha bins tick_params annotate quiver contour barh stackplot subplots_adjust axhline axvline semilogx semilogy loglog polar streamplot hexbin pcolor tricontour errorbar clabel set_aspect violinplot set_axis_off spines text hatch plt axis plt.bar() plt.axis import figure pyplot highlight_text pypalettes plt.subplots() xlabel ylabel title legend colorbar savefig tight_layout grid set_xlim set_ylim plot scatter hist boxplot imshow cmap alpha bins tick_params annotate quiver contour barh stackplot subplots_adjust axhline axvline semilogx semilogy loglog polar streamplot hexbin pcolor tricontour errorbar clabel set_aspect violinplot set_axis_off spines text hatch plt axis plt.bar() plt.axis import figure pyplot highlight_text pypalettes plt.subplots() xlabel ylabel title legend colorbar savefig tight_layout grid set_xlim set_ylim plot scatter hist boxplot imshow cmap alpha bins tick_params annotate quiver contour barh stackplot subplots_adjust axhline axvline semilogx semilogy loglog polar streamplot hexbin pcolor tricontour errorbar clabel set_aspect violinplot set_axis_off spines text hatch plt axis plt.bar() plt.axis import figure pyplot highlight_text pypalettes plt.subplots() xlabel ylabel title legend colorbar savefig tight_layout grid set_xlim set_ylim plot scatter hist boxplot imshow cmap alpha bins tick_params annotate quiver contour barh stackplot subplots_adjust axhline axvline semilogx semilogy loglog polar streamplot hexbin pcolor tricontour errorbar clabel set_aspect violinplot set_axis_off spines text hatch plt axis plt.bar() plt.axis import figure pyplot highlight_text pypalettes plt.subplots() xlabel ylabel title legend colorbar savefig tight_layout grid set_xlim set_ylim plot scatter hist boxplot imshow cmap alpha bins tick_params annotate quiver contour barh stackplot subplots_adjust axhline axvline semilogx semilogy loglog polar streamplot hexbin pcolor tricontour errorbar clabel set_aspect violinplot set_axis_off spines text hatch plt axis plt.bar() plt.axis import figure pyplot highlight_text pypalettes plt.subplots() xlabel ylabel title legend colorbar savefig tight_layout grid set_xlim set_ylim plot scatter hist boxplot imshow cmap alpha bins tick_params annotate quiver contour barh stackplot subplots_adjust axhline axvline semilogx semilogy loglog polar streamplot hexbin pcolor tricontour errorbar clabel set_aspect violinplot set_axis_off spines text hatch plt axis plt.bar() plt.axis import figure pyplot highlight_text pypalettes plt.subplots() xlabel ylabel title legend colorbar savefig tight_layout grid set_xlim set_ylim plot scatter hist boxplot imshow cmap alpha bins tick_params annotate quiver contour barh stackplot subplots_adjust axhline axvline semilogx semilogy loglog polar streamplot hexbin pcolor tricontour errorbar clabel set_aspect violinplot set_axis_off spines text hatch plt axis plt.bar() plt.axis import figure pyplot highlight_text pypalettes plt.subplots() xlabel ylabel title legend colorbar savefig tight_layout grid set_xlim set_ylim plot scatter hist boxplot imshow cmap alpha bins tick_params annotate quiver contour barh stackplot subplots_adjust axhline axvline semilogx semilogy loglog polar streamplot hexbin pcolor tricontour errorbar clabel set_aspect violinplot set_axis_off spines text hatch plt axis plt.bar() plt.axis import figure pyplot highlight_text pypalettes plt.subplots() xlabel ylabel title legend colorbar savefig tight_layout grid set_xlim set_ylim plot scatter hist boxplot imshow cmap alpha bins tick_params annotate quiver contour barh stackplot subplots_adjust axhline axvline semilogx semilogy loglog polar streamplot hexbin pcolor tricontour errorbar clabel set_aspect violinplot set_axis_off spines text hatch plt axis plt.bar() plt.axis import figure pyplot highlight_text pypalettes plt.subplots() xlabel ylabel title legend colorbar savefig tight_layout grid set_xlim set_ylim plot scatter hist boxplot imshow cmap alpha bins tick_params annotate quiver contour barh stackplot subplots_adjust axhline axvline semilogx semilogy loglog polar streamplot hexbin pcolor tricontour errorbar clabel set_aspect violinplot set_axis_off spines text hatch plt axis plt.bar() plt.axis import figure pyplot highlight_text pypalettes plt.subplots() xlabel ylabel title legend colorbar savefig tight_layout grid set_xlim set_ylim plot scatter hist boxplot imshow cmap alpha bins tick_params annotate quiver contour barh stackplot subplots_adjust axhline axvline semilogx semilogy loglog polar streamplot hexbin pcolor tricontour errorbar clabel set_aspect violinplot set_axis_off spines text hatch plt axis plt.bar() plt.axis import figure pyplot highlight_text pypalettes plt.subplots() xlabel ylabel title legend colorbar savefig tight_layout grid set_xlim set_ylim plot scatter hist boxplot imshow cmap alpha bins tick_params annotate quiver contour barh stackplot subplots_adjust axhline axvline semilogx semilogy loglog polar streamplot hexbin pcolor tricontour errorbar clabel set_aspect violinplot set_axis_off spines text hatch plt axis plt.bar() plt.axis import figure pyplot highlight_text pypalettes plt.subplots() xlabel ylabel title legend colorbar savefig tight_layout grid set_xlim set_ylim plot scatter hist boxplot imshow cmap alpha bins tick_params annotate quiver contour barh stackplot subplots_adjust axhline axvline semilogx semilogy loglog polar streamplot hexbin pcolor tricontour errorbar clabel set_aspect violinplot set_axis_off spines text hatch plt axis plt.bar() plt.axis import figure pyplot highlight_text pypalettes plt.subplots() xlabel ylabel title legend colorbar savefig tight_layout grid set_xlim set_ylim plot scatter hist boxplot imshow cmap alpha bins tick_params annotate quiver contour barh stackplot subplots_adjust axhline axvline semilogx semilogy loglog polar streamplot hexbin pcolor tricontour errorbar clabel set_aspect violinplot set_axis_off spines text hatch plt axis plt.bar() plt.axis import figure pyplot highlight_text pypalettes plt.subplots() xlabel ylabel title legend colorbar savefig tight_layout grid set_xlim set_ylim plot scatter hist boxplot imshow cmap alpha bins tick_params annotate quiver contour barh stackplot subplots_adjust axhline axvline semilogx semilogy loglog polar streamplot hexbin pcolor tricontour errorbar clabel set_aspect violinplot set_axis_off spines text hatch plt axis plt.bar() plt.axis import figure pyplot highlight_text pypalettes plt.subplots() xlabel ylabel title legend colorbar savefig tight_layout grid set_xlim set_ylim plot scatter hist boxplot imshow cmap alpha bins tick_params annotate quiver contour barh stackplot subplots_adjust axhline axvline semilogx semilogy loglog polar streamplot hexbin pcolor tricontour errorbar clabel set_aspect violinplot set_axis_off spines text hatch plt axis plt.bar() plt.axis import figure pyplot highlight_text pypalettes plt.subplots() xlabel ylabel title legend colorbar savefig tight_layout grid set_xlim set_ylim plot scatter hist boxplot imshow cmap alpha bins tick_params annotate quiver contour barh stackplot subplots_adjust axhline axvline semilogx semilogy loglog polar streamplot hexbin pcolor tricontour errorbar clabel set_aspect violinplot set_axis_off spines text hatch plt axis plt.bar() plt.axis import figure pyplot highlight_text pypalettes plt.subplots() xlabel ylabel title legend colorbar savefig tight_layout grid set_xlim set_ylim plot scatter hist boxplot imshow cmap alpha bins tick_params annotate quiver contour barh stackplot subplots_adjust axhline axvline semilogx semilogy loglog polar streamplot hexbin pcolor tricontour errorbar clabel set_aspect violinplot set_axis_off spines text hatch plt axis plt.bar() plt.axis import figure pyplot highlight_text pypalettes plt.subplots() xlabel ylabel title legend colorbar savefig tight_layout grid set_xlim set_ylim plot scatter hist boxplot imshow cmap alpha bins tick_params annotate quiver contour barh stackplot subplots_adjust axhline axvline semilogx semilogy loglog polar streamplot hexbin pcolor tricontour errorbar clabel set_aspect violinplot set_axis_off spines text hatch plt axis plt.bar() plt.axis import figure pyplot highlight_text pypalettes plt.subplots() xlabel ylabel title legend colorbar savefig tight_layout grid set_xlim set_ylim plot scatter hist boxplot imshow cmap alpha bins tick_params annotate quiver contour barh stackplot subplots_adjust axhline axvline semilogx semilogy loglog polar streamplot hexbin pcolor tricontour errorbar clabel set_aspect violinplot set_axis_off spines text hatch plt axis plt.bar() plt.axis import figure pyplot highlight_text pypalettes plt.subplots() xlabel ylabel title legend colorbar savefig tight_layout grid set_xlim set_ylim plot scatter hist boxplot imshow cmap alpha bins tick_params annotate quiver contour barh stackplot subplots_adjust axhline axvline semilogx semilogy loglog polar streamplot hexbin pcolor tricontour errorbar clabel set_aspect violinplot set_axis_off spines text hatch plt axis plt.bar() plt.axis import figure pyplot highlight_text pypalettes plt.subplots() xlabel ylabel title legend colorbar savefig tight_layout grid set_xlim set_ylim plot scatter hist boxplot imshow cmap alpha bins tick_params annotate quiver contour barh stackplot subplots_adjust axhline axvline semilogx semilogy loglog polar streamplot hexbin pcolor tricontour errorbar clabel set_aspect violinplot set_axis_off spines text hatch plt axis plt.bar() plt.axis import figure pyplot highlight_text pypalettes plt.subplots() xlabel ylabel title legend colorbar savefig tight_layout grid set_xlim set_ylim plot scatter hist boxplot imshow cmap alpha bins tick_params annotate quiver contour barh stackplot subplots_adjust axhline axvline semilogx semilogy loglog polar streamplot hexbin pcolor tricontour errorbar clabel set_aspect violinplot set_axis_off spines text hatch plt axis plt.bar() plt.axis import figure pyplot highlight_text pypalettes plt.subplots() xlabel ylabel title legend colorbar savefig tight_layout grid set_xlim set_ylim plot scatter hist boxplot imshow cmap alpha bins tick_params annotate quiver contour barh stackplot subplots_adjust axhline axvline semilogx semilogy loglog polar streamplot hexbin pcolor tricontour errorbar clabel set_aspect violinplot set_axis_off spines text hatch plt axis plt.bar() plt.axis import figure pyplot highlight_text pypalettes plt.subplots() xlabel ylabel title legend colorbar savefig tight_layout grid set_xlim set_ylim plot scatter hist boxplot imshow cmap alpha bins tick_params annotate quiver contour barh stackplot subplots_adjust axhline axvline semilogx semilogy loglog polar streamplot hexbin pcolor tricontour errorbar clabel set_aspect violinplot set_axis_off spines text hatch plt axis plt.bar() plt.axis import figure pyplot highlight_text pypalettes plt.subplots() xlabel ylabel title legend colorbar savefig tight_layout grid set_xlim set_ylim plot scatter hist boxplot imshow cmap alpha bins tick_params annotate quiver contour barh stackplot subplots_adjust axhline axvline semilogx semilogy loglog polar streamplot hexbin pcolor tricontour errorbar clabel set_aspect violinplot set_axis_off spines text hatch plt axis plt.bar() plt.axis import figure pyplot highlight_text pypalettes plt.subplots() xlabel ylabel title legend colorbar savefig tight_layout grid set_xlim set_ylim plot scatter hist boxplot imshow cmap alpha bins tick_params annotate quiver contour barh stackplot subplots_adjust axhline axvline semilogx semilogy loglog polar streamplot hexbin pcolor tricontour errorbar clabel set_aspect violinplot set_axis_off spines text hatch plt axis plt.bar() plt.axis import figure pyplot highlight_text pypalettes plt.subplots() xlabel ylabel title legend colorbar savefig tight_layout grid set_xlim set_ylim plot scatter hist boxplot imshow cmap alpha bins tick_params annotate quiver contour barh stackplot subplots_adjust axhline axvline semilogx semilogy loglog polar streamplot hexbin pcolor tricontour errorbar clabel set_aspect violinplot set_axis_off spines text hatch plt axis plt.bar() plt.axis import figure pyplot highlight_text pypalettes plt.subplots() xlabel ylabel title legend colorbar savefig tight_layout grid set_xlim set_ylim plot scatter hist boxplot imshow cmap alpha bins tick_params annotate quiver contour barh stackplot subplots_adjust axhline axvline semilogx semilogy loglog polar streamplot hexbin pcolor tricontour errorbar clabel set_aspect violinplot set_axis_off spines text hatch plt axis plt.bar() plt.axis import figure pyplot highlight_text pypalettes plt.subplots() xlabel ylabel title legend colorbar savefig tight_layout grid set_xlim set_ylim plot scatter hist boxplot imshow cmap alpha bins tick_params annotate quiver contour barh stackplot subplots_adjust axhline axvline semilogx semilogy loglog polar streamplot hexbin pcolor tricontour errorbar clabel set_aspect violinplot set_axis_off spines text hatch plt axis plt.bar() plt.axis import figure pyplot highlight_text pypalettes plt.subplots() xlabel ylabel title legend colorbar savefig tight_layout grid set_xlim set_ylim plot scatter hist boxplot imshow cmap alpha bins tick_params annotate quiver contour barh stackplot subplots_adjust axhline axvline semilogx semilogy loglog polar streamplot hexbin pcolor tricontour errorbar clabel set_aspect violinplot set_axis_off spines text hatch plt axis plt.bar() plt.axis import figure pyplot highlight_text pypalettes plt.subplots() xlabel ylabel title legend colorbar savefig tight_layout grid set_xlim set_ylim plot scatter hist boxplot imshow cmap alpha bins tick_params annotate quiver contour barh stackplot subplots_adjust axhline axvline semilogx semilogy loglog polar streamplot hexbin pcolor tricontour errorbar clabel set_aspect violinplot set_axis_off spines text hatch plt axis plt.bar() plt.axis import figure pyplot highlight_text pypalettes plt.subplots() xlabel ylabel title legend colorbar savefig tight_layout grid set_xlim set_ylim plot scatter hist boxplot imshow cmap alpha bins tick_params annotate quiver contour barh stackplot subplots_adjust axhline axvline semilogx semilogy loglog polar streamplot hexbin pcolor tricontour errorbar clabel set_aspect violinplot set_axis_off spines text hatch plt axis plt.bar() plt.axis import figure pyplot highlight_text pypalettes plt.subplots() xlabel ylabel title legend colorbar savefig tight_layout grid set_xlim set_ylim plot scatter hist boxplot imshow cmap alpha bins tick_params annotate quiver contour barh stackplot subplots_adjust axhline axvline semilogx semilogy loglog polar streamplot hexbin pcolor tricontour errorbar clabel set_aspect violinplot set_axis_off spines text hatch plt axis plt.bar() plt.axis import figure pyplot highlight_text pypalettes plt.subplots() xlabel ylabel title legend colorbar savefig tight_layout grid set_xlim set_ylim plot scatter hist boxplot imshow cmap alpha bins tick_params annotate quiver contour barh stackplot subplots_adjust axhline axvline semilogx semilogy loglog polar streamplot hexbin pcolor tricontour errorbar clabel set_aspect violinplot set_axis_off spines text hatch plt axis plt.bar() plt.axis import figure pyplot highlight_text pypalettes plt.subplots() xlabel ylabel title legend colorbar savefig tight_layout grid set_xlim set_ylim plot scatter hist boxplot imshow cmap alpha bins tick_params annotate quiver contour barh stackplot subplots_adjust axhline axvline semilogx semilogy loglog polar streamplot hexbin pcolor tricontour errorbar clabel set_aspect violinplot set_axis_off spines text hatch plt axis plt.bar() plt.axis import figure pyplot highlight_text pypalettes plt.subplots() xlabel ylabel title legend colorbar savefig tight_layout grid set_xlim set_ylim plot scatter hist boxplot imshow cmap alpha bins tick_params annotate quiver contour barh stackplot subplots_adjust axhline axvline semilogx semilogy loglog polar streamplot hexbin pcolor tricontour errorbar clabel set_aspect violinplot set_axis_off spines text hatch plt axis plt.bar() plt.axis import figure pyplot highlight_text pypalettes plt.subplots() xlabel ylabel title legend colorbar savefig tight_layout grid set_xlim set_ylim plot scatter hist boxplot imshow cmap alpha bins tick_params annotate quiver contour barh stackplot subplots_adjust axhline axvline semilogx semilogy loglog polar streamplot hexbin pcolor tricontour errorbar clabel set_aspect violinplot set_axis_off spines text hatch plt axis plt.bar() plt.axis import figure pyplot highlight_text pypalettes plt.subplots() xlabel ylabel title legend colorbar savefig tight_layout grid set_xlim set_ylim plot scatter hist boxplot imshow cmap alpha bins tick_params annotate quiver contour barh stackplot subplots_adjust axhline axvline semilogx semilogy loglog polar streamplot hexbin pcolor tricontour errorbar clabel set_aspect violinplot set_axis_off spines text hatch plt axis plt.bar() plt.axis import figure pyplot highlight_text pypalettes plt.subplots() xlabel ylabel title legend colorbar savefig tight_layout grid set_xlim set_ylim plot scatter hist boxplot imshow cmap alpha bins tick_params annotate quiver contour barh stackplot subplots_adjust axhline axvline semilogx semilogy loglog polar streamplot hexbin pcolor tricontour errorbar clabel set_aspect violinplot set_axis_off spines text hatch plt axis plt.bar() plt.axis import figure pyplot highlight_text pypalettes plt.subplots() xlabel ylabel title legend colorbar savefig tight_layout grid set_xlim set_ylim plot scatter hist boxplot imshow cmap alpha bins tick_params annotate quiver contour barh stackplot subplots_adjust axhline axvline semilogx semilogy loglog polar streamplot hexbin pcolor tricontour errorbar clabel set_aspect violinplot set_axis_off spines text hatch plt axis plt.bar() plt.axis import figure pyplot highlight_text pypalettes plt.subplots() xlabel ylabel title legend colorbar savefig tight_layout grid set_xlim set_ylim plot scatter hist boxplot imshow cmap alpha bins tick_params annotate quiver contour barh stackplot subplots_adjust axhline axvline semilogx semilogy loglog polar streamplot hexbin pcolor tricontour errorbar clabel set_aspect violinplot set_axis_off spines text hatch plt axis plt.bar() plt.axis import figure pyplot highlight_text pypalettes plt.subplots() xlabel ylabel title legend colorbar savefig tight_layout grid set_xlim set_ylim plot scatter hist boxplot imshow cmap alpha bins tick_params annotate quiver contour barh stackplot subplots_adjust axhline axvline semilogx semilogy loglog polar streamplot hexbin pcolor tricontour errorbar clabel set_aspect violinplot set_axis_off spines text hatch plt axis plt.bar() plt.axis import figure pyplot highlight_text pypalettes plt.subplots() xlabel ylabel title legend colorbar savefig tight_layout grid set_xlim set_ylim plot scatter hist boxplot imshow cmap alpha bins tick_params annotate quiver contour barh stackplot subplots_adjust axhline axvline semilogx semilogy loglog polar streamplot hexbin pcolor tricontour errorbar clabel set_aspect violinplot set_axis_off spines text hatch plt axis plt.bar() plt.axis import figure pyplot highlight_text pypalettes plt.subplots() xlabel ylabel title legend colorbar savefig tight_layout grid set_xlim set_ylim plot scatter hist boxplot imshow cmap alpha bins tick_params annotate quiver contour barh stackplot subplots_adjust axhline axvline semilogx semilogy loglog polar streamplot hexbin pcolor tricontour errorbar clabel set_aspect violinplot set_axis_off spines text hatch plt axis plt.bar() plt.axis import figure pyplot highlight_text pypalettes plt.subplots() xlabel ylabel title legend colorbar savefig tight_layout grid set_xlim set_ylim plot scatter hist boxplot imshow cmap alpha bins tick_params annotate quiver contour barh stackplot subplots_adjust axhline axvline semilogx semilogy loglog polar streamplot hexbin pcolor tricontour errorbar clabel set_aspect violinplot set_axis_off spines text hatch plt axis plt.bar() plt.axis import figure pyplot highlight_text pypalettes plt.subplots() xlabel ylabel title legend colorbar savefig tight_layout grid set_xlim set_ylim plot scatter hist boxplot imshow cmap alpha bins tick_params annotate quiver contour barh stackplot subplots_adjust axhline axvline semilogx semilogy loglog polar streamplot hexbin pcolor tricontour errorbar clabel set_aspect violinplot set_axis_off spines text hatch plt axis plt.bar() plt.axis import figure pyplot highlight_text pypalettes plt.subplots() xlabel ylabel title legend colorbar savefig tight_layout grid set_xlim set_ylim plot scatter hist boxplot imshow cmap alpha bins tick_params annotate quiver contour barh stackplot subplots_adjust axhline axvline semilogx semilogy loglog polar streamplot hexbin pcolor tricontour errorbar clabel set_aspect violinplot set_axis_off spines text hatch plt axis plt.bar() plt.axis import figure pyplot highlight_text pypalettes plt.subplots() xlabel ylabel title legend colorbar savefig tight_layout grid set_xlim set_ylim plot scatter hist boxplot imshow cmap alpha bins tick_params annotate quiver contour barh stackplot subplots_adjust axhline axvline semilogx semilogy loglog polar streamplot hexbin pcolor tricontour errorbar clabel set_aspect violinplot set_axis_off spines text hatch plt axis plt.bar() plt.axis import figure pyplot highlight_text pypalettes plt.subplots() xlabel ylabel title legend colorbar savefig tight_layout grid set_xlim set_ylim plot scatter hist boxplot imshow cmap alpha bins tick_params annotate quiver contour barh stackplot subplots_adjust axhline axvline semilogx semilogy loglog polar streamplot hexbin pcolor tricontour errorbar clabel set_aspect violinplot set_axis_off spines text hatch plt axis plt.bar() plt.axis import figure pyplot highlight_text pypalettes plt.subplots() xlabel ylabel title legend colorbar savefig tight_layout grid set_xlim set_ylim plot scatter hist boxplot imshow cmap alpha bins tick_params annotate quiver contour barh stackplot subplots_adjust axhline axvline semilogx semilogy loglog polar streamplot hexbin pcolor tricontour errorbar clabel set_aspect violinplot set_axis_off spines text hatch plt axis plt.bar() plt.axis import figure pyplot highlight_text pypalettes plt.subplots() xlabel ylabel title legend colorbar savefig tight_layout grid set_xlim set_ylim plot scatter hist boxplot imshow cmap alpha bins tick_params annotate quiver contour barh stackplot subplots_adjust axhline axvline semilogx semilogy loglog polar streamplot hexbin pcolor tricontour errorbar clabel set_aspect violinplot set_axis_off spines text hatch plt axis plt.bar() plt.axis import figure pyplot highlight_text pypalettes plt.subplots() xlabel ylabel title legend colorbar savefig tight_layout grid set_xlim set_ylim plot scatter hist boxplot imshow cmap alpha bins tick_params annotate quiver contour barh stackplot subplots_adjust axhline axvline semilogx semilogy loglog polar streamplot hexbin pcolor tricontour errorbar clabel set_aspect violinplot set_axis_off spines text hatch plt axis plt.bar() plt.axis import figure pyplot highlight_text pypalettes plt.subplots() xlabel ylabel title legend colorbar savefig tight_layout grid set_xlim set_ylim plot scatter hist boxplot imshow cmap alpha bins tick_params annotate quiver contour barh stackplot subplots_adjust axhline axvline semilogx semilogy loglog polar streamplot hexbin pcolor tricontour errorbar clabel set_aspect violinplot set_axis_off spines text hatch plt axis plt.bar() plt.axis import figure pyplot highlight_text pypalettes plt.subplots() xlabel ylabel title legend colorbar savefig tight_layout grid set_xlim set_ylim plot scatter hist boxplot imshow cmap alpha bins tick_params annotate quiver contour barh stackplot subplots_adjust axhline axvline semilogx semilogy loglog polar streamplot hexbin pcolor tricontour errorbar clabel set_aspect violinplot set_axis_off spines text hatch plt axis plt.bar() plt.axis import figure pyplot highlight_text pypalettes plt.subplots() xlabel ylabel title legend colorbar savefig tight_layout grid set_xlim set_ylim plot scatter hist boxplot imshow cmap alpha bins tick_params annotate quiver contour barh stackplot subplots_adjust axhline axvline semilogx semilogy loglog polar streamplot hexbin pcolor tricontour errorbar clabel set_aspect violinplot set_axis_off spines text hatch plt axis plt.bar() plt.axis import figure pyplot highlight_text pypalettes plt.subplots() xlabel ylabel title legend colorbar savefig tight_layout grid set_xlim set_ylim plot scatter hist boxplot imshow cmap alpha bins tick_params annotate quiver contour barh stackplot subplots_adjust axhline axvline semilogx semilogy loglog polar streamplot hexbin pcolor tricontour errorbar clabel set_aspect violinplot set_axis_off spines text hatch plt axis plt.bar() plt.axis import figure pyplot highlight_text pypalettes plt.subplots() xlabel ylabel title legend colorbar savefig tight_layout grid set_xlim set_ylim plot scatter hist boxplot imshow cmap alpha bins tick_params annotate quiver contour barh stackplot subplots_adjust axhline axvline semilogx semilogy loglog polar streamplot hexbin pcolor tricontour errorbar clabel set_aspect violinplot set_axis_off spines text hatch plt axis plt.bar() plt.axis import figure pyplot highlight_text pypalettes plt.subplots() xlabel ylabel title legend colorbar savefig tight_layout grid set_xlim set_ylim plot scatter hist boxplot imshow cmap alpha bins tick_params annotate quiver contour barh stackplot subplots_adjust axhline axvline semilogx semilogy loglog polar streamplot hexbin pcolor tricontour errorbar clabel set_aspect violinplot set_axis_off spines text hatch plt axis plt.bar() plt.axis import figure pyplot highlight_text pypalettes plt.subplots() xlabel ylabel title legend colorbar savefig tight_layout grid set_xlim set_ylim plot scatter hist boxplot imshow cmap alpha bins tick_params annotate quiver contour barh stackplot subplots_adjust axhline axvline semilogx semilogy loglog polar streamplot hexbin pcolor tricontour errorbar clabel set_aspect violinplot set_axis_off spines text hatch plt axis plt.bar() plt.axis import figure pyplot highlight_text pypalettes plt.subplots() xlabel ylabel title legend colorbar savefig tight_layout grid set_xlim set_ylim plot scatter hist boxplot imshow cmap alpha bins tick_params annotate quiver contour barh stackplot subplots_adjust axhline axvline semilogx semilogy loglog polar streamplot hexbin pcolor tricontour errorbar clabel set_aspect violinplot set_axis_off spines text hatch plt axis plt.bar() plt.axis import figure pyplot highlight_text pypalettes plt.subplots() xlabel ylabel title legend colorbar savefig tight_layout grid set_xlim set_ylim plot scatter hist boxplot imshow cmap alpha bins tick_params annotate quiver contour barh stackplot subplots_adjust axhline axvline semilogx semilogy loglog polar streamplot hexbin pcolor tricontour errorbar clabel set_aspect violinplot set_axis_off spines text hatch plt axis plt.bar() plt.axis import figure pyplot highlight_text pypalettes plt.subplots() xlabel ylabel title legend colorbar savefig tight_layout grid set_xlim set_ylim plot scatter hist boxplot imshow cmap alpha bins tick_params annotate quiver contour barh stackplot subplots_adjust axhline axvline semilogx semilogy loglog polar streamplot hexbin pcolor tricontour errorbar clabel set_aspect violinplot set_axis_off spines text hatch plt axis plt.bar() plt.axis import figure pyplot highlight_text pypalettes plt.subplots() xlabel ylabel title legend colorbar savefig tight_layout grid set_xlim set_ylim plot scatter hist boxplot imshow cmap alpha bins tick_params annotate quiver contour barh stackplot subplots_adjust axhline axvline semilogx semilogy loglog polar streamplot hexbin pcolor tricontour errorbar clabel set_aspect violinplot set_axis_off spines text hatch plt axis plt.bar() plt.axis import figure pyplot highlight_text pypalettes plt.subplots() xlabel ylabel title legend colorbar savefig tight_layout grid set_xlim set_ylim plot scatter hist boxplot imshow cmap alpha bins tick_params annotate quiver contour barh stackplot subplots_adjust axhline axvline semilogx semilogy loglog polar streamplot hexbin pcolor tricontour errorbar clabel set_aspect violinplot set_axis_off spines text hatch plt axis plt.bar() plt.axis import figure pyplot highlight_text pypalettes plt.subplots() xlabel ylabel title legend colorbar savefig tight_layout grid set_xlim set_ylim plot scatter hist boxplot imshow cmap alpha bins tick_params annotate quiver contour barh stackplot subplots_adjust axhline axvline semilogx semilogy loglog polar streamplot hexbin pcolor tricontour errorbar clabel set_aspect violinplot set_axis_off spines text hatch plt axis plt.bar() plt.axis import figure pyplot highlight_text pypalettes plt.subplots() xlabel ylabel title legend colorbar savefig tight_layout grid set_xlim set_ylim plot scatter hist boxplot imshow cmap alpha bins tick_params annotate quiver contour barh stackplot subplots_adjust axhline axvline semilogx semilogy loglog polar streamplot hexbin pcolor tricontour errorbar clabel set_aspect violinplot set_axis_off spines text hatch plt axis plt.bar() plt.axis import figure pyplot highlight_text pypalettes plt.subplots() xlabel ylabel title legend colorbar savefig tight_layout grid set_xlim set_ylim plot scatter hist boxplot imshow cmap alpha bins tick_params annotate quiver contour barh stackplot subplots_adjust axhline axvline semilogx semilogy loglog polar streamplot hexbin pcolor tricontour errorbar clabel set_aspect violinplot set_axis_off spines text hatch plt axis plt.bar() plt.axis import figure pyplot highlight_text pypalettes plt.subplots() xlabel ylabel title legend colorbar savefig tight_layout grid set_xlim set_ylim plot scatter hist boxplot imshow cmap alpha bins tick_params annotate quiver contour barh stackplot subplots_adjust axhline axvline semilogx semilogy loglog polar streamplot hexbin pcolor tricontour errorbar clabel set_aspect violinplot set_axis_off spines text hatch plt axis plt.bar() plt.axis import figure pyplot highlight_text pypalettes plt.subplots() xlabel ylabel title legend colorbar savefig tight_layout grid set_xlim set_ylim plot scatter hist boxplot imshow cmap alpha bins tick_params annotate quiver contour barh stackplot subplots_adjust axhline axvline semilogx semilogy loglog polar streamplot hexbin pcolor tricontour errorbar clabel set_aspect violinplot set_axis_off spines text hatch plt axis plt.bar() plt.axis import figure pyplot highlight_text pypalettes plt.subplots() xlabel ylabel title legend colorbar savefig tight_layout grid set_xlim set_ylim plot scatter hist boxplot imshow cmap alpha bins tick_params annotate quiver contour barh stackplot subplots_adjust axhline axvline semilogx semilogy loglog polar streamplot hexbin pcolor tricontour errorbar clabel set_aspect violinplot set_axis_off spines text hatch plt axis plt.bar() plt.axis import figure pyplot highlight_text pypalettes plt.subplots() xlabel ylabel title legend colorbar savefig tight_layout grid set_xlim set_ylim plot scatter hist boxplot imshow cmap alpha bins tick_params annotate quiver contour barh stackplot subplots_adjust axhline axvline semilogx semilogy loglog polar streamplot hexbin pcolor tricontour errorbar clabel set_aspect violinplot set_axis_off spines text hatch plt axis plt.bar() plt.axis import figure pyplot highlight_text pypalettes plt.subplots() xlabel ylabel title legend colorbar savefig tight_layout grid set_xlim set_ylim plot scatter hist boxplot imshow cmap alpha bins tick_params annotate quiver contour barh stackplot subplots_adjust axhline axvline semilogx semilogy loglog polar streamplot hexbin pcolor tricontour errorbar clabel set_aspect violinplot set_axis_off spines text hatch plt axis plt.bar() plt.axis import figure pyplot highlight_text pypalettes plt.subplots() xlabel ylabel title legend colorbar savefig tight_layout grid set_xlim set_ylim plot scatter hist boxplot imshow cmap alpha bins tick_params annotate quiver contour barh stackplot subplots_adjust axhline axvline semilogx semilogy loglog polar streamplot hexbin pcolor tricontour errorbar clabel set_aspect violinplot set_axis_off spines text hatch plt axis plt.bar() plt.axis import figure pyplot highlight_text pypalettes plt.subplots() xlabel ylabel title legend colorbar savefig tight_layout grid set_xlim set_ylim plot scatter hist boxplot imshow cmap alpha bins tick_params annotate quiver contour barh stackplot subplots_adjust axhline axvline semilogx semilogy loglog polar streamplot hexbin pcolor tricontour errorbar clabel set_aspect violinplot set_axis_off spines text hatch plt axis plt.bar() plt.axis import figure pyplot highlight_text pypalettes plt.subplots() xlabel ylabel title legend colorbar savefig tight_layout grid set_xlim set_ylim plot scatter hist boxplot imshow cmap alpha bins tick_params annotate quiver contour barh stackplot subplots_adjust axhline axvline semilogx semilogy loglog polar streamplot hexbin pcolor tricontour errorbar clabel set_aspect violinplot set_axis_off spines text hatch plt axis plt.bar() plt.axis import figure pyplot highlight_text pypalettes plt.subplots() xlabel ylabel title legend colorbar savefig tight_layout grid set_xlim set_ylim plot scatter hist boxplot imshow cmap alpha bins tick_params annotate quiver contour barh stackplot subplots_adjust axhline axvline semilogx semilogy loglog polar streamplot hexbin pcolor tricontour errorbar clabel set_aspect violinplot set_axis_off spines text hatch plt axis plt.bar() plt.axis import figure pyplot highlight_text pypalettes plt.subplots() xlabel ylabel title legend colorbar savefig tight_layout grid set_xlim set_ylim plot scatter hist boxplot imshow cmap alpha bins tick_params annotate quiver contour barh stackplot subplots_adjust axhline axvline semilogx semilogy loglog polar streamplot hexbin pcolor tricontour errorbar clabel set_aspect violinplot set_axis_off spines text hatch plt axis plt.bar() plt.axis import figure pyplot highlight_text pypalettes plt.subplots() xlabel ylabel title legend colorbar savefig tight_layout grid set_xlim set_ylim plot scatter hist boxplot imshow cmap alpha bins tick_params annotate quiver contour barh stackplot subplots_adjust axhline axvline semilogx semilogy loglog polar streamplot hexbin pcolor tricontour errorbar clabel set_aspect violinplot set_axis_off spines text hatch plt axis plt.bar() plt.axis import figure pyplot highlight_text pypalettes plt.subplots() xlabel ylabel title legend colorbar savefig tight_layout grid set_xlim set_ylim plot scatter hist boxplot imshow cmap alpha bins tick_params annotate quiver contour barh stackplot subplots_adjust axhline axvline semilogx semilogy loglog polar streamplot hexbin pcolor tricontour errorbar clabel set_aspect violinplot set_axis_off spines text hatch plt axis plt.bar() plt.axis import figure pyplot highlight_text pypalettes plt.subplots() xlabel ylabel title legend colorbar savefig tight_layout grid set_xlim set_ylim plot scatter hist boxplot imshow cmap alpha bins tick_params annotate quiver contour barh stackplot subplots_adjust axhline axvline semilogx semilogy loglog polar streamplot hexbin pcolor tricontour errorbar clabel set_aspect violinplot set_axis_off spines text hatch plt axis plt.bar() plt.axis import figure pyplot highlight_text pypalettes plt.subplots() xlabel ylabel title legend colorbar savefig tight_layout grid set_xlim set_ylim plot scatter hist boxplot imshow cmap alpha bins tick_params annotate quiver contour barh stackplot subplots_adjust axhline axvline semilogx semilogy loglog polar streamplot hexbin pcolor tricontour errorbar clabel set_aspect violinplot set_axis_off spines text hatch plt axis plt.bar() plt.axis import figure pyplot highlight_text pypalettes plt.subplots() xlabel ylabel title legend colorbar savefig tight_layout grid set_xlim set_ylim plot scatter hist boxplot imshow cmap alpha bins tick_params annotate quiver contour barh stackplot subplots_adjust axhline axvline semilogx semilogy loglog polar streamplot hexbin pcolor tricontour errorbar clabel set_aspect violinplot set_axis_off spines text hatch plt axis plt.bar() plt.axis import figure pyplot highlight_text pypalettes plt.subplots() xlabel ylabel title legend colorbar savefig tight_layout grid set_xlim set_ylim plot scatter hist boxplot imshow cmap alpha bins tick_params annotate quiver contour barh stackplot subplots_adjust axhline axvline semilogx semilogy loglog polar streamplot hexbin pcolor tricontour errorbar clabel set_aspect violinplot set_axis_off spines text hatch plt axis plt.bar() plt.axis import figure pyplot highlight_text pypalettes plt.subplots() xlabel ylabel title legend colorbar savefig tight_layout grid set_xlim set_ylim plot scatter hist boxplot imshow cmap alpha bins tick_params annotate quiver contour barh stackplot subplots_adjust axhline axvline semilogx semilogy loglog polar streamplot hexbin pcolor tricontour errorbar clabel set_aspect violinplot set_axis_off spines text hatch plt axis plt.bar() plt.axis import figure pyplot highlight_text pypalettes plt.subplots() xlabel ylabel title legend colorbar savefig tight_layout grid set_xlim set_ylim plot scatter hist boxplot imshow cmap alpha bins tick_params annotate quiver contour barh stackplot subplots_adjust axhline axvline semilogx semilogy loglog polar streamplot hexbin pcolor tricontour errorbar clabel set_aspect violinplot set_axis_off spines text hatch plt axis plt.bar() plt.axis import figure pyplot highlight_text pypalettes plt.subplots() xlabel ylabel title legend colorbar savefig tight_layout grid set_xlim set_ylim plot scatter hist boxplot imshow cmap alpha bins tick_params annotate quiver contour barh stackplot subplots_adjust axhline axvline semilogx semilogy loglog polar streamplot hexbin pcolor tricontour errorbar clabel set_aspect violinplot set_axis_off spines text hatch plt axis plt.bar() plt.axis import figure pyplot highlight_text pypalettes plt.subplots() xlabel ylabel title legend colorbar savefig tight_layout grid set_xlim set_ylim plot scatter hist boxplot imshow cmap alpha bins tick_params annotate quiver contour barh stackplot subplots_adjust axhline axvline semilogx semilogy loglog polar streamplot hexbin pcolor tricontour errorbar clabel set_aspect violinplot set_axis_off spines text hatch plt axis plt.bar() plt.axis import figure pyplot highlight_text pypalettes plt.subplots() xlabel ylabel title legend colorbar savefig tight_layout grid set_xlim set_ylim plot scatter hist boxplot imshow cmap alpha bins tick_params annotate quiver contour barh stackplot subplots_adjust axhline axvline semilogx semilogy loglog polar streamplot hexbin pcolor tricontour errorbar clabel set_aspect violinplot set_axis_off spines text hatch plt axis plt.bar() plt.axis import figure pyplot highlight_text pypalettes plt.subplots() xlabel ylabel title legend colorbar savefig tight_layout grid set_xlim set_ylim plot scatter hist boxplot imshow cmap alpha bins tick_params annotate quiver contour barh stackplot subplots_adjust axhline axvline semilogx semilogy loglog polar streamplot hexbin pcolor tricontour errorbar clabel set_aspect violinplot set_axis_off spines text hatch plt axis plt.bar() plt.axis import figure pyplot highlight_text pypalettes plt.subplots() xlabel ylabel title legend colorbar savefig tight_layout grid set_xlim set_ylim plot scatter hist boxplot imshow cmap alpha bins tick_params annotate quiver contour barh stackplot subplots_adjust axhline axvline semilogx semilogy loglog polar streamplot hexbin pcolor tricontour errorbar clabel set_aspect violinplot set_axis_off spines text hatch plt axis plt.bar() plt.axis import figure pyplot highlight_text pypalettes plt.subplots() xlabel ylabel title legend colorbar savefig tight_layout grid set_xlim set_ylim plot scatter hist boxplot imshow cmap alpha bins tick_params annotate quiver contour barh stackplot subplots_adjust axhline axvline semilogx semilogy loglog polar streamplot hexbin pcolor tricontour errorbar clabel set_aspect violinplot set_axis_off spines text hatch plt axis plt.bar() plt.axis import figure pyplot highlight_text pypalettes plt.subplots() xlabel ylabel title legend colorbar savefig tight_layout grid set_xlim set_ylim plot scatter hist boxplot imshow cmap alpha bins tick_params annotate quiver contour barh stackplot subplots_adjust axhline axvline semilogx semilogy loglog polar streamplot hexbin pcolor tricontour errorbar clabel set_aspect violinplot set_axis_off spines text hatch plt axis plt.bar() plt.axis import figure pyplot highlight_text pypalettes plt.subplots() xlabel ylabel title legend colorbar savefig tight_layout grid set_xlim set_ylim plot scatter hist boxplot imshow cmap alpha bins tick_params annotate quiver contour barh stackplot subplots_adjust axhline axvline semilogx semilogy loglog polar streamplot hexbin pcolor tricontour errorbar clabel set_aspect violinplot set_axis_off spines text hatch plt axis plt.bar() plt.axis import figure pyplot highlight_text pypalettes plt.subplots() xlabel ylabel title legend colorbar savefig tight_layout grid set_xlim set_ylim plot scatter hist boxplot imshow cmap alpha bins tick_params annotate quiver contour barh stackplot subplots_adjust axhline axvline semilogx semilogy loglog polar streamplot hexbin pcolor tricontour errorbar clabel set_aspect violinplot set_axis_off spines text hatch plt axis plt.bar() plt.axis import figure pyplot highlight_text pypalettes plt.subplots() xlabel ylabel title legend colorbar savefig tight_layout grid set_xlim set_ylim plot scatter hist boxplot imshow cmap alpha bins tick_params annotate quiver contour barh stackplot subplots_adjust axhline axvline semilogx semilogy loglog polar streamplot hexbin pcolor tricontour errorbar clabel set_aspect violinplot set_axis_off spines text hatch plt axis plt.bar() plt.axis import figure pyplot highlight_text pypalettes plt.subplots() xlabel ylabel title legend colorbar savefig tight_layout grid set_xlim set_ylim plot scatter hist boxplot imshow cmap alpha bins tick_params annotate quiver contour barh stackplot subplots_adjust axhline axvline semilogx semilogy loglog polar streamplot hexbin pcolor tricontour errorbar clabel set_aspect violinplot set_axis_off spines text hatch plt axis plt.bar() plt.axis import figure pyplot highlight_text pypalettes plt.subplots() xlabel ylabel title legend colorbar savefig tight_layout grid set_xlim set_ylim plot scatter hist boxplot imshow cmap alpha bins tick_params annotate quiver contour barh stackplot subplots_adjust axhline axvline semilogx semilogy loglog polar streamplot hexbin pcolor tricontour errorbar clabel set_aspect violinplot set_axis_off spines text hatch plt axis plt.bar() plt.axis import figure pyplot highlight_text pypalettes plt.subplots() xlabel ylabel title legend colorbar savefig tight_layout grid set_xlim set_ylim plot scatter hist boxplot imshow cmap alpha bins tick_params annotate quiver contour barh stackplot subplots_adjust axhline axvline semilogx semilogy loglog polar streamplot hexbin pcolor tricontour errorbar clabel set_aspect violinplot set_axis_off spines text hatch plt axis plt.bar() plt.axis import figure pyplot highlight_text pypalettes plt.subplots() xlabel ylabel title legend colorbar savefig tight_layout grid set_xlim set_ylim plot scatter hist boxplot imshow cmap alpha bins tick_params annotate quiver contour barh stackplot subplots_adjust axhline axvline semilogx semilogy loglog polar streamplot hexbin pcolor tricontour errorbar clabel set_aspect violinplot set_axis_off spines text hatch plt axis plt.bar() plt.axis import figure pyplot highlight_text pypalettes plt.subplots() xlabel ylabel title legend colorbar savefig tight_layout grid set_xlim set_ylim plot scatter hist boxplot imshow cmap alpha bins tick_params annotate quiver contour barh stackplot subplots_adjust axhline axvline semilogx semilogy loglog polar streamplot hexbin pcolor tricontour errorbar clabel set_aspect violinplot set_axis_off spines text hatch plt axis plt.bar() plt.axis import figure pyplot highlight_text pypalettes plt.subplots() xlabel ylabel title legend colorbar savefig tight_layout grid set_xlim set_ylim plot scatter hist boxplot imshow cmap alpha bins tick_params annotate quiver contour barh stackplot subplots_adjust axhline axvline semilogx semilogy loglog polar streamplot hexbin pcolor tricontour errorbar clabel set_aspect violinplot set_axis_off spines text hatch plt axis plt.bar() plt.axis import figure pyplot highlight_text pypalettes plt.subplots() xlabel ylabel title legend colorbar savefig tight_layout grid set_xlim set_ylim plot scatter hist boxplot imshow cmap alpha bins tick_params annotate quiver contour barh stackplot subplots_adjust axhline axvline semilogx semilogy loglog polar streamplot hexbin pcolor tricontour errorbar clabel set_aspect violinplot set_axis_off spines text hatch plt axis plt.bar() plt.axis import figure pyplot highlight_text pypalettes plt.subplots() xlabel ylabel title legend colorbar savefig tight_layout grid set_xlim set_ylim plot scatter hist boxplot imshow cmap alpha bins tick_params annotate quiver contour barh stackplot subplots_adjust axhline axvline semilogx semilogy loglog polar streamplot hexbin pcolor tricontour errorbar clabel set_aspect violinplot set_axis_off spines text hatch plt axis plt.bar() plt.axis import figure pyplot highlight_text pypalettes plt.subplots() xlabel ylabel title legend colorbar savefig tight_layout grid set_xlim set_ylim plot scatter hist boxplot imshow cmap alpha bins tick_params annotate quiver contour barh stackplot subplots_adjust axhline axvline semilogx semilogy loglog polar streamplot hexbin pcolor tricontour errorbar clabel set_aspect violinplot set_axis_off spines text hatch plt axis plt.bar() plt.axis import figure pyplot highlight_text pypalettes plt.subplots() xlabel ylabel title legend colorbar savefig tight_layout grid set_xlim set_ylim plot scatter hist boxplot imshow cmap alpha bins tick_params annotate quiver contour barh stackplot subplots_adjust axhline axvline semilogx semilogy loglog polar streamplot hexbin pcolor tricontour errorbar clabel set_aspect violinplot set_axis_off spines text hatch plt axis plt.bar() plt.axis import figure pyplot highlight_text pypalettes plt.subplots() xlabel ylabel title legend colorbar savefig tight_layout grid set_xlim set_ylim plot scatter hist boxplot imshow cmap alpha bins tick_params annotate quiver contour barh stackplot subplots_adjust axhline axvline semilogx semilogy loglog polar streamplot hexbin pcolor tricontour errorbar clabel set_aspect violinplot set_axis_off spines text hatch plt axis plt.bar() plt.axis import figure pyplot highlight_text pypalettes plt.subplots() xlabel ylabel title legend colorbar savefig tight_layout grid set_xlim set_ylim plot scatter hist boxplot imshow cmap alpha bins tick_params annotate quiver contour barh stackplot subplots_adjust axhline axvline semilogx semilogy loglog polar streamplot hexbin pcolor tricontour errorbar clabel set_aspect violinplot set_axis_off spines text hatch plt axis plt.bar() plt.axis import figure pyplot highlight_text pypalettes plt.subplots() xlabel ylabel title legend colorbar savefig tight_layout grid set_xlim set_ylim plot scatter hist boxplot imshow cmap alpha bins tick_params annotate quiver contour barh stackplot subplots_adjust axhline axvline semilogx semilogy loglog polar streamplot hexbin pcolor tricontour errorbar clabel set_aspect violinplot set_axis_off spines text hatch plt axis plt.bar() plt.axis import figure pyplot highlight_text pypalettes plt.subplots() xlabel ylabel title legend colorbar savefig tight_layout grid set_xlim set_ylim plot scatter hist boxplot imshow cmap alpha bins tick_params annotate quiver contour barh stackplot subplots_adjust axhline axvline semilogx semilogy loglog polar streamplot hexbin pcolor tricontour errorbar clabel set_aspect violinplot set_axis_off spines text hatch plt axis plt.bar() plt.axis import figure pyplot highlight_text pypalettes plt.subplots() xlabel ylabel title legend colorbar savefig tight_layout grid set_xlim set_ylim plot scatter hist boxplot imshow cmap alpha bins tick_params annotate quiver contour barh stackplot subplots_adjust axhline axvline semilogx semilogy loglog polar streamplot hexbin pcolor tricontour errorbar clabel set_aspect violinplot set_axis_off spines text hatch plt axis plt.bar() plt.axis import figure pyplot highlight_text pypalettes plt.subplots() xlabel ylabel title legend colorbar savefig tight_layout grid set_xlim set_ylim plot scatter hist boxplot imshow cmap alpha bins tick_params annotate quiver contour barh stackplot subplots_adjust axhline axvline semilogx semilogy loglog polar streamplot hexbin pcolor tricontour errorbar clabel set_aspect violinplot set_axis_off spines text hatch plt axis plt.bar() plt.axis import figure pyplot highlight_text pypalettes plt.subplots() xlabel ylabel title legend colorbar savefig tight_layout grid set_xlim set_ylim plot scatter hist boxplot imshow cmap alpha bins tick_params annotate quiver contour barh stackplot subplots_adjust axhline axvline semilogx semilogy loglog polar streamplot hexbin pcolor tricontour errorbar clabel set_aspect violinplot set_axis_off spines text hatch plt axis plt.bar() plt.axis import figure pyplot highlight_text pypalettes plt.subplots() xlabel ylabel title legend colorbar savefig tight_layout grid set_xlim set_ylim plot scatter hist boxplot imshow cmap alpha bins tick_params annotate quiver contour barh stackplot subplots_adjust axhline axvline semilogx semilogy loglog polar streamplot hexbin pcolor tricontour errorbar clabel set_aspect violinplot set_axis_off spines text hatch plt axis plt.bar() plt.axis import figure pyplot highlight_text pypalettes plt.subplots() xlabel ylabel title legend colorbar savefig tight_layout grid set_xlim set_ylim plot scatter hist boxplot imshow cmap alpha bins tick_params annotate quiver contour barh stackplot subplots_adjust axhline axvline semilogx semilogy loglog polar streamplot hexbin pcolor tricontour errorbar clabel set_aspect violinplot set_axis_off spines text hatch plt axis plt.bar() plt.axis import figure pyplot highlight_text pypalettes plt.subplots() xlabel ylabel title legend colorbar savefig tight_layout grid set_xlim set_ylim plot scatter hist boxplot imshow cmap alpha bins tick_params annotate quiver contour barh stackplot subplots_adjust axhline axvline semilogx semilogy loglog polar streamplot hexbin pcolor tricontour errorbar clabel set_aspect violinplot set_axis_off spines text hatch plt axis plt.bar() plt.axis import figure pyplot highlight_text pypalettes plt.subplots() xlabel ylabel title legend colorbar savefig tight_layout grid set_xlim set_ylim plot scatter hist boxplot imshow cmap alpha bins tick_params annotate quiver contour barh stackplot subplots_adjust axhline axvline semilogx semilogy loglog polar streamplot hexbin pcolor tricontour errorbar clabel set_aspect violinplot set_axis_off spines text hatch plt axis plt.bar() plt.axis import figure pyplot highlight_text pypalettes plt.subplots() xlabel ylabel title legend colorbar savefig tight_layout grid set_xlim set_ylim plot scatter hist boxplot imshow cmap alpha bins tick_params annotate quiver contour barh stackplot subplots_adjust axhline axvline semilogx semilogy loglog polar streamplot hexbin pcolor tricontour errorbar clabel set_aspect violinplot set_axis_off spines text hatch plt axis plt.bar() plt.axis import figure pyplot highlight_text pypalettes plt.subplots() xlabel ylabel title legend colorbar savefig tight_layout grid set_xlim set_ylim plot scatter hist boxplot imshow cmap alpha bins tick_params annotate quiver contour barh stackplot subplots_adjust axhline axvline semilogx semilogy loglog polar streamplot hexbin pcolor tricontour errorbar clabel set_aspect violinplot set_axis_off spines text hatch plt axis plt.bar() plt.axis import figure pyplot highlight_text pypalettes plt.subplots() xlabel ylabel title legend colorbar savefig tight_layout grid set_xlim set_ylim plot scatter hist boxplot imshow cmap alpha bins tick_params annotate quiver contour barh stackplot subplots_adjust axhline axvline semilogx semilogy loglog polar streamplot hexbin pcolor tricontour errorbar clabel set_aspect violinplot set_axis_off spines text hatch plt axis plt.bar() plt.axis import figure pyplot highlight_text pypalettes plt.subplots() xlabel ylabel title legend colorbar savefig tight_layout grid set_xlim set_ylim plot scatter hist boxplot imshow cmap alpha bins tick_params annotate quiver contour barh stackplot subplots_adjust axhline axvline semilogx semilogy loglog polar streamplot hexbin pcolor tricontour errorbar clabel set_aspect violinplot set_axis_off spines text hatch plt axis plt.bar() plt.axis import figure pyplot highlight_text pypalettes plt.subplots() xlabel ylabel title legend colorbar savefig tight_layout grid set_xlim set_ylim plot scatter hist boxplot imshow cmap alpha bins tick_params annotate quiver contour barh stackplot subplots_adjust axhline axvline semilogx semilogy loglog polar streamplot hexbin pcolor tricontour errorbar clabel set_aspect violinplot set_axis_off spines text hatch plt axis plt.bar() plt.axis import figure pyplot highlight_text pypalettes plt.subplots() xlabel ylabel title legend colorbar savefig tight_layout grid set_xlim set_ylim plot scatter hist boxplot imshow cmap alpha bins tick_params annotate quiver contour barh stackplot subplots_adjust axhline axvline semilogx semilogy loglog polar streamplot hexbin pcolor tricontour errorbar clabel set_aspect violinplot set_axis_off spines text hatch plt axis plt.bar() plt.axis import figure pyplot highlight_text pypalettes plt.subplots() xlabel ylabel title legend colorbar savefig tight_layout grid set_xlim set_ylim plot scatter hist boxplot imshow cmap alpha bins tick_params annotate quiver contour barh stackplot subplots_adjust axhline axvline semilogx semilogy loglog polar streamplot hexbin pcolor tricontour errorbar clabel set_aspect violinplot set_axis_off spines text hatch plt axis plt.bar() plt.axis import figure pyplot highlight_text pypalettes plt.subplots() xlabel ylabel title legend colorbar savefig tight_layout grid set_xlim set_ylim plot scatter hist boxplot imshow cmap alpha bins tick_params annotate quiver contour barh stackplot subplots_adjust axhline axvline semilogx semilogy loglog polar streamplot hexbin pcolor tricontour errorbar clabel set_aspect violinplot set_axis_off spines text hatch plt axis plt.bar() plt.axis import figure pyplot highlight_text pypalettes plt.subplots() xlabel ylabel title legend colorbar savefig tight_layout grid set_xlim set_ylim plot scatter hist boxplot imshow cmap alpha bins tick_params annotate quiver contour barh stackplot subplots_adjust axhline axvline semilogx semilogy loglog polar streamplot hexbin pcolor tricontour errorbar clabel set_aspect violinplot set_axis_off spines text hatch plt axis plt.bar() plt.axis import figure pyplot highlight_text pypalettes plt.subplots() xlabel ylabel title legend colorbar savefig tight_layout grid set_xlim set_ylim plot scatter hist boxplot imshow cmap alpha bins tick_params annotate quiver contour barh stackplot subplots_adjust axhline axvline semilogx semilogy loglog polar streamplot hexbin pcolor tricontour errorbar clabel set_aspect violinplot set_axis_off spines text hatch plt axis plt.bar() plt.axis import figure pyplot highlight_text pypalettes plt.subplots() xlabel ylabel title legend colorbar savefig tight_layout grid set_xlim set_ylim plot scatter hist boxplot imshow cmap alpha bins tick_params annotate quiver contour barh stackplot subplots_adjust axhline axvline semilogx semilogy loglog polar streamplot hexbin pcolor tricontour errorbar clabel set_aspect violinplot set_axis_off spines text hatch plt axis plt.bar() plt.axis import figure pyplot highlight_text pypalettes plt.subplots() xlabel ylabel title legend colorbar savefig tight_layout grid set_xlim set_ylim plot scatter hist boxplot imshow cmap alpha bins tick_params annotate quiver contour barh stackplot subplots_adjust axhline axvline semilogx semilogy loglog polar streamplot hexbin pcolor tricontour errorbar clabel set_aspect violinplot set_axis_off spines text hatch plt axis plt.bar() plt.axis import figure pyplot highlight_text pypalettes plt.subplots() xlabel ylabel title legend colorbar savefig tight_layout grid set_xlim set_ylim plot scatter hist boxplot imshow cmap alpha bins tick_params annotate quiver contour barh stackplot subplots_adjust axhline axvline semilogx semilogy loglog polar streamplot hexbin pcolor tricontour errorbar clabel set_aspect violinplot set_axis_off spines text hatch plt axis plt.bar() plt.axis import figure pyplot highlight_text pypalettes plt.subplots() xlabel ylabel title legend colorbar savefig tight_layout grid set_xlim set_ylim plot scatter hist boxplot imshow cmap alpha bins tick_params annotate quiver contour barh stackplot subplots_adjust axhline axvline semilogx semilogy loglog polar streamplot hexbin pcolor tricontour errorbar clabel set_aspect violinplot set_axis_off spines text hatch plt axis plt.bar() plt.axis import figure pyplot highlight_text pypalettes plt.subplots() xlabel ylabel title legend colorbar savefig tight_layout grid set_xlim set_ylim plot scatter hist boxplot imshow cmap alpha bins tick_params annotate quiver contour barh stackplot subplots_adjust axhline axvline semilogx semilogy loglog polar streamplot hexbin pcolor tricontour errorbar clabel set_aspect violinplot set_axis_off spines text hatch plt axis plt.bar() plt.axis import figure pyplot highlight_text pypalettes plt.subplots() xlabel ylabel title legend colorbar savefig tight_layout grid set_xlim set_ylim plot scatter hist boxplot imshow cmap alpha bins tick_params annotate quiver contour barh stackplot subplots_adjust axhline axvline semilogx semilogy loglog polar streamplot hexbin pcolor tricontour errorbar clabel set_aspect violinplot set_axis_off spines text hatch plt axis plt.bar() plt.axis import figure pyplot highlight_text pypalettes plt.subplots() xlabel ylabel title legend colorbar savefig tight_layout grid set_xlim set_ylim plot scatter hist boxplot imshow cmap alpha bins tick_params annotate quiver contour barh stackplot subplots_adjust axhline axvline semilogx semilogy loglog polar streamplot hexbin pcolor tricontour errorbar clabel set_aspect violinplot set_axis_off spines text hatch plt axis plt.bar() plt.axis import figure pyplot highlight_text pypalettes plt.subplots() xlabel ylabel title legend colorbar savefig tight_layout grid set_xlim set_ylim plot scatter hist boxplot imshow cmap alpha bins tick_params annotate quiver contour barh stackplot subplots_adjust axhline axvline semilogx semilogy loglog polar streamplot hexbin pcolor tricontour errorbar clabel set_aspect violinplot set_axis_off spines text hatch plt axis plt.bar() plt.axis import figure pyplot highlight_text pypalettes plt.subplots() xlabel ylabel title legend colorbar savefig tight_layout grid set_xlim set_ylim plot scatter hist boxplot imshow cmap alpha bins tick_params annotate quiver contour barh stackplot subplots_adjust axhline axvline semilogx semilogy loglog polar streamplot hexbin pcolor tricontour errorbar clabel set_aspect violinplot set_axis_off spines text hatch
plt axis plt.bar() plt.axis import figure pyplot highlight_text pypalettes plt.subplots() xlabel ylabel title legend colorbar savefig tight_layout grid set_xlim set_ylim plot scatter hist boxplot imshow cmap alpha bins tick_params annotate quiver contour barh stackplot subplots_adjust axhline axvline semilogx semilogy loglog polar streamplot hexbin pcolor tricontour errorbar clabel set_aspect violinplot set_axis_off spines text hatch plt axis plt.bar() plt.axis import figure pyplot highlight_text pypalettes plt.subplots() xlabel ylabel title legend colorbar savefig tight_layout grid set_xlim set_ylim plot scatter hist boxplot imshow cmap alpha bins tick_params annotate quiver contour barh stackplot subplots_adjust axhline axvline semilogx semilogy loglog polar streamplot hexbin pcolor tricontour errorbar clabel set_aspect violinplot set_axis_off spines text hatch plt axis plt.bar() plt.axis import figure pyplot highlight_text pypalettes plt.subplots() xlabel ylabel title legend colorbar savefig tight_layout grid set_xlim set_ylim plot scatter hist boxplot imshow cmap alpha bins tick_params annotate quiver contour barh stackplot subplots_adjust axhline axvline semilogx semilogy loglog polar streamplot hexbin pcolor tricontour errorbar clabel set_aspect violinplot set_axis_off spines text hatch plt axis plt.bar() plt.axis import figure pyplot highlight_text pypalettes plt.subplots() xlabel ylabel title legend colorbar savefig tight_layout grid set_xlim set_ylim plot scatter hist boxplot imshow cmap alpha bins tick_params annotate quiver contour barh stackplot subplots_adjust axhline axvline semilogx semilogy loglog polar streamplot hexbin pcolor tricontour errorbar clabel set_aspect violinplot set_axis_off spines text hatch plt axis plt.bar() plt.axis import figure pyplot highlight_text pypalettes plt.subplots() xlabel ylabel title legend colorbar savefig tight_layout grid set_xlim set_ylim plot scatter hist boxplot imshow cmap alpha bins tick_params annotate quiver contour barh stackplot subplots_adjust axhline axvline semilogx semilogy loglog polar streamplot hexbin pcolor tricontour errorbar clabel set_aspect violinplot set_axis_off spines text hatch plt axis plt.bar() plt.axis import figure pyplot highlight_text pypalettes plt.subplots() xlabel ylabel title legend colorbar savefig tight_layout grid set_xlim set_ylim plot scatter hist boxplot imshow cmap alpha bins tick_params annotate quiver contour barh stackplot subplots_adjust axhline axvline semilogx semilogy loglog polar streamplot hexbin pcolor tricontour errorbar clabel set_aspect violinplot set_axis_off spines text hatch plt axis plt.bar() plt.axis import figure pyplot highlight_text pypalettes plt.subplots() xlabel ylabel title legend colorbar savefig tight_layout grid set_xlim set_ylim plot scatter hist boxplot imshow cmap alpha bins tick_params annotate quiver contour barh stackplot subplots_adjust axhline axvline semilogx semilogy loglog polar streamplot hexbin pcolor tricontour errorbar clabel set_aspect violinplot set_axis_off spines text hatch plt axis plt.bar() plt.axis import figure pyplot highlight_text pypalettes plt.subplots() xlabel ylabel title legend colorbar savefig tight_layout grid set_xlim set_ylim plot scatter hist boxplot imshow cmap alpha bins tick_params annotate quiver contour barh stackplot subplots_adjust axhline axvline semilogx semilogy loglog polar streamplot hexbin pcolor tricontour errorbar clabel set_aspect violinplot set_axis_off spines text hatch plt axis plt.bar() plt.axis import figure pyplot highlight_text pypalettes plt.subplots() xlabel ylabel title legend colorbar savefig tight_layout grid set_xlim set_ylim plot scatter hist boxplot imshow cmap alpha bins tick_params annotate quiver contour barh stackplot subplots_adjust axhline axvline semilogx semilogy loglog polar streamplot hexbin pcolor tricontour errorbar clabel set_aspect violinplot set_axis_off spines text hatch plt axis plt.bar() plt.axis import figure pyplot highlight_text pypalettes plt.subplots() xlabel ylabel title legend colorbar savefig tight_layout grid set_xlim set_ylim plot scatter hist boxplot imshow cmap alpha bins tick_params annotate quiver contour barh stackplot subplots_adjust axhline axvline semilogx semilogy loglog polar streamplot hexbin pcolor tricontour errorbar clabel set_aspect violinplot set_axis_off spines text hatch plt axis plt.bar() plt.axis import figure pyplot highlight_text pypalettes plt.subplots() xlabel ylabel title legend colorbar savefig tight_layout grid set_xlim set_ylim plot scatter hist boxplot imshow cmap alpha bins tick_params annotate quiver contour barh stackplot subplots_adjust axhline axvline semilogx semilogy loglog polar streamplot hexbin pcolor tricontour errorbar clabel set_aspect violinplot set_axis_off spines text hatch plt axis plt.bar() plt.axis import figure pyplot highlight_text pypalettes plt.subplots() xlabel ylabel title legend colorbar savefig tight_layout grid set_xlim set_ylim plot scatter hist boxplot imshow cmap alpha bins tick_params annotate quiver contour barh stackplot subplots_adjust axhline axvline semilogx semilogy loglog polar streamplot hexbin pcolor tricontour errorbar clabel set_aspect violinplot set_axis_off spines text hatch plt axis plt.bar() plt.axis import figure pyplot highlight_text pypalettes plt.subplots() xlabel ylabel title legend colorbar savefig tight_layout grid set_xlim set_ylim plot scatter hist boxplot imshow cmap alpha bins tick_params annotate quiver contour barh stackplot subplots_adjust axhline axvline semilogx semilogy loglog polar streamplot hexbin pcolor tricontour errorbar clabel set_aspect violinplot set_axis_off spines text hatch plt axis plt.bar() plt.axis import figure pyplot highlight_text pypalettes plt.subplots() xlabel ylabel title legend colorbar savefig tight_layout grid set_xlim set_ylim plot scatter hist boxplot imshow cmap alpha bins tick_params annotate quiver contour barh stackplot subplots_adjust axhline axvline semilogx semilogy loglog polar streamplot hexbin pcolor tricontour errorbar clabel set_aspect violinplot set_axis_off spines text hatch plt axis plt.bar() plt.axis import figure pyplot highlight_text pypalettes plt.subplots() xlabel ylabel title legend colorbar savefig tight_layout grid set_xlim set_ylim plot scatter hist boxplot imshow cmap alpha bins tick_params annotate quiver contour barh stackplot subplots_adjust axhline axvline semilogx semilogy loglog polar streamplot hexbin pcolor tricontour errorbar clabel set_aspect violinplot set_axis_off spines text hatch plt axis plt.bar() plt.axis import figure pyplot highlight_text pypalettes plt.subplots() xlabel ylabel title legend colorbar savefig tight_layout grid set_xlim set_ylim plot scatter hist boxplot imshow cmap alpha bins tick_params annotate quiver contour barh stackplot subplots_adjust axhline axvline semilogx semilogy loglog polar streamplot hexbin pcolor tricontour errorbar clabel set_aspect violinplot set_axis_off spines text hatch plt axis plt.bar() plt.axis import figure pyplot highlight_text pypalettes plt.subplots() xlabel ylabel title legend colorbar savefig tight_layout grid set_xlim set_ylim plot scatter hist boxplot imshow cmap alpha bins tick_params annotate quiver contour barh stackplot subplots_adjust axhline axvline semilogx semilogy loglog polar streamplot hexbin pcolor tricontour errorbar clabel set_aspect violinplot set_axis_off spines text hatch plt axis plt.bar() plt.axis import figure pyplot highlight_text pypalettes plt.subplots() xlabel ylabel title legend colorbar savefig tight_layout grid set_xlim set_ylim plot scatter hist boxplot imshow cmap alpha bins tick_params annotate quiver contour barh stackplot subplots_adjust axhline axvline semilogx semilogy loglog polar streamplot hexbin pcolor tricontour errorbar clabel set_aspect violinplot set_axis_off spines text hatch plt axis plt.bar() plt.axis import figure pyplot highlight_text pypalettes plt.subplots() xlabel ylabel title legend colorbar savefig tight_layout grid set_xlim set_ylim plot scatter hist boxplot imshow cmap alpha bins tick_params annotate quiver contour barh stackplot subplots_adjust axhline axvline semilogx semilogy loglog polar streamplot hexbin pcolor tricontour errorbar clabel set_aspect violinplot set_axis_off spines text hatch plt axis plt.bar() plt.axis import figure pyplot highlight_text pypalettes plt.subplots() xlabel ylabel title legend colorbar savefig tight_layout grid set_xlim set_ylim plot scatter hist boxplot imshow cmap alpha bins tick_params annotate quiver contour barh stackplot subplots_adjust axhline axvline semilogx semilogy loglog polar streamplot hexbin pcolor tricontour errorbar clabel set_aspect violinplot set_axis_off spines text hatch plt axis plt.bar() plt.axis import figure pyplot highlight_text pypalettes plt.subplots() xlabel ylabel title legend colorbar savefig tight_layout grid set_xlim set_ylim plot scatter hist boxplot imshow cmap alpha bins tick_params annotate quiver contour barh stackplot subplots_adjust axhline axvline semilogx semilogy loglog polar streamplot hexbin pcolor tricontour errorbar clabel set_aspect violinplot set_axis_off spines text hatch plt axis plt.bar() plt.axis import figure pyplot highlight_text pypalettes plt.subplots() xlabel ylabel title legend colorbar savefig tight_layout grid set_xlim set_ylim plot scatter hist boxplot imshow cmap alpha bins tick_params annotate quiver contour barh stackplot subplots_adjust axhline axvline semilogx semilogy loglog polar streamplot hexbin pcolor tricontour errorbar clabel set_aspect violinplot set_axis_off spines text hatch plt axis plt.bar() plt.axis import figure pyplot highlight_text pypalettes plt.subplots() xlabel ylabel title legend colorbar savefig tight_layout grid set_xlim set_ylim plot scatter hist boxplot imshow cmap alpha bins tick_params annotate quiver contour barh stackplot subplots_adjust axhline axvline semilogx semilogy loglog polar streamplot hexbin pcolor tricontour errorbar clabel set_aspect violinplot set_axis_off spines text hatch plt axis plt.bar() plt.axis import figure pyplot highlight_text pypalettes plt.subplots() xlabel ylabel title legend colorbar savefig tight_layout grid set_xlim set_ylim plot scatter hist boxplot imshow cmap alpha bins tick_params annotate quiver contour barh stackplot subplots_adjust axhline axvline semilogx semilogy loglog polar streamplot hexbin pcolor tricontour errorbar clabel set_aspect violinplot set_axis_off spines text hatch plt axis plt.bar() plt.axis import figure pyplot highlight_text pypalettes plt.subplots() xlabel ylabel title legend colorbar savefig tight_layout grid set_xlim set_ylim plot scatter hist boxplot imshow cmap alpha bins tick_params annotate quiver contour barh stackplot subplots_adjust axhline axvline semilogx semilogy loglog polar streamplot hexbin pcolor tricontour errorbar clabel set_aspect violinplot set_axis_off spines text hatch plt axis plt.bar() plt.axis import figure pyplot highlight_text pypalettes plt.subplots() xlabel ylabel title legend colorbar savefig tight_layout grid set_xlim set_ylim plot scatter hist boxplot imshow cmap alpha bins tick_params annotate quiver contour barh stackplot subplots_adjust axhline axvline semilogx semilogy loglog polar streamplot hexbin pcolor tricontour errorbar clabel set_aspect violinplot set_axis_off spines text hatch plt axis plt.bar() plt.axis import figure pyplot highlight_text pypalettes plt.subplots() xlabel ylabel title legend colorbar savefig tight_layout grid set_xlim set_ylim plot scatter hist boxplot imshow cmap alpha bins tick_params annotate quiver contour barh stackplot subplots_adjust axhline axvline semilogx semilogy loglog polar streamplot hexbin pcolor tricontour errorbar clabel set_aspect violinplot set_axis_off spines text hatch plt axis plt.bar() plt.axis import figure pyplot highlight_text pypalettes plt.subplots() xlabel ylabel title legend colorbar savefig tight_layout grid set_xlim set_ylim plot scatter hist boxplot imshow cmap alpha bins tick_params annotate quiver contour barh stackplot subplots_adjust axhline axvline semilogx semilogy loglog polar streamplot hexbin pcolor tricontour errorbar clabel set_aspect violinplot set_axis_off spines text hatch plt axis plt.bar() plt.axis import figure pyplot highlight_text pypalettes plt.subplots() xlabel ylabel title legend colorbar savefig tight_layout grid set_xlim set_ylim plot scatter hist boxplot imshow cmap alpha bins tick_params annotate quiver contour barh stackplot subplots_adjust axhline axvline semilogx semilogy loglog polar streamplot hexbin pcolor tricontour errorbar clabel set_aspect violinplot set_axis_off spines text hatch plt axis plt.bar() plt.axis import figure pyplot highlight_text pypalettes plt.subplots() xlabel ylabel title legend colorbar savefig tight_layout grid set_xlim set_ylim plot scatter hist boxplot imshow cmap alpha bins tick_params annotate quiver contour barh stackplot subplots_adjust axhline axvline semilogx semilogy loglog polar streamplot hexbin pcolor tricontour errorbar clabel set_aspect violinplot set_axis_off spines text hatch plt axis plt.bar() plt.axis import figure pyplot highlight_text pypalettes plt.subplots() xlabel ylabel title legend colorbar savefig tight_layout grid set_xlim set_ylim plot scatter hist boxplot imshow cmap alpha bins tick_params annotate quiver contour barh stackplot subplots_adjust axhline axvline semilogx semilogy loglog polar streamplot hexbin pcolor tricontour errorbar clabel set_aspect violinplot set_axis_off spines text hatch plt axis plt.bar() plt.axis import figure pyplot highlight_text pypalettes plt.subplots() xlabel ylabel title legend colorbar savefig tight_layout grid set_xlim set_ylim plot scatter hist boxplot imshow cmap alpha bins tick_params annotate quiver contour barh stackplot subplots_adjust axhline axvline semilogx semilogy loglog polar streamplot hexbin pcolor tricontour errorbar clabel set_aspect violinplot set_axis_off spines text hatch plt axis plt.bar() plt.axis import figure pyplot highlight_text pypalettes plt.subplots() xlabel ylabel title legend colorbar savefig tight_layout grid set_xlim set_ylim plot scatter hist boxplot imshow cmap alpha bins tick_params annotate quiver contour barh stackplot subplots_adjust axhline axvline semilogx semilogy loglog polar streamplot hexbin pcolor tricontour errorbar clabel set_aspect violinplot set_axis_off spines text hatch plt axis plt.bar() plt.axis import figure pyplot highlight_text pypalettes plt.subplots() xlabel ylabel title legend colorbar savefig tight_layout grid set_xlim set_ylim plot scatter hist boxplot imshow cmap alpha bins tick_params annotate quiver contour barh stackplot subplots_adjust axhline axvline semilogx semilogy loglog polar streamplot hexbin pcolor tricontour errorbar clabel set_aspect violinplot set_axis_off spines text hatch plt axis plt.bar() plt.axis import figure pyplot highlight_text pypalettes plt.subplots() xlabel ylabel title legend colorbar savefig tight_layout grid set_xlim set_ylim plot scatter hist boxplot imshow cmap alpha bins tick_params annotate quiver contour barh stackplot subplots_adjust axhline axvline semilogx semilogy loglog polar streamplot hexbin pcolor tricontour errorbar clabel set_aspect violinplot set_axis_off spines text hatch plt axis plt.bar() plt.axis import figure pyplot highlight_text pypalettes plt.subplots() xlabel ylabel title legend colorbar savefig tight_layout grid set_xlim set_ylim plot scatter hist boxplot imshow cmap alpha bins tick_params annotate quiver contour barh stackplot subplots_adjust axhline axvline semilogx semilogy loglog polar streamplot hexbin pcolor tricontour errorbar clabel set_aspect violinplot set_axis_off spines text hatch plt axis plt.bar() plt.axis import figure pyplot highlight_text pypalettes plt.subplots() xlabel ylabel title legend colorbar savefig tight_layout grid set_xlim set_ylim plot scatter hist boxplot imshow cmap alpha bins tick_params annotate quiver contour barh stackplot subplots_adjust axhline axvline semilogx semilogy loglog polar streamplot hexbin pcolor tricontour errorbar clabel set_aspect violinplot set_axis_off spines text hatch plt axis plt.bar() plt.axis import figure pyplot highlight_text pypalettes plt.subplots() xlabel ylabel title legend colorbar savefig tight_layout grid set_xlim set_ylim plot scatter hist boxplot imshow cmap alpha bins tick_params annotate quiver contour barh stackplot subplots_adjust axhline axvline semilogx semilogy loglog polar streamplot hexbin pcolor tricontour errorbar clabel set_aspect violinplot set_axis_off spines text hatch plt axis plt.bar() plt.axis import figure pyplot highlight_text pypalettes plt.subplots() xlabel ylabel title legend colorbar savefig tight_layout grid set_xlim set_ylim plot scatter hist boxplot imshow cmap alpha bins tick_params annotate quiver contour barh stackplot subplots_adjust axhline axvline semilogx semilogy loglog polar streamplot hexbin pcolor tricontour errorbar clabel set_aspect violinplot set_axis_off spines text hatch plt axis plt.bar() plt.axis import figure pyplot highlight_text pypalettes plt.subplots() xlabel ylabel title legend colorbar savefig tight_layout grid set_xlim set_ylim plot scatter hist boxplot imshow cmap alpha bins tick_params annotate quiver contour barh stackplot subplots_adjust axhline axvline semilogx semilogy loglog polar streamplot hexbin pcolor tricontour errorbar clabel set_aspect violinplot set_axis_off spines text hatch plt axis plt.bar() plt.axis import figure pyplot highlight_text pypalettes plt.subplots() xlabel ylabel title legend colorbar savefig tight_layout grid set_xlim set_ylim plot scatter hist boxplot imshow cmap alpha bins tick_params annotate quiver contour barh stackplot subplots_adjust axhline axvline semilogx semilogy loglog polar streamplot hexbin pcolor tricontour errorbar clabel set_aspect violinplot set_axis_off spines text hatch plt axis plt.bar() plt.axis import figure pyplot highlight_text pypalettes plt.subplots() xlabel ylabel title legend colorbar savefig tight_layout grid set_xlim set_ylim plot scatter hist boxplot imshow cmap alpha bins tick_params annotate quiver contour barh stackplot subplots_adjust axhline axvline semilogx semilogy loglog polar streamplot hexbin pcolor tricontour errorbar clabel set_aspect violinplot set_axis_off spines text hatch plt axis plt.bar() plt.axis import figure pyplot highlight_text pypalettes plt.subplots() xlabel ylabel title legend colorbar savefig tight_layout grid set_xlim set_ylim plot scatter hist boxplot imshow cmap alpha bins tick_params annotate quiver contour barh stackplot subplots_adjust axhline axvline semilogx semilogy loglog polar streamplot hexbin pcolor tricontour errorbar clabel set_aspect violinplot set_axis_off spines text hatch plt axis plt.bar() plt.axis import figure pyplot highlight_text pypalettes plt.subplots() xlabel ylabel title legend colorbar savefig tight_layout grid set_xlim set_ylim plot scatter hist boxplot imshow cmap alpha bins tick_params annotate quiver contour barh stackplot subplots_adjust axhline axvline semilogx semilogy loglog polar streamplot hexbin pcolor tricontour errorbar clabel set_aspect violinplot set_axis_off spines text hatch plt axis plt.bar() plt.axis import figure pyplot highlight_text pypalettes plt.subplots() xlabel ylabel title legend colorbar savefig tight_layout grid set_xlim set_ylim plot scatter hist boxplot imshow cmap alpha bins tick_params annotate quiver contour barh stackplot subplots_adjust axhline axvline semilogx semilogy loglog polar streamplot hexbin pcolor tricontour errorbar clabel set_aspect violinplot set_axis_off spines text hatch plt axis plt.bar() plt.axis import figure pyplot highlight_text pypalettes plt.subplots() xlabel ylabel title legend colorbar savefig tight_layout grid set_xlim set_ylim plot scatter hist boxplot imshow cmap alpha bins tick_params annotate quiver contour barh stackplot subplots_adjust axhline axvline semilogx semilogy loglog polar streamplot hexbin pcolor tricontour errorbar clabel set_aspect violinplot set_axis_off spines text hatch plt axis plt.bar() plt.axis import figure pyplot highlight_text pypalettes plt.subplots() xlabel ylabel title legend colorbar savefig tight_layout grid set_xlim set_ylim plot scatter hist boxplot imshow cmap alpha bins tick_params annotate quiver contour barh stackplot subplots_adjust axhline axvline semilogx semilogy loglog polar streamplot hexbin pcolor tricontour errorbar clabel set_aspect violinplot set_axis_off spines text hatch plt axis plt.bar() plt.axis import figure pyplot highlight_text pypalettes plt.subplots() xlabel ylabel title legend colorbar savefig tight_layout grid set_xlim set_ylim plot scatter hist boxplot imshow cmap alpha bins tick_params annotate quiver contour barh stackplot subplots_adjust axhline axvline semilogx semilogy loglog polar streamplot hexbin pcolor tricontour errorbar clabel set_aspect violinplot set_axis_off spines text hatch plt axis plt.bar() plt.axis import figure pyplot highlight_text pypalettes plt.subplots() xlabel ylabel title legend colorbar savefig tight_layout grid set_xlim set_ylim plot scatter hist boxplot imshow cmap alpha bins tick_params annotate quiver contour barh stackplot subplots_adjust axhline axvline semilogx semilogy loglog polar streamplot hexbin pcolor tricontour errorbar clabel set_aspect violinplot set_axis_off spines text hatch plt axis plt.bar() plt.axis import figure pyplot highlight_text pypalettes plt.subplots() xlabel ylabel title legend colorbar savefig tight_layout grid set_xlim set_ylim plot scatter hist boxplot imshow cmap alpha bins tick_params annotate quiver contour barh stackplot subplots_adjust axhline axvline semilogx semilogy loglog polar streamplot hexbin pcolor tricontour errorbar clabel set_aspect violinplot set_axis_off spines text hatch plt axis plt.bar() plt.axis import figure pyplot highlight_text pypalettes plt.subplots() xlabel ylabel title legend colorbar savefig tight_layout grid set_xlim set_ylim plot scatter hist boxplot imshow cmap alpha bins tick_params annotate quiver contour barh stackplot subplots_adjust axhline axvline semilogx semilogy loglog polar streamplot hexbin pcolor tricontour errorbar clabel set_aspect violinplot set_axis_off spines text hatch plt axis plt.bar() plt.axis import figure pyplot highlight_text pypalettes plt.subplots() xlabel ylabel title legend colorbar savefig tight_layout grid set_xlim set_ylim plot scatter hist boxplot imshow cmap alpha bins tick_params annotate quiver contour barh stackplot subplots_adjust axhline axvline semilogx semilogy loglog polar streamplot hexbin pcolor tricontour errorbar clabel set_aspect violinplot set_axis_off spines text hatch plt axis plt.bar() plt.axis import figure pyplot highlight_text pypalettes plt.subplots() xlabel ylabel title legend colorbar savefig tight_layout grid set_xlim set_ylim plot scatter hist boxplot imshow cmap alpha bins tick_params annotate quiver contour barh stackplot subplots_adjust axhline axvline semilogx semilogy loglog polar streamplot hexbin pcolor tricontour errorbar clabel set_aspect violinplot set_axis_off spines text hatch plt axis plt.bar() plt.axis import figure pyplot highlight_text pypalettes plt.subplots() xlabel ylabel title legend colorbar savefig tight_layout grid set_xlim set_ylim plot scatter hist boxplot imshow cmap alpha bins tick_params annotate quiver contour barh stackplot subplots_adjust axhline axvline semilogx semilogy loglog polar streamplot hexbin pcolor tricontour errorbar clabel set_aspect violinplot set_axis_off spines text hatch plt axis plt.bar() plt.axis import figure pyplot highlight_text pypalettes plt.subplots() xlabel ylabel title legend colorbar savefig tight_layout grid set_xlim set_ylim plot scatter hist boxplot imshow cmap alpha bins tick_params annotate quiver contour barh stackplot subplots_adjust axhline axvline semilogx semilogy loglog polar streamplot hexbin pcolor tricontour errorbar clabel set_aspect violinplot set_axis_off spines text hatch plt axis plt.bar() plt.axis import figure pyplot highlight_text pypalettes plt.subplots() xlabel ylabel title legend colorbar savefig tight_layout grid set_xlim set_ylim plot scatter hist boxplot imshow cmap alpha bins tick_params annotate quiver contour barh stackplot subplots_adjust axhline axvline semilogx semilogy loglog polar streamplot hexbin pcolor tricontour errorbar clabel set_aspect violinplot set_axis_off spines text hatch plt axis plt.bar() plt.axis import figure pyplot highlight_text pypalettes plt.subplots() xlabel ylabel title legend colorbar savefig tight_layout grid set_xlim set_ylim plot scatter hist boxplot imshow cmap alpha bins tick_params annotate quiver contour barh stackplot subplots_adjust axhline axvline semilogx semilogy loglog polar streamplot hexbin pcolor tricontour errorbar clabel set_aspect violinplot set_axis_off spines text hatch plt axis plt.bar() plt.axis import figure pyplot highlight_text pypalettes plt.subplots() xlabel ylabel title legend colorbar savefig tight_layout grid set_xlim set_ylim plot scatter hist boxplot imshow cmap alpha bins tick_params annotate quiver contour barh stackplot subplots_adjust axhline axvline semilogx semilogy loglog polar streamplot hexbin pcolor tricontour errorbar clabel set_aspect violinplot set_axis_off spines text hatch plt axis plt.bar() plt.axis import figure pyplot highlight_text pypalettes plt.subplots() xlabel ylabel title legend colorbar savefig tight_layout grid set_xlim set_ylim plot scatter hist boxplot imshow cmap alpha bins tick_params annotate quiver contour barh stackplot subplots_adjust axhline axvline semilogx semilogy loglog polar streamplot hexbin pcolor tricontour errorbar clabel set_aspect violinplot set_axis_off spines text hatch plt axis plt.bar() plt.axis import figure pyplot highlight_text pypalettes plt.subplots() xlabel ylabel title legend colorbar savefig tight_layout grid set_xlim set_ylim plot scatter hist boxplot imshow cmap alpha bins tick_params annotate quiver contour barh stackplot subplots_adjust axhline axvline semilogx semilogy loglog polar streamplot hexbin pcolor tricontour errorbar clabel set_aspect violinplot set_axis_off spines text hatch plt axis plt.bar() plt.axis import figure pyplot highlight_text pypalettes plt.subplots() xlabel ylabel title legend colorbar savefig tight_layout grid set_xlim set_ylim plot scatter hist boxplot imshow cmap alpha bins tick_params annotate quiver contour barh stackplot subplots_adjust axhline axvline semilogx semilogy loglog polar streamplot hexbin pcolor tricontour errorbar clabel set_aspect violinplot set_axis_off spines text hatch plt axis plt.bar() plt.axis import figure pyplot highlight_text pypalettes plt.subplots() xlabel ylabel title legend colorbar savefig tight_layout grid set_xlim set_ylim plot scatter hist boxplot imshow cmap alpha bins tick_params annotate quiver contour barh stackplot subplots_adjust axhline axvline semilogx semilogy loglog polar streamplot hexbin pcolor tricontour errorbar clabel set_aspect violinplot set_axis_off spines text hatch plt axis plt.bar() plt.axis import figure pyplot highlight_text pypalettes plt.subplots() xlabel ylabel title legend colorbar savefig tight_layout grid set_xlim set_ylim plot scatter hist boxplot imshow cmap alpha bins tick_params annotate quiver contour barh stackplot subplots_adjust axhline axvline semilogx semilogy loglog polar streamplot hexbin pcolor tricontour errorbar clabel set_aspect violinplot set_axis_off spines text hatch plt axis plt.bar() plt.axis import figure pyplot highlight_text pypalettes plt.subplots() xlabel ylabel title legend colorbar savefig tight_layout grid set_xlim set_ylim plot scatter hist boxplot imshow cmap alpha bins tick_params annotate quiver contour barh stackplot subplots_adjust axhline axvline semilogx semilogy loglog polar streamplot hexbin pcolor tricontour errorbar clabel set_aspect violinplot set_axis_off spines text hatch plt axis plt.bar() plt.axis import figure pyplot highlight_text pypalettes plt.subplots() xlabel ylabel title legend colorbar savefig tight_layout grid set_xlim set_ylim plot scatter hist boxplot imshow cmap alpha bins tick_params annotate quiver contour barh stackplot subplots_adjust axhline axvline semilogx semilogy loglog polar streamplot hexbin pcolor tricontour errorbar clabel set_aspect violinplot set_axis_off spines text hatch plt axis plt.bar() plt.axis import figure pyplot highlight_text pypalettes plt.subplots() xlabel ylabel title legend colorbar savefig tight_layout grid set_xlim set_ylim plot scatter hist boxplot imshow cmap alpha bins tick_params annotate quiver contour barh stackplot subplots_adjust axhline axvline semilogx semilogy loglog polar streamplot hexbin pcolor tricontour errorbar clabel set_aspect violinplot set_axis_off spines text hatch plt axis plt.bar() plt.axis import figure pyplot highlight_text pypalettes plt.subplots() xlabel ylabel title legend colorbar savefig tight_layout grid set_xlim set_ylim plot scatter hist boxplot imshow cmap alpha bins tick_params annotate quiver contour barh stackplot subplots_adjust axhline axvline semilogx semilogy loglog polar streamplot hexbin pcolor tricontour errorbar clabel set_aspect violinplot set_axis_off spines text hatch plt axis plt.bar() plt.axis import figure pyplot highlight_text pypalettes plt.subplots() xlabel ylabel title legend colorbar savefig tight_layout grid set_xlim set_ylim plot scatter hist boxplot imshow cmap alpha bins tick_params annotate quiver contour barh stackplot subplots_adjust axhline axvline semilogx semilogy loglog polar streamplot hexbin pcolor tricontour errorbar clabel set_aspect violinplot set_axis_off spines text hatch plt axis plt.bar() plt.axis import figure pyplot highlight_text pypalettes plt.subplots() xlabel ylabel title legend colorbar savefig tight_layout grid set_xlim set_ylim plot scatter hist boxplot imshow cmap alpha bins tick_params annotate quiver contour barh stackplot subplots_adjust axhline axvline semilogx semilogy loglog polar streamplot hexbin pcolor tricontour errorbar clabel set_aspect violinplot set_axis_off spines text hatch plt axis plt.bar() plt.axis import figure pyplot highlight_text pypalettes plt.subplots() xlabel ylabel title legend colorbar savefig tight_layout grid set_xlim set_ylim plot scatter hist boxplot imshow cmap alpha bins tick_params annotate quiver contour barh stackplot subplots_adjust axhline axvline semilogx semilogy loglog polar streamplot hexbin pcolor tricontour errorbar clabel set_aspect violinplot set_axis_off spines text hatch plt axis plt.bar() plt.axis import figure pyplot highlight_text pypalettes plt.subplots() xlabel ylabel title legend colorbar savefig tight_layout grid set_xlim set_ylim plot scatter hist boxplot imshow cmap alpha bins tick_params annotate quiver contour barh stackplot subplots_adjust axhline axvline semilogx semilogy loglog polar streamplot hexbin pcolor tricontour errorbar clabel set_aspect violinplot set_axis_off spines text hatch plt axis plt.bar() plt.axis import figure pyplot highlight_text pypalettes plt.subplots() xlabel ylabel title legend colorbar savefig tight_layout grid set_xlim set_ylim plot scatter hist boxplot imshow cmap alpha bins tick_params annotate quiver contour barh stackplot subplots_adjust axhline axvline semilogx semilogy loglog polar streamplot hexbin pcolor tricontour errorbar clabel set_aspect violinplot set_axis_off spines text hatch plt axis plt.bar() plt.axis import figure pyplot highlight_text pypalettes plt.subplots() xlabel ylabel title legend colorbar savefig tight_layout grid set_xlim set_ylim plot scatter hist boxplot imshow cmap alpha bins tick_params annotate quiver contour barh stackplot subplots_adjust axhline axvline semilogx semilogy loglog polar streamplot hexbin pcolor tricontour errorbar clabel set_aspect violinplot set_axis_off spines text hatch plt axis plt.bar() plt.axis import figure pyplot highlight_text pypalettes plt.subplots() xlabel ylabel title legend colorbar savefig tight_layout grid set_xlim set_ylim plot scatter hist boxplot imshow cmap alpha bins tick_params annotate quiver contour barh stackplot subplots_adjust axhline axvline semilogx semilogy loglog polar streamplot hexbin pcolor tricontour errorbar clabel set_aspect violinplot set_axis_off spines text hatch plt axis plt.bar() plt.axis import figure pyplot highlight_text pypalettes plt.subplots() xlabel ylabel title legend colorbar savefig tight_layout grid set_xlim set_ylim plot scatter hist boxplot imshow cmap alpha bins tick_params annotate quiver contour barh stackplot subplots_adjust axhline axvline semilogx semilogy loglog polar streamplot hexbin pcolor tricontour errorbar clabel set_aspect violinplot set_axis_off spines text hatch plt axis plt.bar() plt.axis import figure pyplot highlight_text pypalettes plt.subplots() xlabel ylabel title legend colorbar savefig tight_layout grid set_xlim set_ylim plot scatter hist boxplot imshow cmap alpha bins tick_params annotate quiver contour barh stackplot subplots_adjust axhline axvline semilogx semilogy loglog polar streamplot hexbin pcolor tricontour errorbar clabel set_aspect violinplot set_axis_off spines text hatch plt axis plt.bar() plt.axis import figure pyplot highlight_text pypalettes plt.subplots() xlabel ylabel title legend colorbar savefig tight_layout grid set_xlim set_ylim plot scatter hist boxplot imshow cmap alpha bins tick_params annotate quiver contour barh stackplot subplots_adjust axhline axvline semilogx semilogy loglog polar streamplot hexbin pcolor tricontour errorbar clabel set_aspect violinplot set_axis_off spines text hatch plt axis plt.bar() plt.axis import figure pyplot highlight_text pypalettes plt.subplots() xlabel ylabel title legend colorbar savefig tight_layout grid set_xlim set_ylim plot scatter hist boxplot imshow cmap alpha bins tick_params annotate quiver contour barh stackplot subplots_adjust axhline axvline semilogx semilogy loglog polar streamplot hexbin pcolor tricontour errorbar clabel set_aspect violinplot set_axis_off spines text hatch plt axis plt.bar() plt.axis import figure pyplot highlight_text pypalettes plt.subplots() xlabel ylabel title legend colorbar savefig tight_layout grid set_xlim set_ylim plot scatter hist boxplot imshow cmap alpha bins tick_params annotate quiver contour barh stackplot subplots_adjust axhline axvline semilogx semilogy loglog polar streamplot hexbin pcolor tricontour errorbar clabel set_aspect violinplot set_axis_off spines text hatch plt axis plt.bar() plt.axis import figure pyplot highlight_text pypalettes plt.subplots() xlabel ylabel title legend colorbar savefig tight_layout grid set_xlim set_ylim plot scatter hist boxplot imshow cmap alpha bins tick_params annotate quiver contour barh stackplot subplots_adjust axhline axvline semilogx semilogy loglog polar streamplot hexbin pcolor tricontour errorbar clabel set_aspect violinplot set_axis_off spines text hatch plt axis plt.bar() plt.axis import figure pyplot highlight_text pypalettes plt.subplots() xlabel ylabel title legend colorbar savefig tight_layout grid set_xlim set_ylim plot scatter hist boxplot imshow cmap alpha bins tick_params annotate quiver contour barh stackplot subplots_adjust axhline axvline semilogx semilogy loglog polar streamplot hexbin pcolor tricontour errorbar clabel set_aspect violinplot set_axis_off spines text hatch plt axis plt.bar() plt.axis import figure pyplot highlight_text pypalettes plt.subplots() xlabel ylabel title legend colorbar savefig tight_layout grid set_xlim set_ylim plot scatter hist boxplot imshow cmap alpha bins tick_params annotate quiver contour barh stackplot subplots_adjust axhline axvline semilogx semilogy loglog polar streamplot hexbin pcolor tricontour errorbar clabel set_aspect violinplot set_axis_off spines text hatch plt axis plt.bar() plt.axis import figure pyplot highlight_text pypalettes plt.subplots() xlabel ylabel title legend colorbar savefig tight_layout grid set_xlim set_ylim plot scatter hist boxplot imshow cmap alpha bins tick_params annotate quiver contour barh stackplot subplots_adjust axhline axvline semilogx semilogy loglog polar streamplot hexbin pcolor tricontour errorbar clabel set_aspect violinplot set_axis_off spines text hatch plt axis plt.bar() plt.axis import figure pyplot highlight_text pypalettes plt.subplots() xlabel ylabel title legend colorbar savefig tight_layout grid set_xlim set_ylim plot scatter hist boxplot imshow cmap alpha bins tick_params annotate quiver contour barh stackplot subplots_adjust axhline axvline semilogx semilogy loglog polar streamplot hexbin pcolor tricontour errorbar clabel set_aspect violinplot set_axis_off spines text hatch plt axis plt.bar() plt.axis import figure pyplot highlight_text pypalettes plt.subplots() xlabel ylabel title legend colorbar savefig tight_layout grid set_xlim set_ylim plot scatter hist boxplot imshow cmap alpha bins tick_params annotate quiver contour barh stackplot subplots_adjust axhline axvline semilogx semilogy loglog polar streamplot hexbin pcolor tricontour errorbar clabel set_aspect violinplot set_axis_off spines text hatch plt axis plt.bar() plt.axis import figure pyplot highlight_text pypalettes plt.subplots() xlabel ylabel title legend colorbar savefig tight_layout grid set_xlim set_ylim plot scatter hist boxplot imshow cmap alpha bins tick_params annotate quiver contour barh stackplot subplots_adjust axhline axvline semilogx semilogy loglog polar streamplot hexbin pcolor tricontour errorbar clabel set_aspect violinplot set_axis_off spines text hatch plt axis plt.bar() plt.axis import figure pyplot highlight_text pypalettes plt.subplots() xlabel ylabel title legend colorbar savefig tight_layout grid set_xlim set_ylim plot scatter hist boxplot imshow cmap alpha bins tick_params annotate quiver contour barh stackplot subplots_adjust axhline axvline semilogx semilogy loglog polar streamplot hexbin pcolor tricontour errorbar clabel set_aspect violinplot set_axis_off spines text hatch plt axis plt.bar() plt.axis import figure pyplot highlight_text pypalettes plt.subplots() xlabel ylabel title legend colorbar savefig tight_layout grid set_xlim set_ylim plot scatter hist boxplot imshow cmap alpha bins tick_params annotate quiver contour barh stackplot subplots_adjust axhline axvline semilogx semilogy loglog polar streamplot hexbin pcolor tricontour errorbar clabel set_aspect violinplot set_axis_off spines text hatch plt axis plt.bar() plt.axis import figure pyplot highlight_text pypalettes plt.subplots() xlabel ylabel title legend colorbar savefig tight_layout grid set_xlim set_ylim plot scatter hist boxplot imshow cmap alpha bins tick_params annotate quiver contour barh stackplot subplots_adjust axhline axvline semilogx semilogy loglog polar streamplot hexbin pcolor tricontour errorbar clabel set_aspect violinplot set_axis_off spines text hatch plt axis plt.bar() plt.axis import figure pyplot highlight_text pypalettes plt.subplots() xlabel ylabel title legend colorbar savefig tight_layout grid set_xlim set_ylim plot scatter hist boxplot imshow cmap alpha bins tick_params annotate quiver contour barh stackplot subplots_adjust axhline axvline semilogx semilogy loglog polar streamplot hexbin pcolor tricontour errorbar clabel set_aspect violinplot set_axis_off spines text hatch plt axis plt.bar() plt.axis import figure pyplot highlight_text pypalettes plt.subplots() xlabel ylabel title legend colorbar savefig tight_layout grid set_xlim set_ylim plot scatter hist boxplot imshow cmap alpha bins tick_params annotate quiver contour barh stackplot subplots_adjust axhline axvline semilogx semilogy loglog polar streamplot hexbin pcolor tricontour errorbar clabel set_aspect violinplot set_axis_off spines text hatch plt axis plt.bar() plt.axis import figure pyplot highlight_text pypalettes plt.subplots() xlabel ylabel title legend colorbar savefig tight_layout grid set_xlim set_ylim plot scatter hist boxplot imshow cmap alpha bins tick_params annotate quiver contour barh stackplot subplots_adjust axhline axvline semilogx semilogy loglog polar streamplot hexbin pcolor tricontour errorbar clabel set_aspect violinplot set_axis_off spines text hatch plt axis plt.bar() plt.axis import figure pyplot highlight_text pypalettes plt.subplots() xlabel ylabel title legend colorbar savefig tight_layout grid set_xlim set_ylim plot scatter hist boxplot imshow cmap alpha bins tick_params annotate quiver contour barh stackplot subplots_adjust axhline axvline semilogx semilogy loglog polar streamplot hexbin pcolor tricontour errorbar clabel set_aspect violinplot set_axis_off spines text hatch plt axis plt.bar() plt.axis import figure pyplot highlight_text pypalettes plt.subplots() xlabel ylabel title legend colorbar savefig tight_layout grid set_xlim set_ylim plot scatter hist boxplot imshow cmap alpha bins tick_params annotate quiver contour barh stackplot subplots_adjust axhline axvline semilogx semilogy loglog polar streamplot hexbin pcolor tricontour errorbar clabel set_aspect violinplot set_axis_off spines text hatch plt axis plt.bar() plt.axis import figure pyplot highlight_text pypalettes plt.subplots() xlabel ylabel title legend colorbar savefig tight_layout grid set_xlim set_ylim plot scatter hist boxplot imshow cmap alpha bins tick_params annotate quiver contour barh stackplot subplots_adjust axhline axvline semilogx semilogy loglog polar streamplot hexbin pcolor tricontour errorbar clabel set_aspect violinplot set_axis_off spines text hatch plt axis plt.bar() plt.axis import figure pyplot highlight_text pypalettes plt.subplots() xlabel ylabel title legend colorbar savefig tight_layout grid set_xlim set_ylim plot scatter hist boxplot imshow cmap alpha bins tick_params annotate quiver contour barh stackplot subplots_adjust axhline axvline semilogx semilogy loglog polar streamplot hexbin pcolor tricontour errorbar clabel set_aspect violinplot set_axis_off spines text hatch plt axis plt.bar() plt.axis import figure pyplot highlight_text pypalettes plt.subplots() xlabel ylabel title legend colorbar savefig tight_layout grid set_xlim set_ylim plot scatter hist boxplot imshow cmap alpha bins tick_params annotate quiver contour barh stackplot subplots_adjust axhline axvline semilogx semilogy loglog polar streamplot hexbin pcolor tricontour errorbar clabel set_aspect violinplot set_axis_off spines text hatch plt axis plt.bar() plt.axis import figure pyplot highlight_text pypalettes plt.subplots() xlabel ylabel title legend colorbar savefig tight_layout grid set_xlim set_ylim plot scatter hist boxplot imshow cmap alpha bins tick_params annotate quiver contour barh stackplot subplots_adjust axhline axvline semilogx semilogy loglog polar streamplot hexbin pcolor tricontour errorbar clabel set_aspect violinplot set_axis_off spines text hatch plt axis plt.bar() plt.axis import figure pyplot highlight_text pypalettes plt.subplots() xlabel ylabel title legend colorbar savefig tight_layout grid set_xlim set_ylim plot scatter hist boxplot imshow cmap alpha bins tick_params annotate quiver contour barh stackplot subplots_adjust axhline axvline semilogx semilogy loglog polar streamplot hexbin pcolor tricontour errorbar clabel set_aspect violinplot set_axis_off spines text hatch plt axis plt.bar() plt.axis import figure pyplot highlight_text pypalettes plt.subplots() xlabel ylabel title legend colorbar savefig tight_layout grid set_xlim set_ylim plot scatter hist boxplot imshow cmap alpha bins tick_params annotate quiver contour barh stackplot subplots_adjust axhline axvline semilogx semilogy loglog polar streamplot hexbin pcolor tricontour errorbar clabel set_aspect violinplot set_axis_off spines text hatch plt axis plt.bar() plt.axis import figure pyplot highlight_text pypalettes plt.subplots() xlabel ylabel title legend colorbar savefig tight_layout grid set_xlim set_ylim plot scatter hist boxplot imshow cmap alpha bins tick_params annotate quiver contour barh stackplot subplots_adjust axhline axvline semilogx semilogy loglog polar streamplot hexbin pcolor tricontour errorbar clabel set_aspect violinplot set_axis_off spines text hatch plt axis plt.bar() plt.axis import figure pyplot highlight_text pypalettes plt.subplots() xlabel ylabel title legend colorbar savefig tight_layout grid set_xlim set_ylim plot scatter hist boxplot imshow cmap alpha bins tick_params annotate quiver contour barh stackplot subplots_adjust axhline axvline semilogx semilogy loglog polar streamplot hexbin pcolor tricontour errorbar clabel set_aspect violinplot set_axis_off spines text hatch plt axis plt.bar() plt.axis import figure pyplot highlight_text pypalettes plt.subplots() xlabel ylabel title legend colorbar savefig tight_layout grid set_xlim set_ylim plot scatter hist boxplot imshow cmap alpha bins tick_params annotate quiver contour barh stackplot subplots_adjust axhline axvline semilogx semilogy loglog polar streamplot hexbin pcolor tricontour errorbar clabel set_aspect violinplot set_axis_off spines text hatch plt axis plt.bar() plt.axis import figure pyplot highlight_text pypalettes plt.subplots() xlabel ylabel title legend colorbar savefig tight_layout grid set_xlim set_ylim plot scatter hist boxplot imshow cmap alpha bins tick_params annotate quiver contour barh stackplot subplots_adjust axhline axvline semilogx semilogy loglog polar streamplot hexbin pcolor tricontour errorbar clabel set_aspect violinplot set_axis_off spines text hatch plt axis plt.bar() plt.axis import figure pyplot highlight_text pypalettes plt.subplots() xlabel ylabel title legend colorbar savefig tight_layout grid set_xlim set_ylim plot scatter hist boxplot imshow cmap alpha bins tick_params annotate quiver contour barh stackplot subplots_adjust axhline axvline semilogx semilogy loglog polar streamplot hexbin pcolor tricontour errorbar clabel set_aspect violinplot set_axis_off spines text hatch plt axis plt.bar() plt.axis import figure pyplot highlight_text pypalettes plt.subplots() xlabel ylabel title legend colorbar savefig tight_layout grid set_xlim set_ylim plot scatter hist boxplot imshow cmap alpha bins tick_params annotate quiver contour barh stackplot subplots_adjust axhline axvline semilogx semilogy loglog polar streamplot hexbin pcolor tricontour errorbar clabel set_aspect violinplot set_axis_off spines text hatch plt axis plt.bar() plt.axis import figure pyplot highlight_text pypalettes plt.subplots() xlabel ylabel title legend colorbar savefig tight_layout grid set_xlim set_ylim plot scatter hist boxplot imshow cmap alpha bins tick_params annotate quiver contour barh stackplot subplots_adjust axhline axvline semilogx semilogy loglog polar streamplot hexbin pcolor tricontour errorbar clabel set_aspect violinplot set_axis_off spines text hatch plt axis plt.bar() plt.axis import figure pyplot highlight_text pypalettes plt.subplots() xlabel ylabel title legend colorbar savefig tight_layout grid set_xlim set_ylim plot scatter hist boxplot imshow cmap alpha bins tick_params annotate quiver contour barh stackplot subplots_adjust axhline axvline semilogx semilogy loglog polar streamplot hexbin pcolor tricontour errorbar clabel set_aspect violinplot set_axis_off spines text hatch plt axis plt.bar() plt.axis import figure pyplot highlight_text pypalettes plt.subplots() xlabel ylabel title legend colorbar savefig tight_layout grid set_xlim set_ylim plot scatter hist boxplot imshow cmap alpha bins tick_params annotate quiver contour barh stackplot subplots_adjust axhline axvline semilogx semilogy loglog polar streamplot hexbin pcolor tricontour errorbar clabel set_aspect violinplot set_axis_off spines text hatch plt axis plt.bar() plt.axis import figure pyplot highlight_text pypalettes plt.subplots() xlabel ylabel title legend colorbar savefig tight_layout grid set_xlim set_ylim plot scatter hist boxplot imshow cmap alpha bins tick_params annotate quiver contour barh stackplot subplots_adjust axhline axvline semilogx semilogy loglog polar streamplot hexbin pcolor tricontour errorbar clabel set_aspect violinplot set_axis_off spines text hatch plt axis plt.bar() plt.axis import figure pyplot highlight_text pypalettes plt.subplots() xlabel ylabel title legend colorbar savefig tight_layout grid set_xlim set_ylim plot scatter hist boxplot imshow cmap alpha bins tick_params annotate quiver contour barh stackplot subplots_adjust axhline axvline semilogx semilogy loglog polar streamplot hexbin pcolor tricontour errorbar clabel set_aspect violinplot set_axis_off spines text hatch plt axis plt.bar() plt.axis import figure pyplot highlight_text pypalettes plt.subplots() xlabel ylabel title legend colorbar savefig tight_layout grid set_xlim set_ylim plot scatter hist boxplot imshow cmap alpha bins tick_params annotate quiver contour barh stackplot subplots_adjust axhline axvline semilogx semilogy loglog polar streamplot hexbin pcolor tricontour errorbar clabel set_aspect violinplot set_axis_off spines text hatch plt axis plt.bar() plt.axis import figure pyplot highlight_text pypalettes plt.subplots() xlabel ylabel title legend colorbar savefig tight_layout grid set_xlim set_ylim plot scatter hist boxplot imshow cmap alpha bins tick_params annotate quiver contour barh stackplot subplots_adjust axhline axvline semilogx semilogy loglog polar streamplot hexbin pcolor tricontour errorbar clabel set_aspect violinplot set_axis_off spines text hatch plt axis plt.bar() plt.axis import figure pyplot highlight_text pypalettes plt.subplots() xlabel ylabel title legend colorbar savefig tight_layout grid set_xlim set_ylim plot scatter hist boxplot imshow cmap alpha bins tick_params annotate quiver contour barh stackplot subplots_adjust axhline axvline semilogx semilogy loglog polar streamplot hexbin pcolor tricontour errorbar clabel set_aspect violinplot set_axis_off spines text hatch plt axis plt.bar() plt.axis import figure pyplot highlight_text pypalettes plt.subplots() xlabel ylabel title legend colorbar savefig tight_layout grid set_xlim set_ylim plot scatter hist boxplot imshow cmap alpha bins tick_params annotate quiver contour barh stackplot subplots_adjust axhline axvline semilogx semilogy loglog polar streamplot hexbin pcolor tricontour errorbar clabel set_aspect violinplot set_axis_off spines text hatch plt axis plt.bar() plt.axis import figure pyplot highlight_text pypalettes plt.subplots() xlabel ylabel title legend colorbar savefig tight_layout grid set_xlim set_ylim plot scatter hist boxplot imshow cmap alpha bins tick_params annotate quiver contour barh stackplot subplots_adjust axhline axvline semilogx semilogy loglog polar streamplot hexbin pcolor tricontour errorbar clabel set_aspect violinplot set_axis_off spines text hatch plt axis plt.bar() plt.axis import figure pyplot highlight_text pypalettes plt.subplots() xlabel ylabel title legend colorbar savefig tight_layout grid set_xlim set_ylim plot scatter hist boxplot imshow cmap alpha bins tick_params annotate quiver contour barh stackplot subplots_adjust axhline axvline semilogx semilogy loglog polar streamplot hexbin pcolor tricontour errorbar clabel set_aspect violinplot set_axis_off spines text hatch plt axis plt.bar() plt.axis import figure pyplot highlight_text pypalettes plt.subplots() xlabel ylabel title legend colorbar savefig tight_layout grid set_xlim set_ylim plot scatter hist boxplot imshow cmap alpha bins tick_params annotate quiver contour barh stackplot subplots_adjust axhline axvline semilogx semilogy loglog polar streamplot hexbin pcolor tricontour errorbar clabel set_aspect violinplot set_axis_off spines text hatch plt axis plt.bar() plt.axis import figure pyplot highlight_text pypalettes plt.subplots() xlabel ylabel title legend colorbar savefig tight_layout grid set_xlim set_ylim plot scatter hist boxplot imshow cmap alpha bins tick_params annotate quiver contour barh stackplot subplots_adjust axhline axvline semilogx semilogy loglog polar streamplot hexbin pcolor tricontour errorbar clabel set_aspect violinplot set_axis_off spines text hatch plt axis plt.bar() plt.axis import figure pyplot highlight_text pypalettes plt.subplots() xlabel ylabel title legend colorbar savefig tight_layout grid set_xlim set_ylim plot scatter hist boxplot imshow cmap alpha bins tick_params annotate quiver contour barh stackplot subplots_adjust axhline axvline semilogx semilogy loglog polar streamplot hexbin pcolor tricontour errorbar clabel set_aspect violinplot set_axis_off spines text hatch plt axis plt.bar() plt.axis import figure pyplot highlight_text pypalettes plt.subplots() xlabel ylabel title legend colorbar savefig tight_layout grid set_xlim set_ylim plot scatter hist boxplot imshow cmap alpha bins tick_params annotate quiver contour barh stackplot subplots_adjust axhline axvline semilogx semilogy loglog polar streamplot hexbin pcolor tricontour errorbar clabel set_aspect violinplot set_axis_off spines text hatch plt axis plt.bar() plt.axis import figure pyplot highlight_text pypalettes plt.subplots() xlabel ylabel title legend colorbar savefig tight_layout grid set_xlim set_ylim plot scatter hist boxplot imshow cmap alpha bins tick_params annotate quiver contour barh stackplot subplots_adjust axhline axvline semilogx semilogy loglog polar streamplot hexbin pcolor tricontour errorbar clabel set_aspect violinplot set_axis_off spines text hatch plt axis plt.bar() plt.axis import figure pyplot highlight_text pypalettes plt.subplots() xlabel ylabel title legend colorbar savefig tight_layout grid set_xlim set_ylim plot scatter hist boxplot imshow cmap alpha bins tick_params annotate quiver contour barh stackplot subplots_adjust axhline axvline semilogx semilogy loglog polar streamplot hexbin pcolor tricontour errorbar clabel set_aspect violinplot set_axis_off spines text hatch plt axis plt.bar() plt.axis import figure pyplot highlight_text pypalettes plt.subplots() xlabel ylabel title legend colorbar savefig tight_layout grid set_xlim set_ylim plot scatter hist boxplot imshow cmap alpha bins tick_params annotate quiver contour barh stackplot subplots_adjust axhline axvline semilogx semilogy loglog polar streamplot hexbin pcolor tricontour errorbar clabel set_aspect violinplot set_axis_off spines text hatch plt axis plt.bar() plt.axis import figure pyplot highlight_text pypalettes plt.subplots() xlabel ylabel title legend colorbar savefig tight_layout grid set_xlim set_ylim plot scatter hist boxplot imshow cmap alpha bins tick_params annotate quiver contour barh stackplot subplots_adjust axhline axvline semilogx semilogy loglog polar streamplot hexbin pcolor tricontour errorbar clabel set_aspect violinplot set_axis_off spines text hatch plt axis plt.bar() plt.axis import figure pyplot highlight_text pypalettes plt.subplots() xlabel ylabel title legend colorbar savefig tight_layout grid set_xlim set_ylim plot scatter hist boxplot imshow cmap alpha bins tick_params annotate quiver contour barh stackplot subplots_adjust axhline axvline semilogx semilogy loglog polar streamplot hexbin pcolor tricontour errorbar clabel set_aspect violinplot set_axis_off spines text hatch plt axis plt.bar() plt.axis import figure pyplot highlight_text pypalettes plt.subplots() xlabel ylabel title legend colorbar savefig tight_layout grid set_xlim set_ylim plot scatter hist boxplot imshow cmap alpha bins tick_params annotate quiver contour barh stackplot subplots_adjust axhline axvline semilogx semilogy loglog polar streamplot hexbin pcolor tricontour errorbar clabel set_aspect violinplot set_axis_off spines text hatch plt axis plt.bar() plt.axis import figure pyplot highlight_text pypalettes plt.subplots() xlabel ylabel title legend colorbar savefig tight_layout grid set_xlim set_ylim plot scatter hist boxplot imshow cmap alpha bins tick_params annotate quiver contour barh stackplot subplots_adjust axhline axvline semilogx semilogy loglog polar streamplot hexbin pcolor tricontour errorbar clabel set_aspect violinplot set_axis_off spines text hatch plt axis plt.bar() plt.axis import figure pyplot highlight_text pypalettes plt.subplots() xlabel ylabel title legend colorbar savefig tight_layout grid set_xlim set_ylim plot scatter hist boxplot imshow cmap alpha bins tick_params annotate quiver contour barh stackplot subplots_adjust axhline axvline semilogx semilogy loglog polar streamplot hexbin pcolor tricontour errorbar clabel set_aspect violinplot set_axis_off spines text hatch plt axis plt.bar() plt.axis import figure pyplot highlight_text pypalettes plt.subplots() xlabel ylabel title legend colorbar savefig tight_layout grid set_xlim set_ylim plot scatter hist boxplot imshow cmap alpha bins tick_params annotate quiver contour barh stackplot subplots_adjust axhline axvline semilogx semilogy loglog polar streamplot hexbin pcolor tricontour errorbar clabel set_aspect violinplot set_axis_off spines text hatch plt axis plt.bar() plt.axis import figure pyplot highlight_text pypalettes plt.subplots() xlabel ylabel title legend colorbar savefig tight_layout grid set_xlim set_ylim plot scatter hist boxplot imshow cmap alpha bins tick_params annotate quiver contour barh stackplot subplots_adjust axhline axvline semilogx semilogy loglog polar streamplot hexbin pcolor tricontour errorbar clabel set_aspect violinplot set_axis_off spines text hatch plt axis plt.bar() plt.axis import figure pyplot highlight_text pypalettes plt.subplots() xlabel ylabel title legend colorbar savefig tight_layout grid set_xlim set_ylim plot scatter hist boxplot imshow cmap alpha bins tick_params annotate quiver contour barh stackplot subplots_adjust axhline axvline semilogx semilogy loglog polar streamplot hexbin pcolor tricontour errorbar clabel set_aspect violinplot set_axis_off spines text hatch plt axis plt.bar() plt.axis import figure pyplot highlight_text pypalettes plt.subplots() xlabel ylabel title legend colorbar savefig tight_layout grid set_xlim set_ylim plot scatter hist boxplot imshow cmap alpha bins tick_params annotate quiver contour barh stackplot subplots_adjust axhline axvline semilogx semilogy loglog polar streamplot hexbin pcolor tricontour errorbar clabel set_aspect violinplot set_axis_off spines text hatch plt axis plt.bar() plt.axis import figure pyplot highlight_text pypalettes plt.subplots() xlabel ylabel title legend colorbar savefig tight_layout grid set_xlim set_ylim plot scatter hist boxplot imshow cmap alpha bins tick_params annotate quiver contour barh stackplot subplots_adjust axhline axvline semilogx semilogy loglog polar streamplot hexbin pcolor tricontour errorbar clabel set_aspect violinplot set_axis_off spines text hatch plt axis plt.bar() plt.axis import figure pyplot highlight_text pypalettes plt.subplots() xlabel ylabel title legend colorbar savefig tight_layout grid set_xlim set_ylim plot scatter hist boxplot imshow cmap alpha bins tick_params annotate quiver contour barh stackplot subplots_adjust axhline axvline semilogx semilogy loglog polar streamplot hexbin pcolor tricontour errorbar clabel set_aspect violinplot set_axis_off spines text hatch plt axis plt.bar() plt.axis import figure pyplot highlight_text pypalettes plt.subplots() xlabel ylabel title legend colorbar savefig tight_layout grid set_xlim set_ylim plot scatter hist boxplot imshow cmap alpha bins tick_params annotate quiver contour barh stackplot subplots_adjust axhline axvline semilogx semilogy loglog polar streamplot hexbin pcolor tricontour errorbar clabel set_aspect violinplot set_axis_off spines text hatch plt axis plt.bar() plt.axis import figure pyplot highlight_text pypalettes plt.subplots() xlabel ylabel title legend colorbar savefig tight_layout grid set_xlim set_ylim plot scatter hist boxplot imshow cmap alpha bins tick_params annotate quiver contour barh stackplot subplots_adjust axhline axvline semilogx semilogy loglog polar streamplot hexbin pcolor tricontour errorbar clabel set_aspect violinplot set_axis_off spines text hatch plt axis plt.bar() plt.axis import figure pyplot highlight_text pypalettes plt.subplots() xlabel ylabel title legend colorbar savefig tight_layout grid set_xlim set_ylim plot scatter hist boxplot imshow cmap alpha bins tick_params annotate quiver contour barh stackplot subplots_adjust axhline axvline semilogx semilogy loglog polar streamplot hexbin pcolor tricontour errorbar clabel set_aspect violinplot set_axis_off spines text hatch plt axis plt.bar() plt.axis import figure pyplot highlight_text pypalettes plt.subplots() xlabel ylabel title legend colorbar savefig tight_layout grid set_xlim set_ylim plot scatter hist boxplot imshow cmap alpha bins tick_params annotate quiver contour barh stackplot subplots_adjust axhline axvline semilogx semilogy loglog polar streamplot hexbin pcolor tricontour errorbar clabel set_aspect violinplot set_axis_off spines text hatch plt axis plt.bar() plt.axis import figure pyplot highlight_text pypalettes plt.subplots() xlabel ylabel title legend colorbar savefig tight_layout grid set_xlim set_ylim plot scatter hist boxplot imshow cmap alpha bins tick_params annotate quiver contour barh stackplot subplots_adjust axhline axvline semilogx semilogy loglog polar streamplot hexbin pcolor tricontour errorbar clabel set_aspect violinplot set_axis_off spines text hatch plt axis plt.bar() plt.axis import figure pyplot highlight_text pypalettes plt.subplots() xlabel ylabel title legend colorbar savefig tight_layout grid set_xlim set_ylim plot scatter hist boxplot imshow cmap alpha bins tick_params annotate quiver contour barh stackplot subplots_adjust axhline axvline semilogx semilogy loglog polar streamplot hexbin pcolor tricontour errorbar clabel set_aspect violinplot set_axis_off spines text hatch plt axis plt.bar() plt.axis import figure pyplot highlight_text pypalettes plt.subplots() xlabel ylabel title legend colorbar savefig tight_layout grid set_xlim set_ylim plot scatter hist boxplot imshow cmap alpha bins tick_params annotate quiver contour barh stackplot subplots_adjust axhline axvline semilogx semilogy loglog polar streamplot hexbin pcolor tricontour errorbar clabel set_aspect violinplot set_axis_off spines text hatch plt axis plt.bar() plt.axis import figure pyplot highlight_text pypalettes plt.subplots() xlabel ylabel title legend colorbar savefig tight_layout grid set_xlim set_ylim plot scatter hist boxplot imshow cmap alpha bins tick_params annotate quiver contour barh stackplot subplots_adjust axhline axvline semilogx semilogy loglog polar streamplot hexbin pcolor tricontour errorbar clabel set_aspect violinplot set_axis_off spines text hatch plt axis plt.bar() plt.axis import figure pyplot highlight_text pypalettes plt.subplots() xlabel ylabel title legend colorbar savefig tight_layout grid set_xlim set_ylim plot scatter hist boxplot imshow cmap alpha bins tick_params annotate quiver contour barh stackplot subplots_adjust axhline axvline semilogx semilogy loglog polar streamplot hexbin pcolor tricontour errorbar clabel set_aspect violinplot set_axis_off spines text hatch plt axis plt.bar() plt.axis import figure pyplot highlight_text pypalettes plt.subplots() xlabel ylabel title legend colorbar savefig tight_layout grid set_xlim set_ylim plot scatter hist boxplot imshow cmap alpha bins tick_params annotate quiver contour barh stackplot subplots_adjust axhline axvline semilogx semilogy loglog polar streamplot hexbin pcolor tricontour errorbar clabel set_aspect violinplot set_axis_off spines text hatch plt axis plt.bar() plt.axis import figure pyplot highlight_text pypalettes plt.subplots() xlabel ylabel title legend colorbar savefig tight_layout grid set_xlim set_ylim plot scatter hist boxplot imshow cmap alpha bins tick_params annotate quiver contour barh stackplot subplots_adjust axhline axvline semilogx semilogy loglog polar streamplot hexbin pcolor tricontour errorbar clabel set_aspect violinplot set_axis_off spines text hatch plt axis plt.bar() plt.axis import figure pyplot highlight_text pypalettes plt.subplots() xlabel ylabel title legend colorbar savefig tight_layout grid set_xlim set_ylim plot scatter hist boxplot imshow cmap alpha bins tick_params annotate quiver contour barh stackplot subplots_adjust axhline axvline semilogx semilogy loglog polar streamplot hexbin pcolor tricontour errorbar clabel set_aspect violinplot set_axis_off spines text hatch plt axis plt.bar() plt.axis import figure pyplot highlight_text pypalettes plt.subplots() xlabel ylabel title legend colorbar savefig tight_layout grid set_xlim set_ylim plot scatter hist boxplot imshow cmap alpha bins tick_params annotate quiver contour barh stackplot subplots_adjust axhline axvline semilogx semilogy loglog polar streamplot hexbin pcolor tricontour errorbar clabel set_aspect violinplot set_axis_off spines text hatch plt axis plt.bar() plt.axis import figure pyplot highlight_text pypalettes plt.subplots() xlabel ylabel title legend colorbar savefig tight_layout grid set_xlim set_ylim plot scatter hist boxplot imshow cmap alpha bins tick_params annotate quiver contour barh stackplot subplots_adjust axhline axvline semilogx semilogy loglog polar streamplot hexbin pcolor tricontour errorbar clabel set_aspect violinplot set_axis_off spines text hatch plt axis plt.bar() plt.axis import figure pyplot highlight_text pypalettes plt.subplots() xlabel ylabel title legend colorbar savefig tight_layout grid set_xlim set_ylim plot scatter hist boxplot imshow cmap alpha bins tick_params annotate quiver contour barh stackplot subplots_adjust axhline axvline semilogx semilogy loglog polar streamplot hexbin pcolor tricontour errorbar clabel set_aspect violinplot set_axis_off spines text hatch plt axis plt.bar() plt.axis import figure pyplot highlight_text pypalettes plt.subplots() xlabel ylabel title legend colorbar savefig tight_layout grid set_xlim set_ylim plot scatter hist boxplot imshow cmap alpha bins tick_params annotate quiver contour barh stackplot subplots_adjust axhline axvline semilogx semilogy loglog polar streamplot hexbin pcolor tricontour errorbar clabel set_aspect violinplot set_axis_off spines text hatch plt axis plt.bar() plt.axis import figure pyplot highlight_text pypalettes plt.subplots() xlabel ylabel title legend colorbar savefig tight_layout grid set_xlim set_ylim plot scatter hist boxplot imshow cmap alpha bins tick_params annotate quiver contour barh stackplot subplots_adjust axhline axvline semilogx semilogy loglog polar streamplot hexbin pcolor tricontour errorbar clabel set_aspect violinplot set_axis_off spines text hatch plt axis plt.bar() plt.axis import figure pyplot highlight_text pypalettes plt.subplots() xlabel ylabel title legend colorbar savefig tight_layout grid set_xlim set_ylim plot scatter hist boxplot imshow cmap alpha bins tick_params annotate quiver contour barh stackplot subplots_adjust axhline axvline semilogx semilogy loglog polar streamplot hexbin pcolor tricontour errorbar clabel set_aspect violinplot set_axis_off spines text hatch plt axis plt.bar() plt.axis import figure pyplot highlight_text pypalettes plt.subplots() xlabel ylabel title legend colorbar savefig tight_layout grid set_xlim set_ylim plot scatter hist boxplot imshow cmap alpha bins tick_params annotate quiver contour barh stackplot subplots_adjust axhline axvline semilogx semilogy loglog polar streamplot hexbin pcolor tricontour errorbar clabel set_aspect violinplot set_axis_off spines text hatch plt axis plt.bar() plt.axis import figure pyplot highlight_text pypalettes plt.subplots() xlabel ylabel title legend colorbar savefig tight_layout grid set_xlim set_ylim plot scatter hist boxplot imshow cmap alpha bins tick_params annotate quiver contour barh stackplot subplots_adjust axhline axvline semilogx semilogy loglog polar streamplot hexbin pcolor tricontour errorbar clabel set_aspect violinplot set_axis_off spines text hatch plt axis plt.bar() plt.axis import figure pyplot highlight_text pypalettes plt.subplots() xlabel ylabel title legend colorbar savefig tight_layout grid set_xlim set_ylim plot scatter hist boxplot imshow cmap alpha bins tick_params annotate quiver contour barh stackplot subplots_adjust axhline axvline semilogx semilogy loglog polar streamplot hexbin pcolor tricontour errorbar clabel set_aspect violinplot set_axis_off spines text hatch plt axis plt.bar() plt.axis import figure pyplot highlight_text pypalettes plt.subplots() xlabel ylabel title legend colorbar savefig tight_layout grid set_xlim set_ylim plot scatter hist boxplot imshow cmap alpha bins tick_params annotate quiver contour barh stackplot subplots_adjust axhline axvline semilogx semilogy loglog polar streamplot hexbin pcolor tricontour errorbar clabel set_aspect violinplot set_axis_off spines text hatch plt axis plt.bar() plt.axis import figure pyplot highlight_text pypalettes plt.subplots() xlabel ylabel title legend colorbar savefig tight_layout grid set_xlim set_ylim plot scatter hist boxplot imshow cmap alpha bins tick_params annotate quiver contour barh stackplot subplots_adjust axhline axvline semilogx semilogy loglog polar streamplot hexbin pcolor tricontour errorbar clabel set_aspect violinplot set_axis_off spines text hatch plt axis plt.bar() plt.axis import figure pyplot highlight_text pypalettes plt.subplots() xlabel ylabel title legend colorbar savefig tight_layout grid set_xlim set_ylim plot scatter hist boxplot imshow cmap alpha bins tick_params annotate quiver contour barh stackplot subplots_adjust axhline axvline semilogx semilogy loglog polar streamplot hexbin pcolor tricontour errorbar clabel set_aspect violinplot set_axis_off spines text hatch plt axis plt.bar() plt.axis import figure pyplot highlight_text pypalettes plt.subplots() xlabel ylabel title legend colorbar savefig tight_layout grid set_xlim set_ylim plot scatter hist boxplot imshow cmap alpha bins tick_params annotate quiver contour barh stackplot subplots_adjust axhline axvline semilogx semilogy loglog polar streamplot hexbin pcolor tricontour errorbar clabel set_aspect violinplot set_axis_off spines text hatch plt axis plt.bar() plt.axis import figure pyplot highlight_text pypalettes plt.subplots() xlabel ylabel title legend colorbar savefig tight_layout grid set_xlim set_ylim plot scatter hist boxplot imshow cmap alpha bins tick_params annotate quiver contour barh stackplot subplots_adjust axhline axvline semilogx semilogy loglog polar streamplot hexbin pcolor tricontour errorbar clabel set_aspect violinplot set_axis_off spines text hatch plt axis plt.bar() plt.axis import figure pyplot highlight_text pypalettes plt.subplots() xlabel ylabel title legend colorbar savefig tight_layout grid set_xlim set_ylim plot scatter hist boxplot imshow cmap alpha bins tick_params annotate quiver contour barh stackplot subplots_adjust axhline axvline semilogx semilogy loglog polar streamplot hexbin pcolor tricontour errorbar clabel set_aspect violinplot set_axis_off spines text hatch plt axis plt.bar() plt.axis import figure pyplot highlight_text pypalettes plt.subplots() xlabel ylabel title legend colorbar savefig tight_layout grid set_xlim set_ylim plot scatter hist boxplot imshow cmap alpha bins tick_params annotate quiver contour barh stackplot subplots_adjust axhline axvline semilogx semilogy loglog polar streamplot hexbin pcolor tricontour errorbar clabel set_aspect violinplot set_axis_off spines text hatch plt axis plt.bar() plt.axis import figure pyplot highlight_text pypalettes plt.subplots() xlabel ylabel title legend colorbar savefig tight_layout grid set_xlim set_ylim plot scatter hist boxplot imshow cmap alpha bins tick_params annotate quiver contour barh stackplot subplots_adjust axhline axvline semilogx semilogy loglog polar streamplot hexbin pcolor tricontour errorbar clabel set_aspect violinplot set_axis_off spines text hatch plt axis plt.bar() plt.axis import figure pyplot highlight_text pypalettes plt.subplots() xlabel ylabel title legend colorbar savefig tight_layout grid set_xlim set_ylim plot scatter hist boxplot imshow cmap alpha bins tick_params annotate quiver contour barh stackplot subplots_adjust axhline axvline semilogx semilogy loglog polar streamplot hexbin pcolor tricontour errorbar clabel set_aspect violinplot set_axis_off spines text hatch plt axis plt.bar() plt.axis import figure pyplot highlight_text pypalettes plt.subplots() xlabel ylabel title legend colorbar savefig tight_layout grid set_xlim set_ylim plot scatter hist boxplot imshow cmap alpha bins tick_params annotate quiver contour barh stackplot subplots_adjust axhline axvline semilogx semilogy loglog polar streamplot hexbin pcolor tricontour errorbar clabel set_aspect violinplot set_axis_off spines text hatch plt axis plt.bar() plt.axis import figure pyplot highlight_text pypalettes plt.subplots() xlabel ylabel title legend colorbar savefig tight_layout grid set_xlim set_ylim plot scatter hist boxplot imshow cmap alpha bins tick_params annotate quiver contour barh stackplot subplots_adjust axhline axvline semilogx semilogy loglog polar streamplot hexbin pcolor tricontour errorbar clabel set_aspect violinplot set_axis_off spines text hatch plt axis plt.bar() plt.axis import figure pyplot highlight_text pypalettes plt.subplots() xlabel ylabel title legend colorbar savefig tight_layout grid set_xlim set_ylim plot scatter hist boxplot imshow cmap alpha bins tick_params annotate quiver contour barh stackplot subplots_adjust axhline axvline semilogx semilogy loglog polar streamplot hexbin pcolor tricontour errorbar clabel set_aspect violinplot set_axis_off spines text hatch plt axis plt.bar() plt.axis import figure pyplot highlight_text pypalettes plt.subplots() xlabel ylabel title legend colorbar savefig tight_layout grid set_xlim set_ylim plot scatter hist boxplot imshow cmap alpha bins tick_params annotate quiver contour barh stackplot subplots_adjust axhline axvline semilogx semilogy loglog polar streamplot hexbin pcolor tricontour errorbar clabel set_aspect violinplot set_axis_off spines text hatch plt axis plt.bar() plt.axis import figure pyplot highlight_text pypalettes plt.subplots() xlabel ylabel title legend colorbar savefig tight_layout grid set_xlim set_ylim plot scatter hist boxplot imshow cmap alpha bins tick_params annotate quiver contour barh stackplot subplots_adjust axhline axvline semilogx semilogy loglog polar streamplot hexbin pcolor tricontour errorbar clabel set_aspect violinplot set_axis_off spines text hatch plt axis plt.bar() plt.axis import figure pyplot highlight_text pypalettes plt.subplots() xlabel ylabel title legend colorbar savefig tight_layout grid set_xlim set_ylim plot scatter hist boxplot imshow cmap alpha bins tick_params annotate quiver contour barh stackplot subplots_adjust axhline axvline semilogx semilogy loglog polar streamplot hexbin pcolor tricontour errorbar clabel set_aspect violinplot set_axis_off spines text hatch plt axis plt.bar() plt.axis import figure pyplot highlight_text pypalettes plt.subplots() xlabel ylabel title legend colorbar savefig tight_layout grid set_xlim set_ylim plot scatter hist boxplot imshow cmap alpha bins tick_params annotate quiver contour barh stackplot subplots_adjust axhline axvline semilogx semilogy loglog polar streamplot hexbin pcolor tricontour errorbar clabel set_aspect violinplot set_axis_off spines text hatch plt axis plt.bar() plt.axis import figure pyplot highlight_text pypalettes plt.subplots() xlabel ylabel title legend colorbar savefig tight_layout grid set_xlim set_ylim plot scatter hist boxplot imshow cmap alpha bins tick_params annotate quiver contour barh stackplot subplots_adjust axhline axvline semilogx semilogy loglog polar streamplot hexbin pcolor tricontour errorbar clabel set_aspect violinplot set_axis_off spines text hatch plt axis plt.bar() plt.axis import figure pyplot highlight_text pypalettes plt.subplots() xlabel ylabel title legend colorbar savefig tight_layout grid set_xlim set_ylim plot scatter hist boxplot imshow cmap alpha bins tick_params annotate quiver contour barh stackplot subplots_adjust axhline axvline semilogx semilogy loglog polar streamplot hexbin pcolor tricontour errorbar clabel set_aspect violinplot set_axis_off spines text hatch plt axis plt.bar() plt.axis import figure pyplot highlight_text pypalettes plt.subplots() xlabel ylabel title legend colorbar savefig tight_layout grid set_xlim set_ylim plot scatter hist boxplot imshow cmap alpha bins tick_params annotate quiver contour barh stackplot subplots_adjust axhline axvline semilogx semilogy loglog polar streamplot hexbin pcolor tricontour errorbar clabel set_aspect violinplot set_axis_off spines text hatch plt axis plt.bar() plt.axis import figure pyplot highlight_text pypalettes plt.subplots() xlabel ylabel title legend colorbar savefig tight_layout grid set_xlim set_ylim plot scatter hist boxplot imshow cmap alpha bins tick_params annotate quiver contour barh stackplot subplots_adjust axhline axvline semilogx semilogy loglog polar streamplot hexbin pcolor tricontour errorbar clabel set_aspect violinplot set_axis_off spines text hatch plt axis plt.bar() plt.axis import figure pyplot highlight_text pypalettes plt.subplots() xlabel ylabel title legend colorbar savefig tight_layout grid set_xlim set_ylim plot scatter hist boxplot imshow cmap alpha bins tick_params annotate quiver contour barh stackplot subplots_adjust axhline axvline semilogx semilogy loglog polar streamplot hexbin pcolor tricontour errorbar clabel set_aspect violinplot set_axis_off spines text hatch plt axis plt.bar() plt.axis import figure pyplot highlight_text pypalettes plt.subplots() xlabel ylabel title legend colorbar savefig tight_layout grid set_xlim set_ylim plot scatter hist boxplot imshow cmap alpha bins tick_params annotate quiver contour barh stackplot subplots_adjust axhline axvline semilogx semilogy loglog polar streamplot hexbin pcolor tricontour errorbar clabel set_aspect violinplot set_axis_off spines text hatch plt axis plt.bar() plt.axis import figure pyplot highlight_text pypalettes plt.subplots() xlabel ylabel title legend colorbar savefig tight_layout grid set_xlim set_ylim plot scatter hist boxplot imshow cmap alpha bins tick_params annotate quiver contour barh stackplot subplots_adjust axhline axvline semilogx semilogy loglog polar streamplot hexbin pcolor tricontour errorbar clabel set_aspect violinplot set_axis_off spines text hatch plt axis plt.bar() plt.axis import figure pyplot highlight_text pypalettes plt.subplots() xlabel ylabel title legend colorbar savefig tight_layout grid set_xlim set_ylim plot scatter hist boxplot imshow cmap alpha bins tick_params annotate quiver contour barh stackplot subplots_adjust axhline axvline semilogx semilogy loglog polar streamplot hexbin pcolor tricontour errorbar clabel set_aspect violinplot set_axis_off spines text hatch plt axis plt.bar() plt.axis import figure pyplot highlight_text pypalettes plt.subplots() xlabel ylabel title legend colorbar savefig tight_layout grid set_xlim set_ylim plot scatter hist boxplot imshow cmap alpha bins tick_params annotate quiver contour barh stackplot subplots_adjust axhline axvline semilogx semilogy loglog polar streamplot hexbin pcolor tricontour errorbar clabel set_aspect violinplot set_axis_off spines text hatch plt axis plt.bar() plt.axis import figure pyplot highlight_text pypalettes plt.subplots() xlabel ylabel title legend colorbar savefig tight_layout grid set_xlim set_ylim plot scatter hist boxplot imshow cmap alpha bins tick_params annotate quiver contour barh stackplot subplots_adjust axhline axvline semilogx semilogy loglog polar streamplot hexbin pcolor tricontour errorbar clabel set_aspect violinplot set_axis_off spines text hatch plt axis plt.bar() plt.axis import figure pyplot highlight_text pypalettes plt.subplots() xlabel ylabel title legend colorbar savefig tight_layout grid set_xlim set_ylim plot scatter hist boxplot imshow cmap alpha bins tick_params annotate quiver contour barh stackplot subplots_adjust axhline axvline semilogx semilogy loglog polar streamplot hexbin pcolor tricontour errorbar clabel set_aspect violinplot set_axis_off spines text hatch plt axis plt.bar() plt.axis import figure pyplot highlight_text pypalettes plt.subplots() xlabel ylabel title legend colorbar savefig tight_layout grid set_xlim set_ylim plot scatter hist boxplot imshow cmap alpha bins tick_params annotate quiver contour barh stackplot subplots_adjust axhline axvline semilogx semilogy loglog polar streamplot hexbin pcolor tricontour errorbar clabel set_aspect violinplot set_axis_off spines text hatch plt axis plt.bar() plt.axis import figure pyplot highlight_text pypalettes plt.subplots() xlabel ylabel title legend colorbar savefig tight_layout grid set_xlim set_ylim plot scatter hist boxplot imshow cmap alpha bins tick_params annotate quiver contour barh stackplot subplots_adjust axhline axvline semilogx semilogy loglog polar streamplot hexbin pcolor tricontour errorbar clabel set_aspect violinplot set_axis_off spines text hatch plt axis plt.bar() plt.axis import figure pyplot highlight_text pypalettes plt.subplots() xlabel ylabel title legend colorbar savefig tight_layout grid set_xlim set_ylim plot scatter hist boxplot imshow cmap alpha bins tick_params annotate quiver contour barh stackplot subplots_adjust axhline axvline semilogx semilogy loglog polar streamplot hexbin pcolor tricontour errorbar clabel set_aspect violinplot set_axis_off spines text hatch plt axis plt.bar() plt.axis import figure pyplot highlight_text pypalettes plt.subplots() xlabel ylabel title legend colorbar savefig tight_layout grid set_xlim set_ylim plot scatter hist boxplot imshow cmap alpha bins tick_params annotate quiver contour barh stackplot subplots_adjust axhline axvline semilogx semilogy loglog polar streamplot hexbin pcolor tricontour errorbar clabel set_aspect violinplot set_axis_off spines text hatch plt axis plt.bar() plt.axis import figure pyplot highlight_text pypalettes plt.subplots() xlabel ylabel title legend colorbar savefig tight_layout grid set_xlim set_ylim plot scatter hist boxplot imshow cmap alpha bins tick_params annotate quiver contour barh stackplot subplots_adjust axhline axvline semilogx semilogy loglog polar streamplot hexbin pcolor tricontour errorbar clabel set_aspect violinplot set_axis_off spines text hatch plt axis plt.bar() plt.axis import figure pyplot highlight_text pypalettes plt.subplots() xlabel ylabel title legend colorbar savefig tight_layout grid set_xlim set_ylim plot scatter hist boxplot imshow cmap alpha bins tick_params annotate quiver contour barh stackplot subplots_adjust axhline axvline semilogx semilogy loglog polar streamplot hexbin pcolor tricontour errorbar clabel set_aspect violinplot set_axis_off spines text hatch plt axis plt.bar() plt.axis import figure pyplot highlight_text pypalettes plt.subplots() xlabel ylabel title legend colorbar savefig tight_layout grid set_xlim set_ylim plot scatter hist boxplot imshow cmap alpha bins tick_params annotate quiver contour barh stackplot subplots_adjust axhline axvline semilogx semilogy loglog polar streamplot hexbin pcolor tricontour errorbar clabel set_aspect violinplot set_axis_off spines text hatch plt axis plt.bar() plt.axis import figure pyplot highlight_text pypalettes plt.subplots() xlabel ylabel title legend colorbar savefig tight_layout grid set_xlim set_ylim plot scatter hist boxplot imshow cmap alpha bins tick_params annotate quiver contour barh stackplot subplots_adjust axhline axvline semilogx semilogy loglog polar streamplot hexbin pcolor tricontour errorbar clabel set_aspect violinplot set_axis_off spines text hatch plt axis plt.bar() plt.axis import figure pyplot highlight_text pypalettes plt.subplots() xlabel ylabel title legend colorbar savefig tight_layout grid set_xlim set_ylim plot scatter hist boxplot imshow cmap alpha bins tick_params annotate quiver contour barh stackplot subplots_adjust axhline axvline semilogx semilogy loglog polar streamplot hexbin pcolor tricontour errorbar clabel set_aspect violinplot set_axis_off spines text hatch plt axis plt.bar() plt.axis import figure pyplot highlight_text pypalettes plt.subplots() xlabel ylabel title legend colorbar savefig tight_layout grid set_xlim set_ylim plot scatter hist boxplot imshow cmap alpha bins tick_params annotate quiver contour barh stackplot subplots_adjust axhline axvline semilogx semilogy loglog polar streamplot hexbin pcolor tricontour errorbar clabel set_aspect violinplot set_axis_off spines text hatch plt axis plt.bar() plt.axis import figure pyplot highlight_text pypalettes plt.subplots() xlabel ylabel title legend colorbar savefig tight_layout grid set_xlim set_ylim plot scatter hist boxplot imshow cmap alpha bins tick_params annotate quiver contour barh stackplot subplots_adjust axhline axvline semilogx semilogy loglog polar streamplot hexbin pcolor tricontour errorbar clabel set_aspect violinplot set_axis_off spines text hatch plt axis plt.bar() plt.axis import figure pyplot highlight_text pypalettes plt.subplots() xlabel ylabel title legend colorbar savefig tight_layout grid set_xlim set_ylim plot scatter hist boxplot imshow cmap alpha bins tick_params annotate quiver contour barh stackplot subplots_adjust axhline axvline semilogx semilogy loglog polar streamplot hexbin pcolor tricontour errorbar clabel set_aspect violinplot set_axis_off spines text hatch plt axis plt.bar() plt.axis import figure pyplot highlight_text pypalettes plt.subplots() xlabel ylabel title legend colorbar savefig tight_layout grid set_xlim set_ylim plot scatter hist boxplot imshow cmap alpha bins tick_params annotate quiver contour barh stackplot subplots_adjust axhline axvline semilogx semilogy loglog polar streamplot hexbin pcolor tricontour errorbar clabel set_aspect violinplot set_axis_off spines text hatch plt axis plt.bar() plt.axis import figure pyplot highlight_text pypalettes plt.subplots() xlabel ylabel title legend colorbar savefig tight_layout grid set_xlim set_ylim plot scatter hist boxplot imshow cmap alpha bins tick_params annotate quiver contour barh stackplot subplots_adjust axhline axvline semilogx semilogy loglog polar streamplot hexbin pcolor tricontour errorbar clabel set_aspect violinplot set_axis_off spines text hatch plt axis plt.bar() plt.axis import figure pyplot highlight_text pypalettes plt.subplots() xlabel ylabel title legend colorbar savefig tight_layout grid set_xlim set_ylim plot scatter hist boxplot imshow cmap alpha bins tick_params annotate quiver contour barh stackplot subplots_adjust axhline axvline semilogx semilogy loglog polar streamplot hexbin pcolor tricontour errorbar clabel set_aspect violinplot set_axis_off spines text hatch plt axis plt.bar() plt.axis import figure pyplot highlight_text pypalettes plt.subplots() xlabel ylabel title legend colorbar savefig tight_layout grid set_xlim set_ylim plot scatter hist boxplot imshow cmap alpha bins tick_params annotate quiver contour barh stackplot subplots_adjust axhline axvline semilogx semilogy loglog polar streamplot hexbin pcolor tricontour errorbar clabel set_aspect violinplot set_axis_off spines text hatch plt axis plt.bar() plt.axis import figure pyplot highlight_text pypalettes plt.subplots() xlabel ylabel title legend colorbar savefig tight_layout grid set_xlim set_ylim plot scatter hist boxplot imshow cmap alpha bins tick_params annotate quiver contour barh stackplot subplots_adjust axhline axvline semilogx semilogy loglog polar streamplot hexbin pcolor tricontour errorbar clabel set_aspect violinplot set_axis_off spines text hatch plt axis plt.bar() plt.axis import figure pyplot highlight_text pypalettes plt.subplots() xlabel ylabel title legend colorbar savefig tight_layout grid set_xlim set_ylim plot scatter hist boxplot imshow cmap alpha bins tick_params annotate quiver contour barh stackplot subplots_adjust axhline axvline semilogx semilogy loglog polar streamplot hexbin pcolor tricontour errorbar clabel set_aspect violinplot set_axis_off spines text hatch plt axis plt.bar() plt.axis import figure pyplot highlight_text pypalettes plt.subplots() xlabel ylabel title legend colorbar savefig tight_layout grid set_xlim set_ylim plot scatter hist boxplot imshow cmap alpha bins tick_params annotate quiver contour barh stackplot subplots_adjust axhline axvline semilogx semilogy loglog polar streamplot hexbin pcolor tricontour errorbar clabel set_aspect violinplot set_axis_off spines text hatch plt axis plt.bar() plt.axis import figure pyplot highlight_text pypalettes plt.subplots() xlabel ylabel title legend colorbar savefig tight_layout grid set_xlim set_ylim plot scatter hist boxplot imshow cmap alpha bins tick_params annotate quiver contour barh stackplot subplots_adjust axhline axvline semilogx semilogy loglog polar streamplot hexbin pcolor tricontour errorbar clabel set_aspect violinplot set_axis_off spines text hatch plt axis plt.bar() plt.axis import figure pyplot highlight_text pypalettes plt.subplots() xlabel ylabel title legend colorbar savefig tight_layout grid set_xlim set_ylim plot scatter hist boxplot imshow cmap alpha bins tick_params annotate quiver contour barh stackplot subplots_adjust axhline axvline semilogx semilogy loglog polar streamplot hexbin pcolor tricontour errorbar clabel set_aspect violinplot set_axis_off spines text hatch plt axis plt.bar() plt.axis import figure pyplot highlight_text pypalettes plt.subplots() xlabel ylabel title legend colorbar savefig tight_layout grid set_xlim set_ylim plot scatter hist boxplot imshow cmap alpha bins tick_params annotate quiver contour barh stackplot subplots_adjust axhline axvline semilogx semilogy loglog polar streamplot hexbin pcolor tricontour errorbar clabel set_aspect violinplot set_axis_off spines text hatch plt axis plt.bar() plt.axis import figure pyplot highlight_text pypalettes plt.subplots() xlabel ylabel title legend colorbar savefig tight_layout grid set_xlim set_ylim plot scatter hist boxplot imshow cmap alpha bins tick_params annotate quiver contour barh stackplot subplots_adjust axhline axvline semilogx semilogy loglog polar streamplot hexbin pcolor tricontour errorbar clabel set_aspect violinplot set_axis_off spines text hatch plt axis plt.bar() plt.axis import figure pyplot highlight_text pypalettes plt.subplots() xlabel ylabel title legend colorbar savefig tight_layout grid set_xlim set_ylim plot scatter hist boxplot imshow cmap alpha bins tick_params annotate quiver contour barh stackplot subplots_adjust axhline axvline semilogx semilogy loglog polar streamplot hexbin pcolor tricontour errorbar clabel set_aspect violinplot set_axis_off spines text hatch plt axis plt.bar() plt.axis import figure pyplot highlight_text pypalettes plt.subplots() xlabel ylabel title legend colorbar savefig tight_layout grid set_xlim set_ylim plot scatter hist boxplot imshow cmap alpha bins tick_params annotate quiver contour barh stackplot subplots_adjust axhline axvline semilogx semilogy loglog polar streamplot hexbin pcolor tricontour errorbar clabel set_aspect violinplot set_axis_off spines text hatch plt axis plt.bar() plt.axis import figure pyplot highlight_text pypalettes plt.subplots() xlabel ylabel title legend colorbar savefig tight_layout grid set_xlim set_ylim plot scatter hist boxplot imshow cmap alpha bins tick_params annotate quiver contour barh stackplot subplots_adjust axhline axvline semilogx semilogy loglog polar streamplot hexbin pcolor tricontour errorbar clabel set_aspect violinplot set_axis_off spines text hatch plt axis plt.bar() plt.axis import figure pyplot highlight_text pypalettes plt.subplots() xlabel ylabel title legend colorbar savefig tight_layout grid set_xlim set_ylim plot scatter hist boxplot imshow cmap alpha bins tick_params annotate quiver contour barh stackplot subplots_adjust axhline axvline semilogx semilogy loglog polar streamplot hexbin pcolor tricontour errorbar clabel set_aspect violinplot set_axis_off spines text hatch plt axis plt.bar() plt.axis import figure pyplot highlight_text pypalettes plt.subplots() xlabel ylabel title legend colorbar savefig tight_layout grid set_xlim set_ylim plot scatter hist boxplot imshow cmap alpha bins tick_params annotate quiver contour barh stackplot subplots_adjust axhline axvline semilogx semilogy loglog polar streamplot hexbin pcolor tricontour errorbar clabel set_aspect violinplot set_axis_off spines text hatch plt axis plt.bar() plt.axis import figure pyplot highlight_text pypalettes plt.subplots() xlabel ylabel title legend colorbar savefig tight_layout grid set_xlim set_ylim plot scatter hist boxplot imshow cmap alpha bins tick_params annotate quiver contour barh stackplot subplots_adjust axhline axvline semilogx semilogy loglog polar streamplot hexbin pcolor tricontour errorbar clabel set_aspect violinplot set_axis_off spines text hatch plt axis plt.bar() plt.axis import figure pyplot highlight_text pypalettes plt.subplots() xlabel ylabel title legend colorbar savefig tight_layout grid set_xlim set_ylim plot scatter hist boxplot imshow cmap alpha bins tick_params annotate quiver contour barh stackplot subplots_adjust axhline axvline semilogx semilogy loglog polar streamplot hexbin pcolor tricontour errorbar clabel set_aspect violinplot set_axis_off spines text hatch plt axis plt.bar() plt.axis import figure pyplot highlight_text pypalettes plt.subplots() xlabel ylabel title legend colorbar savefig tight_layout grid set_xlim set_ylim plot scatter hist boxplot imshow cmap alpha bins tick_params annotate quiver contour barh stackplot subplots_adjust axhline axvline semilogx semilogy loglog polar streamplot hexbin pcolor tricontour errorbar clabel set_aspect violinplot set_axis_off spines text hatch plt axis plt.bar() plt.axis import figure pyplot highlight_text pypalettes plt.subplots() xlabel ylabel title legend colorbar savefig tight_layout grid set_xlim set_ylim plot scatter hist boxplot imshow cmap alpha bins tick_params annotate quiver contour barh stackplot subplots_adjust axhline axvline semilogx semilogy loglog polar streamplot hexbin pcolor tricontour errorbar clabel set_aspect violinplot set_axis_off spines text hatch plt axis plt.bar() plt.axis import figure pyplot highlight_text pypalettes plt.subplots() xlabel ylabel title legend colorbar savefig tight_layout grid set_xlim set_ylim plot scatter hist boxplot imshow cmap alpha bins tick_params annotate quiver contour barh stackplot subplots_adjust axhline axvline semilogx semilogy loglog polar streamplot hexbin pcolor tricontour errorbar clabel set_aspect violinplot set_axis_off spines text hatch plt axis plt.bar() plt.axis import figure pyplot highlight_text pypalettes plt.subplots() xlabel ylabel title legend colorbar savefig tight_layout grid set_xlim set_ylim plot scatter hist boxplot imshow cmap alpha bins tick_params annotate quiver contour barh stackplot subplots_adjust axhline axvline semilogx semilogy loglog polar streamplot hexbin pcolor tricontour errorbar clabel set_aspect violinplot set_axis_off spines text hatch plt axis plt.bar() plt.axis import figure pyplot highlight_text pypalettes plt.subplots() xlabel ylabel title legend colorbar savefig tight_layout grid set_xlim set_ylim plot scatter hist boxplot imshow cmap alpha bins tick_params annotate quiver contour barh stackplot subplots_adjust axhline axvline semilogx semilogy loglog polar streamplot hexbin pcolor tricontour errorbar clabel set_aspect violinplot set_axis_off spines text hatch plt axis plt.bar() plt.axis import figure pyplot highlight_text pypalettes plt.subplots() xlabel ylabel title legend colorbar savefig tight_layout grid set_xlim set_ylim plot scatter hist boxplot imshow cmap alpha bins tick_params annotate quiver contour barh stackplot subplots_adjust axhline axvline semilogx semilogy loglog polar streamplot hexbin pcolor tricontour errorbar clabel set_aspect violinplot set_axis_off spines text hatch plt axis plt.bar() plt.axis import figure pyplot highlight_text pypalettes plt.subplots() xlabel ylabel title legend colorbar savefig tight_layout grid set_xlim set_ylim plot scatter hist boxplot imshow cmap alpha bins tick_params annotate quiver contour barh stackplot subplots_adjust axhline axvline semilogx semilogy loglog polar streamplot hexbin pcolor tricontour errorbar clabel set_aspect violinplot set_axis_off spines text hatch plt axis plt.bar() plt.axis import figure pyplot highlight_text pypalettes plt.subplots() xlabel ylabel title legend colorbar savefig tight_layout grid set_xlim set_ylim plot scatter hist boxplot imshow cmap alpha bins tick_params annotate quiver contour barh stackplot subplots_adjust axhline axvline semilogx semilogy loglog polar streamplot hexbin pcolor tricontour errorbar clabel set_aspect violinplot set_axis_off spines text hatch plt axis plt.bar() plt.axis import figure pyplot highlight_text pypalettes plt.subplots() xlabel ylabel title legend colorbar savefig tight_layout grid set_xlim set_ylim plot scatter hist boxplot imshow cmap alpha bins tick_params annotate quiver contour barh stackplot subplots_adjust axhline axvline semilogx semilogy loglog polar streamplot hexbin pcolor tricontour errorbar clabel set_aspect violinplot set_axis_off spines text hatch plt axis plt.bar() plt.axis import figure pyplot highlight_text pypalettes plt.subplots() xlabel ylabel title legend colorbar savefig tight_layout grid set_xlim set_ylim plot scatter hist boxplot imshow cmap alpha bins tick_params annotate quiver contour barh stackplot subplots_adjust axhline axvline semilogx semilogy loglog polar streamplot hexbin pcolor tricontour errorbar clabel set_aspect violinplot set_axis_off spines text hatch plt axis plt.bar() plt.axis import figure pyplot highlight_text pypalettes plt.subplots() xlabel ylabel title legend colorbar savefig tight_layout grid set_xlim set_ylim plot scatter hist boxplot imshow cmap alpha bins tick_params annotate quiver contour barh stackplot subplots_adjust axhline axvline semilogx semilogy loglog polar streamplot hexbin pcolor tricontour errorbar clabel set_aspect violinplot set_axis_off spines text hatch plt axis plt.bar() plt.axis import figure pyplot highlight_text pypalettes plt.subplots() xlabel ylabel title legend colorbar savefig tight_layout grid set_xlim set_ylim plot scatter hist boxplot imshow cmap alpha bins tick_params annotate quiver contour barh stackplot subplots_adjust axhline axvline semilogx semilogy loglog polar streamplot hexbin pcolor tricontour errorbar clabel set_aspect violinplot set_axis_off spines text hatch plt axis plt.bar() plt.axis import figure pyplot highlight_text pypalettes plt.subplots() xlabel ylabel title legend colorbar savefig tight_layout grid set_xlim set_ylim plot scatter hist boxplot imshow cmap alpha bins tick_params annotate quiver contour barh stackplot subplots_adjust axhline axvline semilogx semilogy loglog polar streamplot hexbin pcolor tricontour errorbar clabel set_aspect violinplot set_axis_off spines text hatch plt axis plt.bar() plt.axis import figure pyplot highlight_text pypalettes plt.subplots() xlabel ylabel title legend colorbar savefig tight_layout grid set_xlim set_ylim plot scatter hist boxplot imshow cmap alpha bins tick_params annotate quiver contour barh stackplot subplots_adjust axhline axvline semilogx semilogy loglog polar streamplot hexbin pcolor tricontour errorbar clabel set_aspect violinplot set_axis_off spines text hatch plt axis plt.bar() plt.axis import figure pyplot highlight_text pypalettes plt.subplots() xlabel ylabel title legend colorbar savefig tight_layout grid set_xlim set_ylim plot scatter hist boxplot imshow cmap alpha bins tick_params annotate quiver contour barh stackplot subplots_adjust axhline axvline semilogx semilogy loglog polar streamplot hexbin pcolor tricontour errorbar clabel set_aspect violinplot set_axis_off spines text hatch plt axis plt.bar() plt.axis import figure pyplot highlight_text pypalettes plt.subplots() xlabel ylabel title legend colorbar savefig tight_layout grid set_xlim set_ylim plot scatter hist boxplot imshow cmap alpha bins tick_params annotate quiver contour barh stackplot subplots_adjust axhline axvline semilogx semilogy loglog polar streamplot hexbin pcolor tricontour errorbar clabel set_aspect violinplot set_axis_off spines text hatch plt axis plt.bar() plt.axis import figure pyplot highlight_text pypalettes plt.subplots() xlabel ylabel title legend colorbar savefig tight_layout grid set_xlim set_ylim plot scatter hist boxplot imshow cmap alpha bins tick_params annotate quiver contour barh stackplot subplots_adjust axhline axvline semilogx semilogy loglog polar streamplot hexbin pcolor tricontour errorbar clabel set_aspect violinplot set_axis_off spines text hatch plt axis plt.bar() plt.axis import figure pyplot highlight_text pypalettes plt.subplots() xlabel ylabel title legend colorbar savefig tight_layout grid set_xlim set_ylim plot scatter hist boxplot imshow cmap alpha bins tick_params annotate quiver contour barh stackplot subplots_adjust axhline axvline semilogx semilogy loglog polar streamplot hexbin pcolor tricontour errorbar clabel set_aspect violinplot set_axis_off spines text hatch plt axis plt.bar() plt.axis import figure pyplot highlight_text pypalettes plt.subplots() xlabel ylabel title legend colorbar savefig tight_layout grid set_xlim set_ylim plot scatter hist boxplot imshow cmap alpha bins tick_params annotate quiver contour barh stackplot subplots_adjust axhline axvline semilogx semilogy loglog polar streamplot hexbin pcolor tricontour errorbar clabel set_aspect violinplot set_axis_off spines text hatch plt axis plt.bar() plt.axis import figure pyplot highlight_text pypalettes plt.subplots() xlabel ylabel title legend colorbar savefig tight_layout grid set_xlim set_ylim plot scatter hist boxplot imshow cmap alpha bins tick_params annotate quiver contour barh stackplot subplots_adjust axhline axvline semilogx semilogy loglog polar streamplot hexbin pcolor tricontour errorbar clabel set_aspect violinplot set_axis_off spines text hatch plt axis plt.bar() plt.axis import figure pyplot highlight_text pypalettes plt.subplots() xlabel ylabel title legend colorbar savefig tight_layout grid set_xlim set_ylim plot scatter hist boxplot imshow cmap alpha bins tick_params annotate quiver contour barh stackplot subplots_adjust axhline axvline semilogx semilogy loglog polar streamplot hexbin pcolor tricontour errorbar clabel set_aspect violinplot set_axis_off spines text hatch plt axis plt.bar() plt.axis import figure pyplot highlight_text pypalettes plt.subplots() xlabel ylabel title legend colorbar savefig tight_layout grid set_xlim set_ylim plot scatter hist boxplot imshow cmap alpha bins tick_params annotate quiver contour barh stackplot subplots_adjust axhline axvline semilogx semilogy loglog polar streamplot hexbin pcolor tricontour errorbar clabel set_aspect violinplot set_axis_off spines text hatch plt axis plt.bar() plt.axis import figure pyplot highlight_text pypalettes plt.subplots() xlabel ylabel title legend colorbar savefig tight_layout grid set_xlim set_ylim plot scatter hist boxplot imshow cmap alpha bins tick_params annotate quiver contour barh stackplot subplots_adjust axhline axvline semilogx semilogy loglog polar streamplot hexbin pcolor tricontour errorbar clabel set_aspect violinplot set_axis_off spines text hatch plt axis plt.bar() plt.axis import figure pyplot highlight_text pypalettes plt.subplots() xlabel ylabel title legend colorbar savefig tight_layout grid set_xlim set_ylim plot scatter hist boxplot imshow cmap alpha bins tick_params annotate quiver contour barh stackplot subplots_adjust axhline axvline semilogx semilogy loglog polar streamplot hexbin pcolor tricontour errorbar clabel set_aspect violinplot set_axis_off spines text hatch plt axis plt.bar() plt.axis import figure pyplot highlight_text pypalettes plt.subplots() xlabel ylabel title legend colorbar savefig tight_layout grid set_xlim set_ylim plot scatter hist boxplot imshow cmap alpha bins tick_params annotate quiver contour barh stackplot subplots_adjust axhline axvline semilogx semilogy loglog polar streamplot hexbin pcolor tricontour errorbar clabel set_aspect violinplot set_axis_off spines text hatch plt axis plt.bar() plt.axis import figure pyplot highlight_text pypalettes plt.subplots() xlabel ylabel title legend colorbar savefig tight_layout grid set_xlim set_ylim plot scatter hist boxplot imshow cmap alpha bins tick_params annotate quiver contour barh stackplot subplots_adjust axhline axvline semilogx semilogy loglog polar streamplot hexbin pcolor tricontour errorbar clabel set_aspect violinplot set_axis_off spines text hatch plt axis plt.bar() plt.axis import figure pyplot highlight_text pypalettes plt.subplots() xlabel ylabel title legend colorbar savefig tight_layout grid set_xlim set_ylim plot scatter hist boxplot imshow cmap alpha bins tick_params annotate quiver contour barh stackplot subplots_adjust axhline axvline semilogx semilogy loglog polar streamplot hexbin pcolor tricontour errorbar clabel set_aspect violinplot set_axis_off spines text hatch plt axis plt.bar() plt.axis import figure pyplot highlight_text pypalettes plt.subplots() xlabel ylabel title legend colorbar savefig tight_layout grid set_xlim set_ylim plot scatter hist boxplot imshow cmap alpha bins tick_params annotate quiver contour barh stackplot subplots_adjust axhline axvline semilogx semilogy loglog polar streamplot hexbin pcolor tricontour errorbar clabel set_aspect violinplot set_axis_off spines text hatch plt axis plt.bar() plt.axis import figure pyplot highlight_text pypalettes plt.subplots() xlabel ylabel title legend colorbar savefig tight_layout grid set_xlim set_ylim plot scatter hist boxplot imshow cmap alpha bins tick_params annotate quiver contour barh stackplot subplots_adjust axhline axvline semilogx semilogy loglog polar streamplot hexbin pcolor tricontour errorbar clabel set_aspect violinplot set_axis_off spines text hatch plt axis plt.bar() plt.axis import figure pyplot highlight_text pypalettes plt.subplots() xlabel ylabel title legend colorbar savefig tight_layout grid set_xlim set_ylim plot scatter hist boxplot imshow cmap alpha bins tick_params annotate quiver contour barh stackplot subplots_adjust axhline axvline semilogx semilogy loglog polar streamplot hexbin pcolor tricontour errorbar clabel set_aspect violinplot set_axis_off spines text hatch plt axis plt.bar() plt.axis import figure pyplot highlight_text pypalettes plt.subplots() xlabel ylabel title legend colorbar savefig tight_layout grid set_xlim set_ylim plot scatter hist boxplot imshow cmap alpha bins tick_params annotate quiver contour barh stackplot subplots_adjust axhline axvline semilogx semilogy loglog polar streamplot hexbin pcolor tricontour errorbar clabel set_aspect violinplot set_axis_off spines text hatch plt axis plt.bar() plt.axis import figure pyplot highlight_text pypalettes plt.subplots() xlabel ylabel title legend colorbar savefig tight_layout grid set_xlim set_ylim plot scatter hist boxplot imshow cmap alpha bins tick_params annotate quiver contour barh stackplot subplots_adjust axhline axvline semilogx semilogy loglog polar streamplot hexbin pcolor tricontour errorbar clabel set_aspect violinplot set_axis_off spines text hatch plt axis plt.bar() plt.axis import figure pyplot highlight_text pypalettes plt.subplots() xlabel ylabel title legend colorbar savefig tight_layout grid set_xlim set_ylim plot scatter hist boxplot imshow cmap alpha bins tick_params annotate quiver contour barh stackplot subplots_adjust axhline axvline semilogx semilogy loglog polar streamplot hexbin pcolor tricontour errorbar clabel set_aspect violinplot set_axis_off spines text hatch plt axis plt.bar() plt.axis import figure pyplot highlight_text pypalettes plt.subplots() xlabel ylabel title legend colorbar savefig tight_layout grid set_xlim set_ylim plot scatter hist boxplot imshow cmap alpha bins tick_params annotate quiver contour barh stackplot subplots_adjust axhline axvline semilogx semilogy loglog polar streamplot hexbin pcolor tricontour errorbar clabel set_aspect violinplot set_axis_off spines text hatch plt axis plt.bar() plt.axis import figure pyplot highlight_text pypalettes plt.subplots() xlabel ylabel title legend colorbar savefig tight_layout grid set_xlim set_ylim plot scatter hist boxplot imshow cmap alpha bins tick_params annotate quiver contour barh stackplot subplots_adjust axhline axvline semilogx semilogy loglog polar streamplot hexbin pcolor tricontour errorbar clabel set_aspect violinplot set_axis_off spines text hatch plt axis plt.bar() plt.axis import figure pyplot highlight_text pypalettes plt.subplots() xlabel ylabel title legend colorbar savefig tight_layout grid set_xlim set_ylim plot scatter hist boxplot imshow cmap alpha bins tick_params annotate quiver contour barh stackplot subplots_adjust axhline axvline semilogx semilogy loglog polar streamplot hexbin pcolor tricontour errorbar clabel set_aspect violinplot set_axis_off spines text hatch plt axis plt.bar() plt.axis import figure pyplot highlight_text pypalettes plt.subplots() xlabel ylabel title legend colorbar savefig tight_layout grid set_xlim set_ylim plot scatter hist boxplot imshow cmap alpha bins tick_params annotate quiver contour barh stackplot subplots_adjust axhline axvline semilogx semilogy loglog polar streamplot hexbin pcolor tricontour errorbar clabel set_aspect violinplot set_axis_off spines text hatch plt axis plt.bar() plt.axis import figure pyplot highlight_text pypalettes plt.subplots() xlabel ylabel title legend colorbar savefig tight_layout grid set_xlim set_ylim plot scatter hist boxplot imshow cmap alpha bins tick_params annotate quiver contour barh stackplot subplots_adjust axhline axvline semilogx semilogy loglog polar streamplot hexbin pcolor tricontour errorbar clabel set_aspect violinplot set_axis_off spines text hatch plt axis plt.bar() plt.axis import figure pyplot highlight_text pypalettes plt.subplots() xlabel ylabel title legend colorbar savefig tight_layout grid set_xlim set_ylim plot scatter hist boxplot imshow cmap alpha bins tick_params annotate quiver contour barh stackplot subplots_adjust axhline axvline semilogx semilogy loglog polar streamplot hexbin pcolor tricontour errorbar clabel set_aspect violinplot set_axis_off spines text hatch plt axis plt.bar() plt.axis import figure pyplot highlight_text pypalettes plt.subplots() xlabel ylabel title legend colorbar savefig tight_layout grid set_xlim set_ylim plot scatter hist boxplot imshow cmap alpha bins tick_params annotate quiver contour barh stackplot subplots_adjust axhline axvline semilogx semilogy loglog polar streamplot hexbin pcolor tricontour errorbar clabel set_aspect violinplot set_axis_off spines text hatch plt axis plt.bar() plt.axis import figure pyplot highlight_text pypalettes plt.subplots() xlabel ylabel title legend colorbar savefig tight_layout grid set_xlim set_ylim plot scatter hist boxplot imshow cmap alpha bins tick_params annotate quiver contour barh stackplot subplots_adjust axhline axvline semilogx semilogy loglog polar streamplot hexbin pcolor tricontour errorbar clabel set_aspect violinplot set_axis_off spines text hatch plt axis plt.bar() plt.axis import figure pyplot highlight_text pypalettes plt.subplots() xlabel ylabel title legend colorbar savefig tight_layout grid set_xlim set_ylim plot scatter hist boxplot imshow cmap alpha bins tick_params annotate quiver contour barh stackplot subplots_adjust axhline axvline semilogx semilogy loglog polar streamplot hexbin pcolor tricontour errorbar clabel set_aspect violinplot set_axis_off spines text hatch plt axis plt.bar() plt.axis import figure pyplot highlight_text pypalettes plt.subplots() xlabel ylabel title legend colorbar savefig tight_layout grid set_xlim set_ylim plot scatter hist boxplot imshow cmap alpha bins tick_params annotate quiver contour barh stackplot subplots_adjust axhline axvline semilogx semilogy loglog polar streamplot hexbin pcolor tricontour errorbar clabel set_aspect violinplot set_axis_off spines text hatch plt axis plt.bar() plt.axis import figure pyplot highlight_text pypalettes plt.subplots() xlabel ylabel title legend colorbar savefig tight_layout grid set_xlim set_ylim plot scatter hist boxplot imshow cmap alpha bins tick_params annotate quiver contour barh stackplot subplots_adjust axhline axvline semilogx semilogy loglog polar streamplot hexbin pcolor tricontour errorbar clabel set_aspect violinplot set_axis_off spines text hatch plt axis plt.bar() plt.axis import figure pyplot highlight_text pypalettes plt.subplots() xlabel ylabel title legend colorbar savefig tight_layout grid set_xlim set_ylim plot scatter hist boxplot imshow cmap alpha bins tick_params annotate quiver contour barh stackplot subplots_adjust axhline axvline semilogx semilogy loglog polar streamplot hexbin pcolor tricontour errorbar clabel set_aspect violinplot set_axis_off spines text hatch plt axis plt.bar() plt.axis import figure pyplot highlight_text pypalettes plt.subplots() xlabel ylabel title legend colorbar savefig tight_layout grid set_xlim set_ylim plot scatter hist boxplot imshow cmap alpha bins tick_params annotate quiver contour barh stackplot subplots_adjust axhline axvline semilogx semilogy loglog polar streamplot hexbin pcolor tricontour errorbar clabel set_aspect violinplot set_axis_off spines text hatch plt axis plt.bar() plt.axis import figure pyplot highlight_text pypalettes plt.subplots() xlabel ylabel title legend colorbar savefig tight_layout grid set_xlim set_ylim plot scatter hist boxplot imshow cmap alpha bins tick_params annotate quiver contour barh stackplot subplots_adjust axhline axvline semilogx semilogy loglog polar streamplot hexbin pcolor tricontour errorbar clabel set_aspect violinplot set_axis_off spines text hatch plt axis plt.bar() plt.axis import figure pyplot highlight_text pypalettes plt.subplots() xlabel ylabel title legend colorbar savefig tight_layout grid set_xlim set_ylim plot scatter hist boxplot imshow cmap alpha bins tick_params annotate quiver contour barh stackplot subplots_adjust axhline axvline semilogx semilogy loglog polar streamplot hexbin pcolor tricontour errorbar clabel set_aspect violinplot set_axis_off spines text hatch plt axis plt.bar() plt.axis import figure pyplot highlight_text pypalettes plt.subplots() xlabel ylabel title legend colorbar savefig tight_layout grid set_xlim set_ylim plot scatter hist boxplot imshow cmap alpha bins tick_params annotate quiver contour barh stackplot subplots_adjust axhline axvline semilogx semilogy loglog polar streamplot hexbin pcolor tricontour errorbar clabel set_aspect violinplot set_axis_off spines text hatch plt axis plt.bar() plt.axis import figure pyplot highlight_text pypalettes plt.subplots() xlabel ylabel title legend colorbar savefig tight_layout grid set_xlim set_ylim plot scatter hist boxplot imshow cmap alpha bins tick_params annotate quiver contour barh stackplot subplots_adjust axhline axvline semilogx semilogy loglog polar streamplot hexbin pcolor tricontour errorbar clabel set_aspect violinplot set_axis_off spines text hatch plt axis plt.bar() plt.axis import figure pyplot highlight_text pypalettes plt.subplots() xlabel ylabel title legend colorbar savefig tight_layout grid set_xlim set_ylim plot scatter hist boxplot imshow cmap alpha bins tick_params annotate quiver contour barh stackplot subplots_adjust axhline axvline semilogx semilogy loglog polar streamplot hexbin pcolor tricontour errorbar clabel set_aspect violinplot set_axis_off spines text hatch plt axis plt.bar() plt.axis import figure pyplot highlight_text pypalettes plt.subplots() xlabel ylabel title legend colorbar savefig tight_layout grid set_xlim set_ylim plot scatter hist boxplot imshow cmap alpha bins tick_params annotate quiver contour barh stackplot subplots_adjust axhline axvline semilogx semilogy loglog polar streamplot hexbin pcolor tricontour errorbar clabel set_aspect violinplot set_axis_off spines text hatch plt axis plt.bar() plt.axis import figure pyplot highlight_text pypalettes plt.subplots() xlabel ylabel title legend colorbar savefig tight_layout grid set_xlim set_ylim plot scatter hist boxplot imshow cmap alpha bins tick_params annotate quiver contour barh stackplot subplots_adjust axhline axvline semilogx semilogy loglog polar streamplot hexbin pcolor tricontour errorbar clabel set_aspect violinplot set_axis_off spines text hatch plt axis plt.bar() plt.axis import figure pyplot highlight_text pypalettes plt.subplots() xlabel ylabel title legend colorbar savefig tight_layout grid set_xlim set_ylim plot scatter hist boxplot imshow cmap alpha bins tick_params annotate quiver contour barh stackplot subplots_adjust axhline axvline semilogx semilogy loglog polar streamplot hexbin pcolor tricontour errorbar clabel set_aspect violinplot set_axis_off spines text hatch plt axis plt.bar() plt.axis import figure pyplot highlight_text pypalettes plt.subplots() xlabel ylabel title legend colorbar savefig tight_layout grid set_xlim set_ylim plot scatter hist boxplot imshow cmap alpha bins tick_params annotate quiver contour barh stackplot subplots_adjust axhline axvline semilogx semilogy loglog polar streamplot hexbin pcolor tricontour errorbar clabel set_aspect violinplot set_axis_off spines text hatch plt axis plt.bar() plt.axis import figure pyplot highlight_text pypalettes plt.subplots() xlabel ylabel title legend colorbar savefig tight_layout grid set_xlim set_ylim plot scatter hist boxplot imshow cmap alpha bins tick_params annotate quiver contour barh stackplot subplots_adjust axhline axvline semilogx semilogy loglog polar streamplot hexbin pcolor tricontour errorbar clabel set_aspect violinplot set_axis_off spines text hatch plt axis plt.bar() plt.axis import figure pyplot highlight_text pypalettes plt.subplots() xlabel ylabel title legend colorbar savefig tight_layout grid set_xlim set_ylim plot scatter hist boxplot imshow cmap alpha bins tick_params annotate quiver contour barh stackplot subplots_adjust axhline axvline semilogx semilogy loglog polar streamplot hexbin pcolor tricontour errorbar clabel set_aspect violinplot set_axis_off spines text hatch plt axis plt.bar() plt.axis import figure pyplot highlight_text pypalettes plt.subplots() xlabel ylabel title legend colorbar savefig tight_layout grid set_xlim set_ylim plot scatter hist boxplot imshow cmap alpha bins tick_params annotate quiver contour barh stackplot subplots_adjust axhline axvline semilogx semilogy loglog polar streamplot hexbin pcolor tricontour errorbar clabel set_aspect violinplot set_axis_off spines text hatch plt axis plt.bar() plt.axis import figure pyplot highlight_text pypalettes plt.subplots() xlabel ylabel title legend colorbar savefig tight_layout grid set_xlim set_ylim plot scatter hist boxplot imshow cmap alpha bins tick_params annotate quiver contour barh stackplot subplots_adjust axhline axvline semilogx semilogy loglog polar streamplot hexbin pcolor tricontour errorbar clabel set_aspect violinplot set_axis_off spines text hatch plt axis plt.bar() plt.axis import figure pyplot highlight_text pypalettes plt.subplots() xlabel ylabel title legend colorbar savefig tight_layout grid set_xlim set_ylim plot scatter hist boxplot imshow cmap alpha bins tick_params annotate quiver contour barh stackplot subplots_adjust axhline axvline semilogx semilogy loglog polar streamplot hexbin pcolor tricontour errorbar clabel set_aspect violinplot set_axis_off spines text hatch plt axis plt.bar() plt.axis import figure pyplot highlight_text pypalettes plt.subplots() xlabel ylabel title legend colorbar savefig tight_layout grid set_xlim set_ylim plot scatter hist boxplot imshow cmap alpha bins tick_params annotate quiver contour barh stackplot subplots_adjust axhline axvline semilogx semilogy loglog polar streamplot hexbin pcolor tricontour errorbar clabel set_aspect violinplot set_axis_off spines text hatch plt axis plt.bar() plt.axis import figure pyplot highlight_text pypalettes plt.subplots() xlabel ylabel title legend colorbar savefig tight_layout grid set_xlim set_ylim plot scatter hist boxplot imshow cmap alpha bins tick_params annotate quiver contour barh stackplot subplots_adjust axhline axvline semilogx semilogy loglog polar streamplot hexbin pcolor tricontour errorbar clabel set_aspect violinplot set_axis_off spines text hatch plt axis plt.bar() plt.axis import figure pyplot highlight_text pypalettes plt.subplots() xlabel ylabel title legend colorbar savefig tight_layout grid set_xlim set_ylim plot scatter hist boxplot imshow cmap alpha bins tick_params annotate quiver contour barh stackplot subplots_adjust axhline axvline semilogx semilogy loglog polar streamplot hexbin pcolor tricontour errorbar clabel set_aspect violinplot set_axis_off spines text hatch plt axis plt.bar() plt.axis import figure pyplot highlight_text pypalettes plt.subplots() xlabel ylabel title legend colorbar savefig tight_layout grid set_xlim set_ylim plot scatter hist boxplot imshow cmap alpha bins tick_params annotate quiver contour barh stackplot subplots_adjust axhline axvline semilogx semilogy loglog polar streamplot hexbin pcolor tricontour errorbar clabel set_aspect violinplot set_axis_off spines text hatch plt axis plt.bar() plt.axis import figure pyplot highlight_text pypalettes plt.subplots() xlabel ylabel title legend colorbar savefig tight_layout grid set_xlim set_ylim plot scatter hist boxplot imshow cmap alpha bins tick_params annotate quiver contour barh stackplot subplots_adjust axhline axvline semilogx semilogy loglog polar streamplot hexbin pcolor tricontour errorbar clabel set_aspect violinplot set_axis_off spines text hatch plt axis plt.bar() plt.axis import figure pyplot highlight_text pypalettes plt.subplots() xlabel ylabel title legend colorbar savefig tight_layout grid set_xlim set_ylim plot scatter hist boxplot imshow cmap alpha bins tick_params annotate quiver contour barh stackplot subplots_adjust axhline axvline semilogx semilogy loglog polar streamplot hexbin pcolor tricontour errorbar clabel set_aspect violinplot set_axis_off spines text hatch plt axis plt.bar() plt.axis import figure pyplot highlight_text pypalettes plt.subplots() xlabel ylabel title legend colorbar savefig tight_layout grid set_xlim set_ylim plot scatter hist boxplot imshow cmap alpha bins tick_params annotate quiver contour barh stackplot subplots_adjust axhline axvline semilogx semilogy loglog polar streamplot hexbin pcolor tricontour errorbar clabel set_aspect violinplot set_axis_off spines text hatch plt axis plt.bar() plt.axis import figure pyplot highlight_text pypalettes plt.subplots() xlabel ylabel title legend colorbar savefig tight_layout grid set_xlim set_ylim plot scatter hist boxplot imshow cmap alpha bins tick_params annotate quiver contour barh stackplot subplots_adjust axhline axvline semilogx semilogy loglog polar streamplot hexbin pcolor tricontour errorbar clabel set_aspect violinplot set_axis_off spines text hatch plt axis plt.bar() plt.axis import figure pyplot highlight_text pypalettes plt.subplots() xlabel ylabel title legend colorbar savefig tight_layout grid set_xlim set_ylim plot scatter hist boxplot imshow cmap alpha bins tick_params annotate quiver contour barh stackplot subplots_adjust axhline axvline semilogx semilogy loglog polar streamplot hexbin pcolor tricontour errorbar clabel set_aspect violinplot set_axis_off spines text hatch plt axis plt.bar() plt.axis import figure pyplot highlight_text pypalettes plt.subplots() xlabel ylabel title legend colorbar savefig tight_layout grid set_xlim set_ylim plot scatter hist boxplot imshow cmap alpha bins tick_params annotate quiver contour barh stackplot subplots_adjust axhline axvline semilogx semilogy loglog polar streamplot hexbin pcolor tricontour errorbar clabel set_aspect violinplot set_axis_off spines text hatch plt axis plt.bar() plt.axis import figure pyplot highlight_text pypalettes plt.subplots() xlabel ylabel title legend colorbar savefig tight_layout grid set_xlim set_ylim plot scatter hist boxplot imshow cmap alpha bins tick_params annotate quiver contour barh stackplot subplots_adjust axhline axvline semilogx semilogy loglog polar streamplot hexbin pcolor tricontour errorbar clabel set_aspect violinplot set_axis_off spines text hatch plt axis plt.bar() plt.axis import figure pyplot highlight_text pypalettes plt.subplots() xlabel ylabel title legend colorbar savefig tight_layout grid set_xlim set_ylim plot scatter hist boxplot imshow cmap alpha bins tick_params annotate quiver contour barh stackplot subplots_adjust axhline axvline semilogx semilogy loglog polar streamplot hexbin pcolor tricontour errorbar clabel set_aspect violinplot set_axis_off spines text hatch plt axis plt.bar() plt.axis import figure pyplot highlight_text pypalettes plt.subplots() xlabel ylabel title legend colorbar savefig tight_layout grid set_xlim set_ylim plot scatter hist boxplot imshow cmap alpha bins tick_params annotate quiver contour barh stackplot subplots_adjust axhline axvline semilogx semilogy loglog polar streamplot hexbin pcolor tricontour errorbar clabel set_aspect violinplot set_axis_off spines text hatch plt axis plt.bar() plt.axis import figure pyplot highlight_text pypalettes plt.subplots() xlabel ylabel title legend colorbar savefig tight_layout grid set_xlim set_ylim plot scatter hist boxplot imshow cmap alpha bins tick_params annotate quiver contour barh stackplot subplots_adjust axhline axvline semilogx semilogy loglog polar streamplot hexbin pcolor tricontour errorbar clabel set_aspect violinplot set_axis_off spines text hatch plt axis plt.bar() plt.axis import figure pyplot highlight_text pypalettes plt.subplots() xlabel ylabel title legend colorbar savefig tight_layout grid set_xlim set_ylim plot scatter hist boxplot imshow cmap alpha bins tick_params annotate quiver contour barh stackplot subplots_adjust axhline axvline semilogx semilogy loglog polar streamplot hexbin pcolor tricontour errorbar clabel set_aspect violinplot set_axis_off spines text hatch plt axis plt.bar() plt.axis import figure pyplot highlight_text pypalettes plt.subplots() xlabel ylabel title legend colorbar savefig tight_layout grid set_xlim set_ylim plot scatter hist boxplot imshow cmap alpha bins tick_params annotate quiver contour barh stackplot subplots_adjust axhline axvline semilogx semilogy loglog polar streamplot hexbin pcolor tricontour errorbar clabel set_aspect violinplot set_axis_off spines text hatch plt axis plt.bar() plt.axis import figure pyplot highlight_text pypalettes plt.subplots() xlabel ylabel title legend colorbar savefig tight_layout grid set_xlim set_ylim plot scatter hist boxplot imshow cmap alpha bins tick_params annotate quiver contour barh stackplot subplots_adjust axhline axvline semilogx semilogy loglog polar streamplot hexbin pcolor tricontour errorbar clabel set_aspect violinplot set_axis_off spines text hatch plt axis plt.bar() plt.axis import figure pyplot highlight_text pypalettes plt.subplots() xlabel ylabel title legend colorbar savefig tight_layout grid set_xlim set_ylim plot scatter hist boxplot imshow cmap alpha bins tick_params annotate quiver contour barh stackplot subplots_adjust axhline axvline semilogx semilogy loglog polar streamplot hexbin pcolor tricontour errorbar clabel set_aspect violinplot set_axis_off spines text hatch plt axis plt.bar() plt.axis import figure pyplot highlight_text pypalettes plt.subplots() xlabel ylabel title legend colorbar savefig tight_layout grid set_xlim set_ylim plot scatter hist boxplot imshow cmap alpha bins tick_params annotate quiver contour barh stackplot subplots_adjust axhline axvline semilogx semilogy loglog polar streamplot hexbin pcolor tricontour errorbar clabel set_aspect violinplot set_axis_off spines text hatch plt axis plt.bar() plt.axis import figure pyplot highlight_text pypalettes plt.subplots() xlabel ylabel title legend colorbar savefig tight_layout grid set_xlim set_ylim plot scatter hist boxplot imshow cmap alpha bins tick_params annotate quiver contour barh stackplot subplots_adjust axhline axvline semilogx semilogy loglog polar streamplot hexbin pcolor tricontour errorbar clabel set_aspect violinplot set_axis_off spines text hatch plt axis plt.bar() plt.axis import figure pyplot highlight_text pypalettes plt.subplots() xlabel ylabel title legend colorbar savefig tight_layout grid set_xlim set_ylim plot scatter hist boxplot imshow cmap alpha bins tick_params annotate quiver contour barh stackplot subplots_adjust axhline axvline semilogx semilogy loglog polar streamplot hexbin pcolor tricontour errorbar clabel set_aspect violinplot set_axis_off spines text hatch plt axis plt.bar() plt.axis import figure pyplot highlight_text pypalettes plt.subplots() xlabel ylabel title legend colorbar savefig tight_layout grid set_xlim set_ylim plot scatter hist boxplot imshow cmap alpha bins tick_params annotate quiver contour barh stackplot subplots_adjust axhline axvline semilogx semilogy loglog polar streamplot hexbin pcolor tricontour errorbar clabel set_aspect violinplot set_axis_off spines text hatch plt axis plt.bar() plt.axis import figure pyplot highlight_text pypalettes plt.subplots() xlabel ylabel title legend colorbar savefig tight_layout grid set_xlim set_ylim plot scatter hist boxplot imshow cmap alpha bins tick_params annotate quiver contour barh stackplot subplots_adjust axhline axvline semilogx semilogy loglog polar streamplot hexbin pcolor tricontour errorbar clabel set_aspect violinplot set_axis_off spines text hatch plt axis plt.bar() plt.axis import figure pyplot highlight_text pypalettes plt.subplots() xlabel ylabel title legend colorbar savefig tight_layout grid set_xlim set_ylim plot scatter hist boxplot imshow cmap alpha bins tick_params annotate quiver contour barh stackplot subplots_adjust axhline axvline semilogx semilogy loglog polar streamplot hexbin pcolor tricontour errorbar clabel set_aspect violinplot set_axis_off spines text hatch plt axis plt.bar() plt.axis import figure pyplot highlight_text pypalettes plt.subplots() xlabel ylabel title legend colorbar savefig tight_layout grid set_xlim set_ylim plot scatter hist boxplot imshow cmap alpha bins tick_params annotate quiver contour barh stackplot subplots_adjust axhline axvline semilogx semilogy loglog polar streamplot hexbin pcolor tricontour errorbar clabel set_aspect violinplot set_axis_off spines text hatch plt axis plt.bar() plt.axis import figure pyplot highlight_text pypalettes plt.subplots() xlabel ylabel title legend colorbar savefig tight_layout grid set_xlim set_ylim plot scatter hist boxplot imshow cmap alpha bins tick_params annotate quiver contour barh stackplot subplots_adjust axhline axvline semilogx semilogy loglog polar streamplot hexbin pcolor tricontour errorbar clabel set_aspect violinplot set_axis_off spines text hatch plt axis plt.bar() plt.axis import figure pyplot highlight_text pypalettes plt.subplots() xlabel ylabel title legend colorbar savefig tight_layout grid set_xlim set_ylim plot scatter hist boxplot imshow cmap alpha bins tick_params annotate quiver contour barh stackplot subplots_adjust axhline axvline semilogx semilogy loglog polar streamplot hexbin pcolor tricontour errorbar clabel set_aspect violinplot set_axis_off spines text hatch plt axis plt.bar() plt.axis import figure pyplot highlight_text pypalettes plt.subplots() xlabel ylabel title legend colorbar savefig tight_layout grid set_xlim set_ylim plot scatter hist boxplot imshow cmap alpha bins tick_params annotate quiver contour barh stackplot subplots_adjust axhline axvline semilogx semilogy loglog polar streamplot hexbin pcolor tricontour errorbar clabel set_aspect violinplot set_axis_off spines text hatch plt axis plt.bar() plt.axis import figure pyplot highlight_text pypalettes plt.subplots() xlabel ylabel title legend colorbar savefig tight_layout grid set_xlim set_ylim plot scatter hist boxplot imshow cmap alpha bins tick_params annotate quiver contour barh stackplot subplots_adjust axhline axvline semilogx semilogy loglog polar streamplot hexbin pcolor tricontour errorbar clabel set_aspect violinplot set_axis_off spines text hatch plt axis plt.bar() plt.axis import figure pyplot highlight_text pypalettes plt.subplots() xlabel ylabel title legend colorbar savefig tight_layout grid set_xlim set_ylim plot scatter hist boxplot imshow cmap alpha bins tick_params annotate quiver contour barh stackplot subplots_adjust axhline axvline semilogx semilogy loglog polar streamplot hexbin pcolor tricontour errorbar clabel set_aspect violinplot set_axis_off spines text hatch plt axis plt.bar() plt.axis import figure pyplot highlight_text pypalettes plt.subplots() xlabel ylabel title legend colorbar savefig tight_layout grid set_xlim set_ylim plot scatter hist boxplot imshow cmap alpha bins tick_params annotate quiver contour barh stackplot subplots_adjust axhline axvline semilogx semilogy loglog polar streamplot hexbin pcolor tricontour errorbar clabel set_aspect violinplot set_axis_off spines text hatch plt axis plt.bar() plt.axis import figure pyplot highlight_text pypalettes plt.subplots() xlabel ylabel title legend colorbar savefig tight_layout grid set_xlim set_ylim plot scatter hist boxplot imshow cmap alpha bins tick_params annotate quiver contour barh stackplot subplots_adjust axhline axvline semilogx semilogy loglog polar streamplot hexbin pcolor tricontour errorbar clabel set_aspect violinplot set_axis_off spines text hatch plt axis plt.bar() plt.axis import figure pyplot highlight_text pypalettes plt.subplots() xlabel ylabel title legend colorbar savefig tight_layout grid set_xlim set_ylim plot scatter hist boxplot imshow cmap alpha bins tick_params annotate quiver contour barh stackplot subplots_adjust axhline axvline semilogx semilogy loglog polar streamplot hexbin pcolor tricontour errorbar clabel set_aspect violinplot set_axis_off spines text hatch plt axis plt.bar() plt.axis import figure pyplot highlight_text pypalettes plt.subplots() xlabel ylabel title legend colorbar savefig tight_layout grid set_xlim set_ylim plot scatter hist boxplot imshow cmap alpha bins tick_params annotate quiver contour barh stackplot subplots_adjust axhline axvline semilogx semilogy loglog polar streamplot hexbin pcolor tricontour errorbar clabel set_aspect violinplot set_axis_off spines text hatch plt axis plt.bar() plt.axis import figure pyplot highlight_text pypalettes plt.subplots() xlabel ylabel title legend colorbar savefig tight_layout grid set_xlim set_ylim plot scatter hist boxplot imshow cmap alpha bins tick_params annotate quiver contour barh stackplot subplots_adjust axhline axvline semilogx semilogy loglog polar streamplot hexbin pcolor tricontour errorbar clabel set_aspect violinplot set_axis_off spines text hatch plt axis plt.bar() plt.axis import figure pyplot highlight_text pypalettes plt.subplots() xlabel ylabel title legend colorbar savefig tight_layout grid set_xlim set_ylim plot scatter hist boxplot imshow cmap alpha bins tick_params annotate quiver contour barh stackplot subplots_adjust axhline axvline semilogx semilogy loglog polar streamplot hexbin pcolor tricontour errorbar clabel set_aspect violinplot set_axis_off spines text hatch plt axis plt.bar() plt.axis import figure pyplot highlight_text pypalettes plt.subplots() xlabel ylabel title legend colorbar savefig tight_layout grid set_xlim set_ylim plot scatter hist boxplot imshow cmap alpha bins tick_params annotate quiver contour barh stackplot subplots_adjust axhline axvline semilogx semilogy loglog polar streamplot hexbin pcolor tricontour errorbar clabel set_aspect violinplot set_axis_off spines text hatch plt axis plt.bar() plt.axis import figure pyplot highlight_text pypalettes plt.subplots() xlabel ylabel title legend colorbar savefig tight_layout grid set_xlim set_ylim plot scatter hist boxplot imshow cmap alpha bins tick_params annotate quiver contour barh stackplot subplots_adjust axhline axvline semilogx semilogy loglog polar streamplot hexbin pcolor tricontour errorbar clabel set_aspect violinplot set_axis_off spines text hatch plt axis plt.bar() plt.axis import figure pyplot highlight_text pypalettes plt.subplots() xlabel ylabel title legend colorbar savefig tight_layout grid set_xlim set_ylim plot scatter hist boxplot imshow cmap alpha bins tick_params annotate quiver contour barh stackplot subplots_adjust axhline axvline semilogx semilogy loglog polar streamplot hexbin pcolor tricontour errorbar clabel set_aspect violinplot set_axis_off spines text hatch plt axis plt.bar() plt.axis import figure pyplot highlight_text pypalettes plt.subplots() xlabel ylabel title legend colorbar savefig tight_layout grid set_xlim set_ylim plot scatter hist boxplot imshow cmap alpha bins tick_params annotate quiver contour barh stackplot subplots_adjust axhline axvline semilogx semilogy loglog polar streamplot hexbin pcolor tricontour errorbar clabel set_aspect violinplot set_axis_off spines text hatch plt axis plt.bar() plt.axis import figure pyplot highlight_text pypalettes plt.subplots() xlabel ylabel title legend colorbar savefig tight_layout grid set_xlim set_ylim plot scatter hist boxplot imshow cmap alpha bins tick_params annotate quiver contour barh stackplot subplots_adjust axhline axvline semilogx semilogy loglog polar streamplot hexbin pcolor tricontour errorbar clabel set_aspect violinplot set_axis_off spines text hatch plt axis plt.bar() plt.axis import figure pyplot highlight_text pypalettes plt.subplots() xlabel ylabel title legend colorbar savefig tight_layout grid set_xlim set_ylim plot scatter hist boxplot imshow cmap alpha bins tick_params annotate quiver contour barh stackplot subplots_adjust axhline axvline semilogx semilogy loglog polar streamplot hexbin pcolor tricontour errorbar clabel set_aspect violinplot set_axis_off spines text hatch plt axis plt.bar() plt.axis import figure pyplot highlight_text pypalettes plt.subplots() xlabel ylabel title legend colorbar savefig tight_layout grid set_xlim set_ylim plot scatter hist boxplot imshow cmap alpha bins tick_params annotate quiver contour barh stackplot subplots_adjust axhline axvline semilogx semilogy loglog polar streamplot hexbin pcolor tricontour errorbar clabel set_aspect violinplot set_axis_off spines text hatch plt axis plt.bar() plt.axis import figure pyplot highlight_text pypalettes plt.subplots() xlabel ylabel title legend colorbar savefig tight_layout grid set_xlim set_ylim plot scatter hist boxplot imshow cmap alpha bins tick_params annotate quiver contour barh stackplot subplots_adjust axhline axvline semilogx semilogy loglog polar streamplot hexbin pcolor tricontour errorbar clabel set_aspect violinplot set_axis_off spines text hatch plt axis plt.bar() plt.axis import figure pyplot highlight_text pypalettes plt.subplots() xlabel ylabel title legend colorbar savefig tight_layout grid set_xlim set_ylim plot scatter hist boxplot imshow cmap alpha bins tick_params annotate quiver contour barh stackplot subplots_adjust axhline axvline semilogx semilogy loglog polar streamplot hexbin pcolor tricontour errorbar clabel set_aspect violinplot set_axis_off spines text hatch plt axis plt.bar() plt.axis import figure pyplot highlight_text pypalettes plt.subplots() xlabel ylabel title legend colorbar savefig tight_layout grid set_xlim set_ylim plot scatter hist boxplot imshow cmap alpha bins tick_params annotate quiver contour barh stackplot subplots_adjust axhline axvline semilogx semilogy loglog polar streamplot hexbin pcolor tricontour errorbar clabel set_aspect violinplot set_axis_off spines text hatch plt axis plt.bar() plt.axis import figure pyplot highlight_text pypalettes plt.subplots() xlabel ylabel title legend colorbar savefig tight_layout grid set_xlim set_ylim plot scatter hist boxplot imshow cmap alpha bins tick_params annotate quiver contour barh stackplot subplots_adjust axhline axvline semilogx semilogy loglog polar streamplot hexbin pcolor tricontour errorbar clabel set_aspect violinplot set_axis_off spines text hatch plt axis plt.bar() plt.axis import figure pyplot highlight_text pypalettes plt.subplots() xlabel ylabel title legend colorbar savefig tight_layout grid set_xlim set_ylim plot scatter hist boxplot imshow cmap alpha bins tick_params annotate quiver contour barh stackplot subplots_adjust axhline axvline semilogx semilogy loglog polar streamplot hexbin pcolor tricontour errorbar clabel set_aspect violinplot set_axis_off spines text hatch plt axis plt.bar() plt.axis import figure pyplot highlight_text pypalettes plt.subplots() xlabel ylabel title legend colorbar savefig tight_layout grid set_xlim set_ylim plot scatter hist boxplot imshow cmap alpha bins tick_params annotate quiver contour barh stackplot subplots_adjust axhline axvline semilogx semilogy loglog polar streamplot hexbin pcolor tricontour errorbar clabel set_aspect violinplot set_axis_off spines text hatch plt axis plt.bar() plt.axis import figure pyplot highlight_text pypalettes plt.subplots() xlabel ylabel title legend colorbar savefig tight_layout grid set_xlim set_ylim plot scatter hist boxplot imshow cmap alpha bins tick_params annotate quiver contour barh stackplot subplots_adjust axhline axvline semilogx semilogy loglog polar streamplot hexbin pcolor tricontour errorbar clabel set_aspect violinplot set_axis_off spines text hatch plt axis plt.bar() plt.axis import figure pyplot highlight_text pypalettes plt.subplots() xlabel ylabel title legend colorbar savefig tight_layout grid set_xlim set_ylim plot scatter hist boxplot imshow cmap alpha bins tick_params annotate quiver contour barh stackplot subplots_adjust axhline axvline semilogx semilogy loglog polar streamplot hexbin pcolor tricontour errorbar clabel set_aspect violinplot set_axis_off spines text hatch plt axis plt.bar() plt.axis import figure pyplot highlight_text pypalettes plt.subplots() xlabel ylabel title legend colorbar savefig tight_layout grid set_xlim set_ylim plot scatter hist boxplot imshow cmap alpha bins tick_params annotate quiver contour barh stackplot subplots_adjust axhline axvline semilogx semilogy loglog polar streamplot hexbin pcolor tricontour errorbar clabel set_aspect violinplot set_axis_off spines text hatch plt axis plt.bar() plt.axis import figure pyplot highlight_text pypalettes plt.subplots() xlabel ylabel title legend colorbar savefig tight_layout grid set_xlim set_ylim plot scatter hist boxplot imshow cmap alpha bins tick_params annotate quiver contour barh stackplot subplots_adjust axhline axvline semilogx semilogy loglog polar streamplot hexbin pcolor tricontour errorbar clabel set_aspect violinplot set_axis_off spines text hatch plt axis plt.bar() plt.axis import figure pyplot highlight_text pypalettes plt.subplots() xlabel ylabel title legend colorbar savefig tight_layout grid set_xlim set_ylim plot scatter hist boxplot imshow cmap alpha bins tick_params annotate quiver contour barh stackplot subplots_adjust axhline axvline semilogx semilogy loglog polar streamplot hexbin pcolor tricontour errorbar clabel set_aspect violinplot set_axis_off spines text hatch plt axis plt.bar() plt.axis import figure pyplot highlight_text pypalettes plt.subplots() xlabel ylabel title legend colorbar savefig tight_layout grid set_xlim set_ylim plot scatter hist boxplot imshow cmap alpha bins tick_params annotate quiver contour barh stackplot subplots_adjust axhline axvline semilogx semilogy loglog polar streamplot hexbin pcolor tricontour errorbar clabel set_aspect violinplot set_axis_off spines text hatch plt axis plt.bar() plt.axis import figure pyplot highlight_text pypalettes plt.subplots() xlabel ylabel title legend colorbar savefig tight_layout grid set_xlim set_ylim plot scatter hist boxplot imshow cmap alpha bins tick_params annotate quiver contour barh stackplot subplots_adjust axhline axvline semilogx semilogy loglog polar streamplot hexbin pcolor tricontour errorbar clabel set_aspect violinplot set_axis_off spines text hatch plt axis plt.bar() plt.axis import figure pyplot highlight_text pypalettes plt.subplots() xlabel ylabel title legend colorbar savefig tight_layout grid set_xlim set_ylim plot scatter hist boxplot imshow cmap alpha bins tick_params annotate quiver contour barh stackplot subplots_adjust axhline axvline semilogx semilogy loglog polar streamplot hexbin pcolor tricontour errorbar clabel set_aspect violinplot set_axis_off spines text hatch plt axis plt.bar() plt.axis import figure pyplot highlight_text pypalettes plt.subplots() xlabel ylabel title legend colorbar savefig tight_layout grid set_xlim set_ylim plot scatter hist boxplot imshow cmap alpha bins tick_params annotate quiver contour barh stackplot subplots_adjust axhline axvline semilogx semilogy loglog polar streamplot hexbin pcolor tricontour errorbar clabel set_aspect violinplot set_axis_off spines text hatch plt axis plt.bar() plt.axis import figure pyplot highlight_text pypalettes plt.subplots() xlabel ylabel title legend colorbar savefig tight_layout grid set_xlim set_ylim plot scatter hist boxplot imshow cmap alpha bins tick_params annotate quiver contour barh stackplot subplots_adjust axhline axvline semilogx semilogy loglog polar streamplot hexbin pcolor tricontour errorbar clabel set_aspect violinplot set_axis_off spines text hatch plt axis plt.bar() plt.axis import figure pyplot highlight_text pypalettes plt.subplots() xlabel ylabel title legend colorbar savefig tight_layout grid set_xlim set_ylim plot scatter hist boxplot imshow cmap alpha bins tick_params annotate quiver contour barh stackplot subplots_adjust axhline axvline semilogx semilogy loglog polar streamplot hexbin pcolor tricontour errorbar clabel set_aspect violinplot set_axis_off spines text hatch plt axis plt.bar() plt.axis import figure pyplot highlight_text pypalettes plt.subplots() xlabel ylabel title legend colorbar savefig tight_layout grid set_xlim set_ylim plot scatter hist boxplot imshow cmap alpha bins tick_params annotate quiver contour barh stackplot subplots_adjust axhline axvline semilogx semilogy loglog polar streamplot hexbin pcolor tricontour errorbar clabel set_aspect violinplot set_axis_off spines text hatch plt axis plt.bar() plt.axis import figure pyplot highlight_text pypalettes plt.subplots() xlabel ylabel title legend colorbar savefig tight_layout grid set_xlim set_ylim plot scatter hist boxplot imshow cmap alpha bins tick_params annotate quiver contour barh stackplot subplots_adjust axhline axvline semilogx semilogy loglog polar streamplot hexbin pcolor tricontour errorbar clabel set_aspect violinplot set_axis_off spines text hatch plt axis plt.bar() plt.axis import figure pyplot highlight_text pypalettes plt.subplots() xlabel ylabel title legend colorbar savefig tight_layout grid set_xlim set_ylim plot scatter hist boxplot imshow cmap alpha bins tick_params annotate quiver contour barh stackplot subplots_adjust axhline axvline semilogx semilogy loglog polar streamplot hexbin pcolor tricontour errorbar clabel set_aspect violinplot set_axis_off spines text hatch plt axis plt.bar() plt.axis import figure pyplot highlight_text pypalettes plt.subplots() xlabel ylabel title legend colorbar savefig tight_layout grid set_xlim set_ylim plot scatter hist boxplot imshow cmap alpha bins tick_params annotate quiver contour barh stackplot subplots_adjust axhline axvline semilogx semilogy loglog polar streamplot hexbin pcolor tricontour errorbar clabel set_aspect violinplot set_axis_off spines text hatch plt axis plt.bar() plt.axis import figure pyplot highlight_text pypalettes plt.subplots() xlabel ylabel title legend colorbar savefig tight_layout grid set_xlim set_ylim plot scatter hist boxplot imshow cmap alpha bins tick_params annotate quiver contour barh stackplot subplots_adjust axhline axvline semilogx semilogy loglog polar streamplot hexbin pcolor tricontour errorbar clabel set_aspect violinplot set_axis_off spines text hatch plt axis plt.bar() plt.axis import figure pyplot highlight_text pypalettes plt.subplots() xlabel ylabel title legend colorbar savefig tight_layout grid set_xlim set_ylim plot scatter hist boxplot imshow cmap alpha bins tick_params annotate quiver contour barh stackplot subplots_adjust axhline axvline semilogx semilogy loglog polar streamplot hexbin pcolor tricontour errorbar clabel set_aspect violinplot set_axis_off spines text hatch plt axis plt.bar() plt.axis import figure pyplot highlight_text pypalettes plt.subplots() xlabel ylabel title legend colorbar savefig tight_layout grid set_xlim set_ylim plot scatter hist boxplot imshow cmap alpha bins tick_params annotate quiver contour barh stackplot subplots_adjust axhline axvline semilogx semilogy loglog polar streamplot hexbin pcolor tricontour errorbar clabel set_aspect violinplot set_axis_off spines text hatch plt axis plt.bar() plt.axis import figure pyplot highlight_text pypalettes plt.subplots() xlabel ylabel title legend colorbar savefig tight_layout grid set_xlim set_ylim plot scatter hist boxplot imshow cmap alpha bins tick_params annotate quiver contour barh stackplot subplots_adjust axhline axvline semilogx semilogy loglog polar streamplot hexbin pcolor tricontour errorbar clabel set_aspect violinplot set_axis_off spines text hatch plt axis plt.bar() plt.axis import figure pyplot highlight_text pypalettes plt.subplots() xlabel ylabel title legend colorbar savefig tight_layout grid set_xlim set_ylim plot scatter hist boxplot imshow cmap alpha bins tick_params annotate quiver contour barh stackplot subplots_adjust axhline axvline semilogx semilogy loglog polar streamplot hexbin pcolor tricontour errorbar clabel set_aspect violinplot set_axis_off spines text hatch plt axis plt.bar() plt.axis import figure pyplot highlight_text pypalettes plt.subplots() xlabel ylabel title legend colorbar savefig tight_layout grid set_xlim set_ylim plot scatter hist boxplot imshow cmap alpha bins tick_params annotate quiver contour barh stackplot subplots_adjust axhline axvline semilogx semilogy loglog polar streamplot hexbin pcolor tricontour errorbar clabel set_aspect violinplot set_axis_off spines text hatch plt axis plt.bar() plt.axis import figure pyplot highlight_text pypalettes plt.subplots() xlabel ylabel title legend colorbar savefig tight_layout grid set_xlim set_ylim plot scatter hist boxplot imshow cmap alpha bins tick_params annotate quiver contour barh stackplot subplots_adjust axhline axvline semilogx semilogy loglog polar streamplot hexbin pcolor tricontour errorbar clabel set_aspect violinplot set_axis_off spines text hatch plt axis plt.bar() plt.axis import figure pyplot highlight_text pypalettes plt.subplots() xlabel ylabel title legend colorbar savefig tight_layout grid set_xlim set_ylim plot scatter hist boxplot imshow cmap alpha bins tick_params annotate quiver contour barh stackplot subplots_adjust axhline axvline semilogx semilogy loglog polar streamplot hexbin pcolor tricontour errorbar clabel set_aspect violinplot set_axis_off spines text hatch plt axis plt.bar() plt.axis import figure pyplot highlight_text pypalettes plt.subplots() xlabel ylabel title legend colorbar savefig tight_layout grid set_xlim set_ylim plot scatter hist boxplot imshow cmap alpha bins tick_params annotate quiver contour barh stackplot subplots_adjust axhline axvline semilogx semilogy loglog polar streamplot hexbin pcolor tricontour errorbar clabel set_aspect violinplot set_axis_off spines text hatch plt axis plt.bar() plt.axis import figure pyplot highlight_text pypalettes plt.subplots() xlabel ylabel title legend colorbar savefig tight_layout grid set_xlim set_ylim plot scatter hist boxplot imshow cmap alpha bins tick_params annotate quiver contour barh stackplot subplots_adjust axhline axvline semilogx semilogy loglog polar streamplot hexbin pcolor tricontour errorbar clabel set_aspect violinplot set_axis_off spines text hatch plt axis plt.bar() plt.axis import figure pyplot highlight_text pypalettes plt.subplots() xlabel ylabel title legend colorbar savefig tight_layout grid set_xlim set_ylim plot scatter hist boxplot imshow cmap alpha bins tick_params annotate quiver contour barh stackplot subplots_adjust axhline axvline semilogx semilogy loglog polar streamplot hexbin pcolor tricontour errorbar clabel set_aspect violinplot set_axis_off spines text hatch plt axis plt.bar() plt.axis import figure pyplot highlight_text pypalettes plt.subplots() xlabel ylabel title legend colorbar savefig tight_layout grid set_xlim set_ylim plot scatter hist boxplot imshow cmap alpha bins tick_params annotate quiver contour barh stackplot subplots_adjust axhline axvline semilogx semilogy loglog polar streamplot hexbin pcolor tricontour errorbar clabel set_aspect violinplot set_axis_off spines text hatch plt axis plt.bar() plt.axis import figure pyplot highlight_text pypalettes plt.subplots() xlabel ylabel title legend colorbar savefig tight_layout grid set_xlim set_ylim plot scatter hist boxplot imshow cmap alpha bins tick_params annotate quiver contour barh stackplot subplots_adjust axhline axvline semilogx semilogy loglog polar streamplot hexbin pcolor tricontour errorbar clabel set_aspect violinplot set_axis_off spines text hatch plt axis plt.bar() plt.axis import figure pyplot highlight_text pypalettes plt.subplots() xlabel ylabel title legend colorbar savefig tight_layout grid set_xlim set_ylim plot scatter hist boxplot imshow cmap alpha bins tick_params annotate quiver contour barh stackplot subplots_adjust axhline axvline semilogx semilogy loglog polar streamplot hexbin pcolor tricontour errorbar clabel set_aspect violinplot set_axis_off spines text hatch plt axis plt.bar() plt.axis import figure pyplot highlight_text pypalettes plt.subplots() xlabel ylabel title legend colorbar savefig tight_layout grid set_xlim set_ylim plot scatter hist boxplot imshow cmap alpha bins tick_params annotate quiver contour barh stackplot subplots_adjust axhline axvline semilogx semilogy loglog polar streamplot hexbin pcolor tricontour errorbar clabel set_aspect violinplot set_axis_off spines text hatch plt axis plt.bar() plt.axis import figure pyplot highlight_text pypalettes plt.subplots() xlabel ylabel title legend colorbar savefig tight_layout grid set_xlim set_ylim plot scatter hist boxplot imshow cmap alpha bins tick_params annotate quiver contour barh stackplot subplots_adjust axhline axvline semilogx semilogy loglog polar streamplot hexbin pcolor tricontour errorbar clabel set_aspect violinplot set_axis_off spines text hatch plt axis plt.bar() plt.axis import figure pyplot highlight_text pypalettes plt.subplots() xlabel ylabel title legend colorbar savefig tight_layout grid set_xlim set_ylim plot scatter hist boxplot imshow cmap alpha bins tick_params annotate quiver contour barh stackplot subplots_adjust axhline axvline semilogx semilogy loglog polar streamplot hexbin pcolor tricontour errorbar clabel set_aspect violinplot set_axis_off spines text hatch plt axis plt.bar() plt.axis import figure pyplot highlight_text pypalettes plt.subplots() xlabel ylabel title legend colorbar savefig tight_layout grid set_xlim set_ylim plot scatter hist boxplot imshow cmap alpha bins tick_params annotate quiver contour barh stackplot subplots_adjust axhline axvline semilogx semilogy loglog polar streamplot hexbin pcolor tricontour errorbar clabel set_aspect violinplot set_axis_off spines text hatch plt axis plt.bar() plt.axis import figure pyplot highlight_text pypalettes plt.subplots() xlabel ylabel title legend colorbar savefig tight_layout grid set_xlim set_ylim plot scatter hist boxplot imshow cmap alpha bins tick_params annotate quiver contour barh stackplot subplots_adjust axhline axvline semilogx semilogy loglog polar streamplot hexbin pcolor tricontour errorbar clabel set_aspect violinplot set_axis_off spines text hatch plt axis plt.bar() plt.axis import figure pyplot highlight_text pypalettes plt.subplots() xlabel ylabel title legend colorbar savefig tight_layout grid set_xlim set_ylim plot scatter hist boxplot imshow cmap alpha bins tick_params annotate quiver contour barh stackplot subplots_adjust axhline axvline semilogx semilogy loglog polar streamplot hexbin pcolor tricontour errorbar clabel set_aspect violinplot set_axis_off spines text hatch plt axis plt.bar() plt.axis import figure pyplot highlight_text pypalettes plt.subplots() xlabel ylabel title legend colorbar savefig tight_layout grid set_xlim set_ylim plot scatter hist boxplot imshow cmap alpha bins tick_params annotate quiver contour barh stackplot subplots_adjust axhline axvline semilogx semilogy loglog polar streamplot hexbin pcolor tricontour errorbar clabel set_aspect violinplot set_axis_off spines text hatch plt axis plt.bar() plt.axis import figure pyplot highlight_text pypalettes plt.subplots() xlabel ylabel title legend colorbar savefig tight_layout grid set_xlim set_ylim plot scatter hist boxplot imshow cmap alpha bins tick_params annotate quiver contour barh stackplot subplots_adjust axhline axvline semilogx semilogy loglog polar streamplot hexbin pcolor tricontour errorbar clabel set_aspect violinplot set_axis_off spines text hatch plt axis plt.bar() plt.axis import figure pyplot highlight_text pypalettes plt.subplots() xlabel ylabel title legend colorbar savefig tight_layout grid set_xlim set_ylim plot scatter hist boxplot imshow cmap alpha bins tick_params annotate quiver contour barh stackplot subplots_adjust axhline axvline semilogx semilogy loglog polar streamplot hexbin pcolor tricontour errorbar clabel set_aspect violinplot set_axis_off spines text hatch plt axis plt.bar() plt.axis import figure pyplot highlight_text pypalettes plt.subplots() xlabel ylabel title legend colorbar savefig tight_layout grid set_xlim set_ylim plot scatter hist boxplot imshow cmap alpha bins tick_params annotate quiver contour barh stackplot subplots_adjust axhline axvline semilogx semilogy loglog polar streamplot hexbin pcolor tricontour errorbar clabel set_aspect violinplot set_axis_off spines text hatch plt axis plt.bar() plt.axis import figure pyplot highlight_text pypalettes plt.subplots() xlabel ylabel title legend colorbar savefig tight_layout grid set_xlim set_ylim plot scatter hist boxplot imshow cmap alpha bins tick_params annotate quiver contour barh stackplot subplots_adjust axhline axvline semilogx semilogy loglog polar streamplot hexbin pcolor tricontour errorbar clabel set_aspect violinplot set_axis_off spines text hatch plt axis plt.bar() plt.axis import figure pyplot highlight_text pypalettes plt.subplots() xlabel ylabel title legend colorbar savefig tight_layout grid set_xlim set_ylim plot scatter hist boxplot imshow cmap alpha bins tick_params annotate quiver contour barh stackplot subplots_adjust axhline axvline semilogx semilogy loglog polar streamplot hexbin pcolor tricontour errorbar clabel set_aspect violinplot set_axis_off spines text hatch plt axis plt.bar() plt.axis import figure pyplot highlight_text pypalettes plt.subplots() xlabel ylabel title legend colorbar savefig tight_layout grid set_xlim set_ylim plot scatter hist boxplot imshow cmap alpha bins tick_params annotate quiver contour barh stackplot subplots_adjust axhline axvline semilogx semilogy loglog polar streamplot hexbin pcolor tricontour errorbar clabel set_aspect violinplot set_axis_off spines text hatch plt axis plt.bar() plt.axis import figure pyplot highlight_text pypalettes plt.subplots() xlabel ylabel title legend colorbar savefig tight_layout grid set_xlim set_ylim plot scatter hist boxplot imshow cmap alpha bins tick_params annotate quiver contour barh stackplot subplots_adjust axhline axvline semilogx semilogy loglog polar streamplot hexbin pcolor tricontour errorbar clabel set_aspect violinplot set_axis_off spines text hatch plt axis plt.bar() plt.axis import figure pyplot highlight_text pypalettes plt.subplots() xlabel ylabel title legend colorbar savefig tight_layout grid set_xlim set_ylim plot scatter hist boxplot imshow cmap alpha bins tick_params annotate quiver contour barh stackplot subplots_adjust axhline axvline semilogx semilogy loglog polar streamplot hexbin pcolor tricontour errorbar clabel set_aspect violinplot set_axis_off spines text hatch plt axis plt.bar() plt.axis import figure pyplot highlight_text pypalettes plt.subplots() xlabel ylabel title legend colorbar savefig tight_layout grid set_xlim set_ylim plot scatter hist boxplot imshow cmap alpha bins tick_params annotate quiver contour barh stackplot subplots_adjust axhline axvline semilogx semilogy loglog polar streamplot hexbin pcolor tricontour errorbar clabel set_aspect violinplot set_axis_off spines text hatch plt axis plt.bar() plt.axis import figure pyplot highlight_text pypalettes plt.subplots() xlabel ylabel title legend colorbar savefig tight_layout grid set_xlim set_ylim plot scatter hist boxplot imshow cmap alpha bins tick_params annotate quiver contour barh stackplot subplots_adjust axhline axvline semilogx semilogy loglog polar streamplot hexbin pcolor tricontour errorbar clabel set_aspect violinplot set_axis_off spines text hatch plt axis plt.bar() plt.axis import figure pyplot highlight_text pypalettes plt.subplots() xlabel ylabel title legend colorbar savefig tight_layout grid set_xlim set_ylim plot scatter hist boxplot imshow cmap alpha bins tick_params annotate quiver contour barh stackplot subplots_adjust axhline axvline semilogx semilogy loglog polar streamplot hexbin pcolor tricontour errorbar clabel set_aspect violinplot set_axis_off spines text hatch plt axis plt.bar() plt.axis import figure pyplot highlight_text pypalettes plt.subplots() xlabel ylabel title legend colorbar savefig tight_layout grid set_xlim set_ylim plot scatter hist boxplot imshow cmap alpha bins tick_params annotate quiver contour barh stackplot subplots_adjust axhline axvline semilogx semilogy loglog polar streamplot hexbin pcolor tricontour errorbar clabel set_aspect violinplot set_axis_off spines text hatch plt axis plt.bar() plt.axis import figure pyplot highlight_text pypalettes plt.subplots() xlabel ylabel title legend colorbar savefig tight_layout grid set_xlim set_ylim plot scatter hist boxplot imshow cmap alpha bins tick_params annotate quiver contour barh stackplot subplots_adjust axhline axvline semilogx semilogy loglog polar streamplot hexbin pcolor tricontour errorbar clabel set_aspect violinplot set_axis_off spines text hatch plt axis plt.bar() plt.axis import figure pyplot highlight_text pypalettes plt.subplots() xlabel ylabel title legend colorbar savefig tight_layout grid set_xlim set_ylim plot scatter hist boxplot imshow cmap alpha bins tick_params annotate quiver contour barh stackplot subplots_adjust axhline axvline semilogx semilogy loglog polar streamplot hexbin pcolor tricontour errorbar clabel set_aspect violinplot set_axis_off spines text hatch plt axis plt.bar() plt.axis import figure pyplot highlight_text pypalettes plt.subplots() xlabel ylabel title legend colorbar savefig tight_layout grid set_xlim set_ylim plot scatter hist boxplot imshow cmap alpha bins tick_params annotate quiver contour barh stackplot subplots_adjust axhline axvline semilogx semilogy loglog polar streamplot hexbin pcolor tricontour errorbar clabel set_aspect violinplot set_axis_off spines text hatch plt axis plt.bar() plt.axis import figure pyplot highlight_text pypalettes plt.subplots() xlabel ylabel title legend colorbar savefig tight_layout grid set_xlim set_ylim plot scatter hist boxplot imshow cmap alpha bins tick_params annotate quiver contour barh stackplot subplots_adjust axhline axvline semilogx semilogy loglog polar streamplot hexbin pcolor tricontour errorbar clabel set_aspect violinplot set_axis_off spines text hatch plt axis plt.bar() plt.axis import figure pyplot highlight_text pypalettes plt.subplots() xlabel ylabel title legend colorbar savefig tight_layout grid set_xlim set_ylim plot scatter hist boxplot imshow cmap alpha bins tick_params annotate quiver contour barh stackplot subplots_adjust axhline axvline semilogx semilogy loglog polar streamplot hexbin pcolor tricontour errorbar clabel set_aspect violinplot set_axis_off spines text hatch plt axis plt.bar() plt.axis import figure pyplot highlight_text pypalettes plt.subplots() xlabel ylabel title legend colorbar savefig tight_layout grid set_xlim set_ylim plot scatter hist boxplot imshow cmap alpha bins tick_params annotate quiver contour barh stackplot subplots_adjust axhline axvline semilogx semilogy loglog polar streamplot hexbin pcolor tricontour errorbar clabel set_aspect violinplot set_axis_off spines text hatch plt axis plt.bar() plt.axis import figure pyplot highlight_text pypalettes plt.subplots() xlabel ylabel title legend colorbar savefig tight_layout grid set_xlim set_ylim plot scatter hist boxplot imshow cmap alpha bins tick_params annotate quiver contour barh stackplot subplots_adjust axhline axvline semilogx semilogy loglog polar streamplot hexbin pcolor tricontour errorbar clabel set_aspect violinplot set_axis_off spines text hatch plt axis plt.bar() plt.axis import figure pyplot highlight_text pypalettes plt.subplots() xlabel ylabel title legend colorbar savefig tight_layout grid set_xlim set_ylim plot scatter hist boxplot imshow cmap alpha bins tick_params annotate quiver contour barh stackplot subplots_adjust axhline axvline semilogx semilogy loglog polar streamplot hexbin pcolor tricontour errorbar clabel set_aspect violinplot set_axis_off spines text hatch plt axis plt.bar() plt.axis import figure pyplot highlight_text pypalettes plt.subplots() xlabel ylabel title legend colorbar savefig tight_layout grid set_xlim set_ylim plot scatter hist boxplot imshow cmap alpha bins tick_params annotate quiver contour barh stackplot subplots_adjust axhline axvline semilogx semilogy loglog polar streamplot hexbin pcolor tricontour errorbar clabel set_aspect violinplot set_axis_off spines text hatch plt axis plt.bar() plt.axis import figure pyplot highlight_text pypalettes plt.subplots() xlabel ylabel title legend colorbar savefig tight_layout grid set_xlim set_ylim plot scatter hist boxplot imshow cmap alpha bins tick_params annotate quiver contour barh stackplot subplots_adjust axhline axvline semilogx semilogy loglog polar streamplot hexbin pcolor tricontour errorbar clabel set_aspect violinplot set_axis_off spines text hatch plt axis plt.bar() plt.axis import figure pyplot highlight_text pypalettes plt.subplots() xlabel ylabel title legend colorbar savefig tight_layout grid set_xlim set_ylim plot scatter hist boxplot imshow cmap alpha bins tick_params annotate quiver contour barh stackplot subplots_adjust axhline axvline semilogx semilogy loglog polar streamplot hexbin pcolor tricontour errorbar clabel set_aspect violinplot set_axis_off spines text hatch plt axis plt.bar() plt.axis import figure pyplot highlight_text pypalettes plt.subplots() xlabel ylabel title legend colorbar savefig tight_layout grid set_xlim set_ylim plot scatter hist boxplot imshow cmap alpha bins tick_params annotate quiver contour barh stackplot subplots_adjust axhline axvline semilogx semilogy loglog polar streamplot hexbin pcolor tricontour errorbar clabel set_aspect violinplot set_axis_off spines text hatch plt axis plt.bar() plt.axis import figure pyplot highlight_text pypalettes plt.subplots() xlabel ylabel title legend colorbar savefig tight_layout grid set_xlim set_ylim plot scatter hist boxplot imshow cmap alpha bins tick_params annotate quiver contour barh stackplot subplots_adjust axhline axvline semilogx semilogy loglog polar streamplot hexbin pcolor tricontour errorbar clabel set_aspect violinplot set_axis_off spines text hatch plt axis plt.bar() plt.axis import figure pyplot highlight_text pypalettes plt.subplots() xlabel ylabel title legend colorbar savefig tight_layout grid set_xlim set_ylim plot scatter hist boxplot imshow cmap alpha bins tick_params annotate quiver contour barh stackplot subplots_adjust axhline axvline semilogx semilogy loglog polar streamplot hexbin pcolor tricontour errorbar clabel set_aspect violinplot set_axis_off spines text hatch plt axis plt.bar() plt.axis import figure pyplot highlight_text pypalettes plt.subplots() xlabel ylabel title legend colorbar savefig tight_layout grid set_xlim set_ylim plot scatter hist boxplot imshow cmap alpha bins tick_params annotate quiver contour barh stackplot subplots_adjust axhline axvline semilogx semilogy loglog polar streamplot hexbin pcolor tricontour errorbar clabel set_aspect violinplot set_axis_off spines text hatch plt axis plt.bar() plt.axis import figure pyplot highlight_text pypalettes plt.subplots() xlabel ylabel title legend colorbar savefig tight_layout grid set_xlim set_ylim plot scatter hist boxplot imshow cmap alpha bins tick_params annotate quiver contour barh stackplot subplots_adjust axhline axvline semilogx semilogy loglog polar streamplot hexbin pcolor tricontour errorbar clabel set_aspect violinplot set_axis_off spines text hatch plt axis plt.bar() plt.axis import figure pyplot highlight_text pypalettes plt.subplots() xlabel ylabel title legend colorbar savefig tight_layout grid set_xlim set_ylim plot scatter hist boxplot imshow cmap alpha bins tick_params annotate quiver contour barh stackplot subplots_adjust axhline axvline semilogx semilogy loglog polar streamplot hexbin pcolor tricontour errorbar clabel set_aspect violinplot set_axis_off spines text hatch plt axis plt.bar() plt.axis import figure pyplot highlight_text pypalettes plt.subplots() xlabel ylabel title legend colorbar savefig tight_layout grid set_xlim set_ylim plot scatter hist boxplot imshow cmap alpha bins tick_params annotate quiver contour barh stackplot subplots_adjust axhline axvline semilogx semilogy loglog polar streamplot hexbin pcolor tricontour errorbar clabel set_aspect violinplot set_axis_off spines text hatch plt axis plt.bar() plt.axis import figure pyplot highlight_text pypalettes plt.subplots() xlabel ylabel title legend colorbar savefig tight_layout grid set_xlim set_ylim plot scatter hist boxplot imshow cmap alpha bins tick_params annotate quiver contour barh stackplot subplots_adjust axhline axvline semilogx semilogy loglog polar streamplot hexbin pcolor tricontour errorbar clabel set_aspect violinplot set_axis_off spines text hatch plt axis plt.bar() plt.axis import figure pyplot highlight_text pypalettes plt.subplots() xlabel ylabel title legend colorbar savefig tight_layout grid set_xlim set_ylim plot scatter hist boxplot imshow cmap alpha bins tick_params annotate quiver contour barh stackplot subplots_adjust axhline axvline semilogx semilogy loglog polar streamplot hexbin pcolor tricontour errorbar clabel set_aspect violinplot set_axis_off spines text hatch plt axis plt.bar() plt.axis import figure pyplot highlight_text pypalettes plt.subplots() xlabel ylabel title legend colorbar savefig tight_layout grid set_xlim set_ylim plot scatter hist boxplot imshow cmap alpha bins tick_params annotate quiver contour barh stackplot subplots_adjust axhline axvline semilogx semilogy loglog polar streamplot hexbin pcolor tricontour errorbar clabel set_aspect violinplot set_axis_off spines text hatch plt axis plt.bar() plt.axis import figure pyplot highlight_text pypalettes plt.subplots() xlabel ylabel title legend colorbar savefig tight_layout grid set_xlim set_ylim plot scatter hist boxplot imshow cmap alpha bins tick_params annotate quiver contour barh stackplot subplots_adjust axhline axvline semilogx semilogy loglog polar streamplot hexbin pcolor tricontour errorbar clabel set_aspect violinplot set_axis_off spines text hatch plt axis plt.bar() plt.axis import figure pyplot highlight_text pypalettes plt.subplots() xlabel ylabel title legend colorbar savefig tight_layout grid set_xlim set_ylim plot scatter hist boxplot imshow cmap alpha bins tick_params annotate quiver contour barh stackplot subplots_adjust axhline axvline semilogx semilogy loglog polar streamplot hexbin pcolor tricontour errorbar clabel set_aspect violinplot set_axis_off spines text hatch plt axis plt.bar() plt.axis import figure pyplot highlight_text pypalettes plt.subplots() xlabel ylabel title legend colorbar savefig tight_layout grid set_xlim set_ylim plot scatter hist boxplot imshow cmap alpha bins tick_params annotate quiver contour barh stackplot subplots_adjust axhline axvline semilogx semilogy loglog polar streamplot hexbin pcolor tricontour errorbar clabel set_aspect violinplot set_axis_off spines text hatch plt axis plt.bar() plt.axis import figure pyplot highlight_text pypalettes plt.subplots() xlabel ylabel title legend colorbar savefig tight_layout grid set_xlim set_ylim plot scatter hist boxplot imshow cmap alpha bins tick_params annotate quiver contour barh stackplot subplots_adjust axhline axvline semilogx semilogy loglog polar streamplot hexbin pcolor tricontour errorbar clabel set_aspect violinplot set_axis_off spines text hatch plt axis plt.bar() plt.axis import figure pyplot highlight_text pypalettes plt.subplots() xlabel ylabel title legend colorbar savefig tight_layout grid set_xlim set_ylim plot scatter hist boxplot imshow cmap alpha bins tick_params annotate quiver contour barh stackplot subplots_adjust axhline axvline semilogx semilogy loglog polar streamplot hexbin pcolor tricontour errorbar clabel set_aspect violinplot set_axis_off spines text hatch plt axis plt.bar() plt.axis import figure pyplot highlight_text pypalettes plt.subplots() xlabel ylabel title legend colorbar savefig tight_layout grid set_xlim set_ylim plot scatter hist boxplot imshow cmap alpha bins tick_params annotate quiver contour barh stackplot subplots_adjust axhline axvline semilogx semilogy loglog polar streamplot hexbin pcolor tricontour errorbar clabel set_aspect violinplot set_axis_off spines text hatch plt axis plt.bar() plt.axis import figure pyplot highlight_text pypalettes plt.subplots() xlabel ylabel title legend colorbar savefig tight_layout grid set_xlim set_ylim plot scatter hist boxplot imshow cmap alpha bins tick_params annotate quiver contour barh stackplot subplots_adjust axhline axvline semilogx semilogy loglog polar streamplot hexbin pcolor tricontour errorbar clabel set_aspect violinplot set_axis_off spines text hatch plt axis plt.bar() plt.axis import figure pyplot highlight_text pypalettes plt.subplots() xlabel ylabel title legend colorbar savefig tight_layout grid set_xlim set_ylim plot scatter hist boxplot imshow cmap alpha bins tick_params annotate quiver contour barh stackplot subplots_adjust axhline axvline semilogx semilogy loglog polar streamplot hexbin pcolor tricontour errorbar clabel set_aspect violinplot set_axis_off spines text hatch plt axis plt.bar() plt.axis import figure pyplot highlight_text pypalettes plt.subplots() xlabel ylabel title legend colorbar savefig tight_layout grid set_xlim set_ylim plot scatter hist boxplot imshow cmap alpha bins tick_params annotate quiver contour barh stackplot subplots_adjust axhline axvline semilogx semilogy loglog polar streamplot hexbin pcolor tricontour errorbar clabel set_aspect violinplot set_axis_off spines text hatch plt axis plt.bar() plt.axis import figure pyplot highlight_text pypalettes plt.subplots() xlabel ylabel title legend colorbar savefig tight_layout grid set_xlim set_ylim plot scatter hist boxplot imshow cmap alpha bins tick_params annotate quiver contour barh stackplot subplots_adjust axhline axvline semilogx semilogy loglog polar streamplot hexbin pcolor tricontour errorbar clabel set_aspect violinplot set_axis_off spines text hatch plt axis plt.bar() plt.axis import figure pyplot highlight_text pypalettes plt.subplots() xlabel ylabel title legend colorbar savefig tight_layout grid set_xlim set_ylim plot scatter hist boxplot imshow cmap alpha bins tick_params annotate quiver contour barh stackplot subplots_adjust axhline axvline semilogx semilogy loglog polar streamplot hexbin pcolor tricontour errorbar clabel set_aspect violinplot set_axis_off spines text hatch plt axis plt.bar() plt.axis import figure pyplot highlight_text pypalettes plt.subplots() xlabel ylabel title legend colorbar savefig tight_layout grid set_xlim set_ylim plot scatter hist boxplot imshow cmap alpha bins tick_params annotate quiver contour barh stackplot subplots_adjust axhline axvline semilogx semilogy loglog polar streamplot hexbin pcolor tricontour errorbar clabel set_aspect violinplot set_axis_off spines text hatch plt axis plt.bar() plt.axis import figure pyplot highlight_text pypalettes plt.subplots() xlabel ylabel title legend colorbar savefig tight_layout grid set_xlim set_ylim plot scatter hist boxplot imshow cmap alpha bins tick_params annotate quiver contour barh stackplot subplots_adjust axhline axvline semilogx semilogy loglog polar streamplot hexbin pcolor tricontour errorbar clabel set_aspect violinplot set_axis_off spines text hatch plt axis plt.bar() plt.axis import figure pyplot highlight_text pypalettes plt.subplots() xlabel ylabel title legend colorbar savefig tight_layout grid set_xlim set_ylim plot scatter hist boxplot imshow cmap alpha bins tick_params annotate quiver contour barh stackplot subplots_adjust axhline axvline semilogx semilogy loglog polar streamplot hexbin pcolor tricontour errorbar clabel set_aspect violinplot set_axis_off spines text hatch plt axis plt.bar() plt.axis import figure pyplot highlight_text pypalettes plt.subplots() xlabel ylabel title legend colorbar savefig tight_layout grid set_xlim set_ylim plot scatter hist boxplot imshow cmap alpha bins tick_params annotate quiver contour barh stackplot subplots_adjust axhline axvline semilogx semilogy loglog polar streamplot hexbin pcolor tricontour errorbar clabel set_aspect violinplot set_axis_off spines text hatch plt axis plt.bar() plt.axis import figure pyplot highlight_text pypalettes plt.subplots() xlabel ylabel title legend colorbar savefig tight_layout grid set_xlim set_ylim plot scatter hist boxplot imshow cmap alpha bins tick_params annotate quiver contour barh stackplot subplots_adjust axhline axvline semilogx semilogy loglog polar streamplot hexbin pcolor tricontour errorbar clabel set_aspect violinplot set_axis_off spines text hatch plt axis plt.bar() plt.axis import figure pyplot highlight_text pypalettes plt.subplots() xlabel ylabel title legend colorbar savefig tight_layout grid set_xlim set_ylim plot scatter hist boxplot imshow cmap alpha bins tick_params annotate quiver contour barh stackplot subplots_adjust axhline axvline semilogx semilogy loglog polar streamplot hexbin pcolor tricontour errorbar clabel set_aspect violinplot set_axis_off spines text hatch plt axis plt.bar() plt.axis import figure pyplot highlight_text pypalettes plt.subplots() xlabel ylabel title legend colorbar savefig tight_layout grid set_xlim set_ylim plot scatter hist boxplot imshow cmap alpha bins tick_params annotate quiver contour barh stackplot subplots_adjust axhline axvline semilogx semilogy loglog polar streamplot hexbin pcolor tricontour errorbar clabel set_aspect violinplot set_axis_off spines text hatch plt axis plt.bar() plt.axis import figure pyplot highlight_text pypalettes plt.subplots() xlabel ylabel title legend colorbar savefig tight_layout grid set_xlim set_ylim plot scatter hist boxplot imshow cmap alpha bins tick_params annotate quiver contour barh stackplot subplots_adjust axhline axvline semilogx semilogy loglog polar streamplot hexbin pcolor tricontour errorbar clabel set_aspect violinplot set_axis_off spines text hatch plt axis plt.bar() plt.axis import figure pyplot highlight_text pypalettes plt.subplots() xlabel ylabel title legend colorbar savefig tight_layout grid set_xlim set_ylim plot scatter hist boxplot imshow cmap alpha bins tick_params annotate quiver contour barh stackplot subplots_adjust axhline axvline semilogx semilogy loglog polar streamplot hexbin pcolor tricontour errorbar clabel set_aspect violinplot set_axis_off spines text hatch plt axis plt.bar() plt.axis import figure pyplot highlight_text pypalettes plt.subplots() xlabel ylabel title legend colorbar savefig tight_layout grid set_xlim set_ylim plot scatter hist boxplot imshow cmap alpha bins tick_params annotate quiver contour barh stackplot subplots_adjust axhline axvline semilogx semilogy loglog polar streamplot hexbin pcolor tricontour errorbar clabel set_aspect violinplot set_axis_off spines text hatch plt axis plt.bar() plt.axis import figure pyplot highlight_text pypalettes plt.subplots() xlabel ylabel title legend colorbar savefig tight_layout grid set_xlim set_ylim plot scatter hist boxplot imshow cmap alpha bins tick_params annotate quiver contour barh stackplot subplots_adjust axhline axvline semilogx semilogy loglog polar streamplot hexbin pcolor tricontour errorbar clabel set_aspect violinplot set_axis_off spines text hatch plt axis plt.bar() plt.axis import figure pyplot highlight_text pypalettes plt.subplots() xlabel ylabel title legend colorbar savefig tight_layout grid set_xlim set_ylim plot scatter hist boxplot imshow cmap alpha bins tick_params annotate quiver contour barh stackplot subplots_adjust axhline axvline semilogx semilogy loglog polar streamplot hexbin pcolor tricontour errorbar clabel set_aspect violinplot set_axis_off spines text hatch plt axis plt.bar() plt.axis import figure pyplot highlight_text pypalettes plt.subplots() xlabel ylabel title legend colorbar savefig tight_layout grid set_xlim set_ylim plot scatter hist boxplot imshow cmap alpha bins tick_params annotate quiver contour barh stackplot subplots_adjust axhline axvline semilogx semilogy loglog polar streamplot hexbin pcolor tricontour errorbar clabel set_aspect violinplot set_axis_off spines text hatch plt axis plt.bar() plt.axis import figure pyplot highlight_text pypalettes plt.subplots() xlabel ylabel title legend colorbar savefig tight_layout grid set_xlim set_ylim plot scatter hist boxplot imshow cmap alpha bins tick_params annotate quiver contour barh stackplot subplots_adjust axhline axvline semilogx semilogy loglog polar streamplot hexbin pcolor tricontour errorbar clabel set_aspect violinplot set_axis_off spines text hatch plt axis plt.bar() plt.axis import figure pyplot highlight_text pypalettes plt.subplots() xlabel ylabel title legend colorbar savefig tight_layout grid set_xlim set_ylim plot scatter hist boxplot imshow cmap alpha bins tick_params annotate quiver contour barh stackplot subplots_adjust axhline axvline semilogx semilogy loglog polar streamplot hexbin pcolor tricontour errorbar clabel set_aspect violinplot set_axis_off spines text hatch plt axis plt.bar() plt.axis import figure pyplot highlight_text pypalettes plt.subplots() xlabel ylabel title legend colorbar savefig tight_layout grid set_xlim set_ylim plot scatter hist boxplot imshow cmap alpha bins tick_params annotate quiver contour barh stackplot subplots_adjust axhline axvline semilogx semilogy loglog polar streamplot hexbin pcolor tricontour errorbar clabel set_aspect violinplot set_axis_off spines text hatch plt axis plt.bar() plt.axis import figure pyplot highlight_text pypalettes plt.subplots() xlabel ylabel title legend colorbar savefig tight_layout grid set_xlim set_ylim plot scatter hist boxplot imshow cmap alpha bins tick_params annotate quiver contour barh stackplot subplots_adjust axhline axvline semilogx semilogy loglog polar streamplot hexbin pcolor tricontour errorbar clabel set_aspect violinplot set_axis_off spines text hatch plt axis plt.bar() plt.axis import figure pyplot highlight_text pypalettes plt.subplots() xlabel ylabel title legend colorbar savefig tight_layout grid set_xlim set_ylim plot scatter hist boxplot imshow cmap alpha bins tick_params annotate quiver contour barh stackplot subplots_adjust axhline axvline semilogx semilogy loglog polar streamplot hexbin pcolor tricontour errorbar clabel set_aspect violinplot set_axis_off spines text hatch plt axis plt.bar() plt.axis import figure pyplot highlight_text pypalettes plt.subplots() xlabel ylabel title legend colorbar savefig tight_layout grid set_xlim set_ylim plot scatter hist boxplot imshow cmap alpha bins tick_params annotate quiver contour barh stackplot subplots_adjust axhline axvline semilogx semilogy loglog polar streamplot hexbin pcolor tricontour errorbar clabel set_aspect violinplot set_axis_off spines text hatch plt axis plt.bar() plt.axis import figure pyplot highlight_text pypalettes plt.subplots() xlabel ylabel title legend colorbar savefig tight_layout grid set_xlim set_ylim plot scatter hist boxplot imshow cmap alpha bins tick_params annotate quiver contour barh stackplot subplots_adjust axhline axvline semilogx semilogy loglog polar streamplot hexbin pcolor tricontour errorbar clabel set_aspect violinplot set_axis_off spines text hatch plt axis plt.bar() plt.axis import figure pyplot highlight_text pypalettes plt.subplots() xlabel ylabel title legend colorbar savefig tight_layout grid set_xlim set_ylim plot scatter hist boxplot imshow cmap alpha bins tick_params annotate quiver contour barh stackplot subplots_adjust axhline axvline semilogx semilogy loglog polar streamplot hexbin pcolor tricontour errorbar clabel set_aspect violinplot set_axis_off spines text hatch plt axis plt.bar() plt.axis import figure pyplot highlight_text pypalettes plt.subplots() xlabel ylabel title legend colorbar savefig tight_layout grid set_xlim set_ylim plot scatter hist boxplot imshow cmap alpha bins tick_params annotate quiver contour barh stackplot subplots_adjust axhline axvline semilogx semilogy loglog polar streamplot hexbin pcolor tricontour errorbar clabel set_aspect violinplot set_axis_off spines text hatch plt axis plt.bar() plt.axis import figure pyplot highlight_text pypalettes plt.subplots() xlabel ylabel title legend colorbar savefig tight_layout grid set_xlim set_ylim plot scatter hist boxplot imshow cmap alpha bins tick_params annotate quiver contour barh stackplot subplots_adjust axhline axvline semilogx semilogy loglog polar streamplot hexbin pcolor tricontour errorbar clabel set_aspect violinplot set_axis_off spines text hatch plt axis plt.bar() plt.axis import figure pyplot highlight_text pypalettes plt.subplots() xlabel ylabel title legend colorbar savefig tight_layout grid set_xlim set_ylim plot scatter hist boxplot imshow cmap alpha bins tick_params annotate quiver contour barh stackplot subplots_adjust axhline axvline semilogx semilogy loglog polar streamplot hexbin pcolor tricontour errorbar clabel set_aspect violinplot set_axis_off spines text hatch plt axis plt.bar() plt.axis import figure pyplot highlight_text pypalettes plt.subplots() xlabel ylabel title legend colorbar savefig tight_layout grid set_xlim set_ylim plot scatter hist boxplot imshow cmap alpha bins tick_params annotate quiver contour barh stackplot subplots_adjust axhline axvline semilogx semilogy loglog polar streamplot hexbin pcolor tricontour errorbar clabel set_aspect violinplot set_axis_off spines text hatch plt axis plt.bar() plt.axis import figure pyplot highlight_text pypalettes plt.subplots() xlabel ylabel title legend colorbar savefig tight_layout grid set_xlim set_ylim plot scatter hist boxplot imshow cmap alpha bins tick_params annotate quiver contour barh stackplot subplots_adjust axhline axvline semilogx semilogy loglog polar streamplot hexbin pcolor tricontour errorbar clabel set_aspect violinplot set_axis_off spines text hatch plt axis plt.bar() plt.axis import figure pyplot highlight_text pypalettes plt.subplots() xlabel ylabel title legend colorbar savefig tight_layout grid set_xlim set_ylim plot scatter hist boxplot imshow cmap alpha bins tick_params annotate quiver contour barh stackplot subplots_adjust axhline axvline semilogx semilogy loglog polar streamplot hexbin pcolor tricontour errorbar clabel set_aspect violinplot set_axis_off spines text hatch plt axis plt.bar() plt.axis import figure pyplot highlight_text pypalettes plt.subplots() xlabel ylabel title legend colorbar savefig tight_layout grid set_xlim set_ylim plot scatter hist boxplot imshow cmap alpha bins tick_params annotate quiver contour barh stackplot subplots_adjust axhline axvline semilogx semilogy loglog polar streamplot hexbin pcolor tricontour errorbar clabel set_aspect violinplot set_axis_off spines text hatch plt axis plt.bar() plt.axis import figure pyplot highlight_text pypalettes plt.subplots() xlabel ylabel title legend colorbar savefig tight_layout grid set_xlim set_ylim plot scatter hist boxplot imshow cmap alpha bins tick_params annotate quiver contour barh stackplot subplots_adjust axhline axvline semilogx semilogy loglog polar streamplot hexbin pcolor tricontour errorbar clabel set_aspect violinplot set_axis_off spines text hatch plt axis plt.bar() plt.axis import figure pyplot highlight_text pypalettes plt.subplots() xlabel ylabel title legend colorbar savefig tight_layout grid set_xlim set_ylim plot scatter hist boxplot imshow cmap alpha bins tick_params annotate quiver contour barh stackplot subplots_adjust axhline axvline semilogx semilogy loglog polar streamplot hexbin pcolor tricontour errorbar clabel set_aspect violinplot set_axis_off spines text hatch plt axis plt.bar() plt.axis import figure pyplot highlight_text pypalettes plt.subplots() xlabel ylabel title legend colorbar savefig tight_layout grid set_xlim set_ylim plot scatter hist boxplot imshow cmap alpha bins tick_params annotate quiver contour barh stackplot subplots_adjust axhline axvline semilogx semilogy loglog polar streamplot hexbin pcolor tricontour errorbar clabel set_aspect violinplot set_axis_off spines text hatch plt axis plt.bar() plt.axis import figure pyplot highlight_text pypalettes plt.subplots() xlabel ylabel title legend colorbar savefig tight_layout grid set_xlim set_ylim plot scatter hist boxplot imshow cmap alpha bins tick_params annotate quiver contour barh stackplot subplots_adjust axhline axvline semilogx semilogy loglog polar streamplot hexbin pcolor tricontour errorbar clabel set_aspect violinplot set_axis_off spines text hatch plt axis plt.bar() plt.axis import figure pyplot highlight_text pypalettes plt.subplots() xlabel ylabel title legend colorbar savefig tight_layout grid set_xlim set_ylim plot scatter hist boxplot imshow cmap alpha bins tick_params annotate quiver contour barh stackplot subplots_adjust axhline axvline semilogx semilogy loglog polar streamplot hexbin pcolor tricontour errorbar clabel set_aspect violinplot set_axis_off spines text hatch plt axis plt.bar() plt.axis import figure pyplot highlight_text pypalettes plt.subplots() xlabel ylabel title legend colorbar savefig tight_layout grid set_xlim set_ylim plot scatter hist boxplot imshow cmap alpha bins tick_params annotate quiver contour barh stackplot subplots_adjust axhline axvline semilogx semilogy loglog polar streamplot hexbin pcolor tricontour errorbar clabel set_aspect violinplot set_axis_off spines text hatch plt axis plt.bar() plt.axis import figure pyplot highlight_text pypalettes plt.subplots() xlabel ylabel title legend colorbar savefig tight_layout grid set_xlim set_ylim plot scatter hist boxplot imshow cmap alpha bins tick_params annotate quiver contour barh stackplot subplots_adjust axhline axvline semilogx semilogy loglog polar streamplot hexbin pcolor tricontour errorbar clabel set_aspect violinplot set_axis_off spines text hatch plt axis plt.bar() plt.axis import figure pyplot highlight_text pypalettes plt.subplots() xlabel ylabel title legend colorbar savefig tight_layout grid set_xlim set_ylim plot scatter hist boxplot imshow cmap alpha bins tick_params annotate quiver contour barh stackplot subplots_adjust axhline axvline semilogx semilogy loglog polar streamplot hexbin pcolor tricontour errorbar clabel set_aspect violinplot set_axis_off spines text hatch plt axis plt.bar() plt.axis import figure pyplot highlight_text pypalettes plt.subplots() xlabel ylabel title legend colorbar savefig tight_layout grid set_xlim set_ylim plot scatter hist boxplot imshow cmap alpha bins tick_params annotate quiver contour barh stackplot subplots_adjust axhline axvline semilogx semilogy loglog polar streamplot hexbin pcolor tricontour errorbar clabel set_aspect violinplot set_axis_off spines text hatch plt axis plt.bar() plt.axis import figure pyplot highlight_text pypalettes plt.subplots() xlabel ylabel title legend colorbar savefig tight_layout grid set_xlim set_ylim plot scatter hist boxplot imshow cmap alpha bins tick_params annotate quiver contour barh stackplot subplots_adjust axhline axvline semilogx semilogy loglog polar streamplot hexbin pcolor tricontour errorbar clabel set_aspect violinplot set_axis_off spines text hatch plt axis plt.bar() plt.axis import figure pyplot highlight_text pypalettes plt.subplots() xlabel ylabel title legend colorbar savefig tight_layout grid set_xlim set_ylim plot scatter hist boxplot imshow cmap alpha bins tick_params annotate quiver contour barh stackplot subplots_adjust axhline axvline semilogx semilogy loglog polar streamplot hexbin pcolor tricontour errorbar clabel set_aspect violinplot set_axis_off spines text hatch plt axis plt.bar() plt.axis import figure pyplot highlight_text pypalettes plt.subplots() xlabel ylabel title legend colorbar savefig tight_layout grid set_xlim set_ylim plot scatter hist boxplot imshow cmap alpha bins tick_params annotate quiver contour barh stackplot subplots_adjust axhline axvline semilogx semilogy loglog polar streamplot hexbin pcolor tricontour errorbar clabel set_aspect violinplot set_axis_off spines text hatch plt axis plt.bar() plt.axis import figure pyplot highlight_text pypalettes plt.subplots() xlabel ylabel title legend colorbar savefig tight_layout grid set_xlim set_ylim plot scatter hist boxplot imshow cmap alpha bins tick_params annotate quiver contour barh stackplot subplots_adjust axhline axvline semilogx semilogy loglog polar streamplot hexbin pcolor tricontour errorbar clabel set_aspect violinplot set_axis_off spines text hatch plt axis plt.bar() plt.axis import figure pyplot highlight_text pypalettes plt.subplots() xlabel ylabel title legend colorbar savefig tight_layout grid set_xlim set_ylim plot scatter hist boxplot imshow cmap alpha bins tick_params annotate quiver contour barh stackplot subplots_adjust axhline axvline semilogx semilogy loglog polar streamplot hexbin pcolor tricontour errorbar clabel set_aspect violinplot set_axis_off spines text hatch plt axis plt.bar() plt.axis import figure pyplot highlight_text pypalettes plt.subplots() xlabel ylabel title legend colorbar savefig tight_layout grid set_xlim set_ylim plot scatter hist boxplot imshow cmap alpha bins tick_params annotate quiver contour barh stackplot subplots_adjust axhline axvline semilogx semilogy loglog polar streamplot hexbin pcolor tricontour errorbar clabel set_aspect violinplot set_axis_off spines text hatch plt axis plt.bar() plt.axis import figure pyplot highlight_text pypalettes plt.subplots() xlabel ylabel title legend colorbar savefig tight_layout grid set_xlim set_ylim plot scatter hist boxplot imshow cmap alpha bins tick_params annotate quiver contour barh stackplot subplots_adjust axhline axvline semilogx semilogy loglog polar streamplot hexbin pcolor tricontour errorbar clabel set_aspect violinplot set_axis_off spines text hatch plt axis plt.bar() plt.axis import figure pyplot highlight_text pypalettes plt.subplots() xlabel ylabel title legend colorbar savefig tight_layout grid set_xlim set_ylim plot scatter hist boxplot imshow cmap alpha bins tick_params annotate quiver contour barh stackplot subplots_adjust axhline axvline semilogx semilogy loglog polar streamplot hexbin pcolor tricontour errorbar clabel set_aspect violinplot set_axis_off spines text hatch plt axis plt.bar() plt.axis import figure pyplot highlight_text pypalettes plt.subplots() xlabel ylabel title legend colorbar savefig tight_layout grid set_xlim set_ylim plot scatter hist boxplot imshow cmap alpha bins tick_params annotate quiver contour barh stackplot subplots_adjust axhline axvline semilogx semilogy loglog polar streamplot hexbin pcolor tricontour errorbar clabel set_aspect violinplot set_axis_off spines text hatch plt axis plt.bar() plt.axis import figure pyplot highlight_text pypalettes plt.subplots() xlabel ylabel title legend colorbar savefig tight_layout grid set_xlim set_ylim plot scatter hist boxplot imshow cmap alpha bins tick_params annotate quiver contour barh stackplot subplots_adjust axhline axvline semilogx semilogy loglog polar streamplot hexbin pcolor tricontour errorbar clabel set_aspect violinplot set_axis_off spines text hatch plt axis plt.bar() plt.axis import figure pyplot highlight_text pypalettes plt.subplots() xlabel ylabel title legend colorbar savefig tight_layout grid set_xlim set_ylim plot scatter hist boxplot imshow cmap alpha bins tick_params annotate quiver contour barh stackplot subplots_adjust axhline axvline semilogx semilogy loglog polar streamplot hexbin pcolor tricontour errorbar clabel set_aspect violinplot set_axis_off spines text hatch plt axis plt.bar() plt.axis import figure pyplot highlight_text pypalettes plt.subplots() xlabel ylabel title legend colorbar savefig tight_layout grid set_xlim set_ylim plot scatter hist boxplot imshow cmap alpha bins tick_params annotate quiver contour barh stackplot subplots_adjust axhline axvline semilogx semilogy loglog polar streamplot hexbin pcolor tricontour errorbar clabel set_aspect violinplot set_axis_off spines text hatch plt axis plt.bar() plt.axis import figure pyplot highlight_text pypalettes plt.subplots() xlabel ylabel title legend colorbar savefig tight_layout grid set_xlim set_ylim plot scatter hist boxplot imshow cmap alpha bins tick_params annotate quiver contour barh stackplot subplots_adjust axhline axvline semilogx semilogy loglog polar streamplot hexbin pcolor tricontour errorbar clabel set_aspect violinplot set_axis_off spines text hatch plt axis plt.bar() plt.axis import figure pyplot highlight_text pypalettes plt.subplots() xlabel ylabel title legend colorbar savefig tight_layout grid set_xlim set_ylim plot scatter hist boxplot imshow cmap alpha bins tick_params annotate quiver contour barh stackplot subplots_adjust axhline axvline semilogx semilogy loglog polar streamplot hexbin pcolor tricontour errorbar clabel set_aspect violinplot set_axis_off spines text hatch plt axis plt.bar() plt.axis import figure pyplot highlight_text pypalettes plt.subplots() xlabel ylabel title legend colorbar savefig tight_layout grid set_xlim set_ylim plot scatter hist boxplot imshow cmap alpha bins tick_params annotate quiver contour barh stackplot subplots_adjust axhline axvline semilogx semilogy loglog polar streamplot hexbin pcolor tricontour errorbar clabel set_aspect violinplot set_axis_off spines text hatch plt axis plt.bar() plt.axis import figure pyplot highlight_text pypalettes plt.subplots() xlabel ylabel title legend colorbar savefig tight_layout grid set_xlim set_ylim plot scatter hist boxplot imshow cmap alpha bins tick_params annotate quiver contour barh stackplot subplots_adjust axhline axvline semilogx semilogy loglog polar streamplot hexbin pcolor tricontour errorbar clabel set_aspect violinplot set_axis_off spines text hatch plt axis plt.bar() plt.axis import figure pyplot highlight_text pypalettes plt.subplots() xlabel ylabel title legend colorbar savefig tight_layout grid set_xlim set_ylim plot scatter hist boxplot imshow cmap alpha bins tick_params annotate quiver contour barh stackplot subplots_adjust axhline axvline semilogx semilogy loglog polar streamplot hexbin pcolor tricontour errorbar clabel set_aspect violinplot set_axis_off spines text hatch plt axis plt.bar() plt.axis import figure pyplot highlight_text pypalettes plt.subplots() xlabel ylabel title legend colorbar savefig tight_layout grid set_xlim set_ylim plot scatter hist boxplot imshow cmap alpha bins tick_params annotate quiver contour barh stackplot subplots_adjust axhline axvline semilogx semilogy loglog polar streamplot hexbin pcolor tricontour errorbar clabel set_aspect violinplot set_axis_off spines text hatch plt axis plt.bar() plt.axis import figure pyplot highlight_text pypalettes plt.subplots() xlabel ylabel title legend colorbar savefig tight_layout grid set_xlim set_ylim plot scatter hist boxplot imshow cmap alpha bins tick_params annotate quiver contour barh stackplot subplots_adjust axhline axvline semilogx semilogy loglog polar streamplot hexbin pcolor tricontour errorbar clabel set_aspect violinplot set_axis_off spines text hatch plt axis plt.bar() plt.axis import figure pyplot highlight_text pypalettes plt.subplots() xlabel ylabel title legend colorbar savefig tight_layout grid set_xlim set_ylim plot scatter hist boxplot imshow cmap alpha bins tick_params annotate quiver contour barh stackplot subplots_adjust axhline axvline semilogx semilogy loglog polar streamplot hexbin pcolor tricontour errorbar clabel set_aspect violinplot set_axis_off spines text hatch plt axis plt.bar() plt.axis import figure pyplot highlight_text pypalettes plt.subplots() xlabel ylabel title legend colorbar savefig tight_layout grid set_xlim set_ylim plot scatter hist boxplot imshow cmap alpha bins tick_params annotate quiver contour barh stackplot subplots_adjust axhline axvline semilogx semilogy loglog polar streamplot hexbin pcolor tricontour errorbar clabel set_aspect violinplot set_axis_off spines text hatch plt axis plt.bar() plt.axis import figure pyplot highlight_text pypalettes plt.subplots() xlabel ylabel title legend colorbar savefig tight_layout grid set_xlim set_ylim plot scatter hist boxplot imshow cmap alpha bins tick_params annotate quiver contour barh stackplot subplots_adjust axhline axvline semilogx semilogy loglog polar streamplot hexbin pcolor tricontour errorbar clabel set_aspect violinplot set_axis_off spines text hatch plt axis plt.bar() plt.axis import figure pyplot highlight_text pypalettes plt.subplots() xlabel ylabel title legend colorbar savefig tight_layout grid set_xlim set_ylim plot scatter hist boxplot imshow cmap alpha bins tick_params annotate quiver contour barh stackplot subplots_adjust axhline axvline semilogx semilogy loglog polar streamplot hexbin pcolor tricontour errorbar clabel set_aspect violinplot set_axis_off spines text hatch plt axis plt.bar() plt.axis import figure pyplot highlight_text pypalettes plt.subplots() xlabel ylabel title legend colorbar savefig tight_layout grid set_xlim set_ylim plot scatter hist boxplot imshow cmap alpha bins tick_params annotate quiver contour barh stackplot subplots_adjust axhline axvline semilogx semilogy loglog polar streamplot hexbin pcolor tricontour errorbar clabel set_aspect violinplot set_axis_off spines text hatch plt axis plt.bar() plt.axis import figure pyplot highlight_text pypalettes plt.subplots() xlabel ylabel title legend colorbar savefig tight_layout grid set_xlim set_ylim plot scatter hist boxplot imshow cmap alpha bins tick_params annotate quiver contour barh stackplot subplots_adjust axhline axvline semilogx semilogy loglog polar streamplot hexbin pcolor tricontour errorbar clabel set_aspect violinplot set_axis_off spines text hatch plt axis plt.bar() plt.axis import figure pyplot highlight_text pypalettes plt.subplots() xlabel ylabel title legend colorbar savefig tight_layout grid set_xlim set_ylim plot scatter hist boxplot imshow cmap alpha bins tick_params annotate quiver contour barh stackplot subplots_adjust axhline axvline semilogx semilogy loglog polar streamplot hexbin pcolor tricontour errorbar clabel set_aspect violinplot set_axis_off spines text hatch plt axis plt.bar() plt.axis import figure pyplot highlight_text pypalettes plt.subplots() xlabel ylabel title legend colorbar savefig tight_layout grid set_xlim set_ylim plot scatter hist boxplot imshow cmap alpha bins tick_params annotate quiver contour barh stackplot subplots_adjust axhline axvline semilogx semilogy loglog polar streamplot hexbin pcolor tricontour errorbar clabel set_aspect violinplot set_axis_off spines text hatch plt axis plt.bar() plt.axis import figure pyplot highlight_text pypalettes plt.subplots() xlabel ylabel title legend colorbar savefig tight_layout grid set_xlim set_ylim plot scatter hist boxplot imshow cmap alpha bins tick_params annotate quiver contour barh stackplot subplots_adjust axhline axvline semilogx semilogy loglog polar streamplot hexbin pcolor tricontour errorbar clabel set_aspect violinplot set_axis_off spines text hatch plt axis plt.bar() plt.axis import figure pyplot highlight_text pypalettes plt.subplots() xlabel ylabel title legend colorbar savefig tight_layout grid set_xlim set_ylim plot scatter hist boxplot imshow cmap alpha bins tick_params annotate quiver contour barh stackplot subplots_adjust axhline axvline semilogx semilogy loglog polar streamplot hexbin pcolor tricontour errorbar clabel set_aspect violinplot set_axis_off spines text hatch plt axis plt.bar() plt.axis import figure pyplot highlight_text pypalettes plt.subplots() xlabel ylabel title legend colorbar savefig tight_layout grid set_xlim set_ylim plot scatter hist boxplot imshow cmap alpha bins tick_params annotate quiver contour barh stackplot subplots_adjust axhline axvline semilogx semilogy loglog polar streamplot hexbin pcolor tricontour errorbar clabel set_aspect violinplot set_axis_off spines text hatch plt axis plt.bar() plt.axis import figure pyplot highlight_text pypalettes plt.subplots() xlabel ylabel title legend colorbar savefig tight_layout grid set_xlim set_ylim plot scatter hist boxplot imshow cmap alpha bins tick_params annotate quiver contour barh stackplot subplots_adjust axhline axvline semilogx semilogy loglog polar streamplot hexbin pcolor tricontour errorbar clabel set_aspect violinplot set_axis_off spines text hatch plt axis plt.bar() plt.axis import figure pyplot highlight_text pypalettes plt.subplots() xlabel ylabel title legend colorbar savefig tight_layout grid set_xlim set_ylim plot scatter hist boxplot imshow cmap alpha bins tick_params annotate quiver contour barh stackplot subplots_adjust axhline axvline semilogx semilogy loglog polar streamplot hexbin pcolor tricontour errorbar clabel set_aspect violinplot set_axis_off spines text hatch plt axis plt.bar() plt.axis import figure pyplot highlight_text pypalettes plt.subplots() xlabel ylabel title legend colorbar savefig tight_layout grid set_xlim set_ylim plot scatter hist boxplot imshow cmap alpha bins tick_params annotate quiver contour barh stackplot subplots_adjust axhline axvline semilogx semilogy loglog polar streamplot hexbin pcolor tricontour errorbar clabel set_aspect violinplot set_axis_off spines text hatch plt axis plt.bar() plt.axis import figure pyplot highlight_text pypalettes plt.subplots() xlabel ylabel title legend colorbar savefig tight_layout grid set_xlim set_ylim plot scatter hist boxplot imshow cmap alpha bins tick_params annotate quiver contour barh stackplot subplots_adjust axhline axvline semilogx semilogy loglog polar streamplot hexbin pcolor tricontour errorbar clabel set_aspect violinplot set_axis_off spines text hatch plt axis plt.bar() plt.axis import figure pyplot highlight_text pypalettes plt.subplots() xlabel ylabel title legend colorbar savefig tight_layout grid set_xlim set_ylim plot scatter hist boxplot imshow cmap alpha bins tick_params annotate quiver contour barh stackplot subplots_adjust axhline axvline semilogx semilogy loglog polar streamplot hexbin pcolor tricontour errorbar clabel set_aspect violinplot set_axis_off spines text hatch plt axis plt.bar() plt.axis import figure pyplot highlight_text pypalettes plt.subplots() xlabel ylabel title legend colorbar savefig tight_layout grid set_xlim set_ylim plot scatter hist boxplot imshow cmap alpha bins tick_params annotate quiver contour barh stackplot subplots_adjust axhline axvline semilogx semilogy loglog polar streamplot hexbin pcolor tricontour errorbar clabel set_aspect violinplot set_axis_off spines text hatch plt axis plt.bar() plt.axis import figure pyplot highlight_text pypalettes plt.subplots() xlabel ylabel title legend colorbar savefig tight_layout grid set_xlim set_ylim plot scatter hist boxplot imshow cmap alpha bins tick_params annotate quiver contour barh stackplot subplots_adjust axhline axvline semilogx semilogy loglog polar streamplot hexbin pcolor tricontour errorbar clabel set_aspect violinplot set_axis_off spines text hatch plt axis plt.bar() plt.axis import figure pyplot highlight_text pypalettes plt.subplots() xlabel ylabel title legend colorbar savefig tight_layout grid set_xlim set_ylim plot scatter hist boxplot imshow cmap alpha bins tick_params annotate quiver contour barh stackplot subplots_adjust axhline axvline semilogx semilogy loglog polar streamplot hexbin pcolor tricontour errorbar clabel set_aspect violinplot set_axis_off spines text hatch plt axis plt.bar() plt.axis import figure pyplot highlight_text pypalettes plt.subplots() xlabel ylabel title legend colorbar savefig tight_layout grid set_xlim set_ylim plot scatter hist boxplot imshow cmap alpha bins tick_params annotate quiver contour barh stackplot subplots_adjust axhline axvline semilogx semilogy loglog polar streamplot hexbin pcolor tricontour errorbar clabel set_aspect violinplot set_axis_off spines text hatch plt axis plt.bar() plt.axis import figure pyplot highlight_text pypalettes plt.subplots() xlabel ylabel title legend colorbar savefig tight_layout grid set_xlim set_ylim plot scatter hist boxplot imshow cmap alpha bins tick_params annotate quiver contour barh stackplot subplots_adjust axhline axvline semilogx semilogy loglog polar streamplot hexbin pcolor tricontour errorbar clabel set_aspect violinplot set_axis_off spines text hatch plt axis plt.bar() plt.axis import figure pyplot highlight_text pypalettes plt.subplots() xlabel ylabel title legend colorbar savefig tight_layout grid set_xlim set_ylim plot scatter hist boxplot imshow cmap alpha bins tick_params annotate quiver contour barh stackplot subplots_adjust axhline axvline semilogx semilogy loglog polar streamplot hexbin pcolor tricontour errorbar clabel set_aspect violinplot set_axis_off spines text hatch plt axis plt.bar() plt.axis import figure pyplot highlight_text pypalettes plt.subplots() xlabel ylabel title legend colorbar savefig tight_layout grid set_xlim set_ylim plot scatter hist boxplot imshow cmap alpha bins tick_params annotate quiver contour barh stackplot subplots_adjust axhline axvline semilogx semilogy loglog polar streamplot hexbin pcolor tricontour errorbar clabel set_aspect violinplot set_axis_off spines text hatch plt axis plt.bar() plt.axis import figure pyplot highlight_text pypalettes plt.subplots() xlabel ylabel title legend colorbar savefig tight_layout grid set_xlim set_ylim plot scatter hist boxplot imshow cmap alpha bins tick_params annotate quiver contour barh stackplot subplots_adjust axhline axvline semilogx semilogy loglog polar streamplot hexbin pcolor tricontour errorbar clabel set_aspect violinplot set_axis_off spines text hatch plt axis plt.bar() plt.axis import figure pyplot highlight_text pypalettes plt.subplots() xlabel ylabel title legend colorbar savefig tight_layout grid set_xlim set_ylim plot scatter hist boxplot imshow cmap alpha bins tick_params annotate quiver contour barh stackplot subplots_adjust axhline axvline semilogx semilogy loglog polar streamplot hexbin pcolor tricontour errorbar clabel set_aspect violinplot set_axis_off spines text hatch plt axis plt.bar() plt.axis import figure pyplot highlight_text pypalettes plt.subplots() xlabel ylabel title legend colorbar savefig tight_layout grid set_xlim set_ylim plot scatter hist boxplot imshow cmap alpha bins tick_params annotate quiver contour barh stackplot subplots_adjust axhline axvline semilogx semilogy loglog polar streamplot hexbin pcolor tricontour errorbar clabel set_aspect violinplot set_axis_off spines text hatch plt axis plt.bar() plt.axis import figure pyplot highlight_text pypalettes plt.subplots() xlabel ylabel title legend colorbar savefig tight_layout grid set_xlim set_ylim plot scatter hist boxplot imshow cmap alpha bins tick_params annotate quiver contour barh stackplot subplots_adjust axhline axvline semilogx semilogy loglog polar streamplot hexbin pcolor tricontour errorbar clabel set_aspect violinplot set_axis_off spines text hatch plt axis plt.bar() plt.axis import figure pyplot highlight_text pypalettes plt.subplots() xlabel ylabel title legend colorbar savefig tight_layout grid set_xlim set_ylim plot scatter hist boxplot imshow cmap alpha bins tick_params annotate quiver contour barh stackplot subplots_adjust axhline axvline semilogx semilogy loglog polar streamplot hexbin pcolor tricontour errorbar clabel set_aspect violinplot set_axis_off spines text hatch plt axis plt.bar() plt.axis import figure pyplot highlight_text pypalettes plt.subplots() xlabel ylabel title legend colorbar savefig tight_layout grid set_xlim set_ylim plot scatter hist boxplot imshow cmap alpha bins tick_params annotate quiver contour barh stackplot subplots_adjust axhline axvline semilogx semilogy loglog polar streamplot hexbin pcolor tricontour errorbar clabel set_aspect violinplot set_axis_off spines text hatch plt axis plt.bar() plt.axis import figure pyplot highlight_text pypalettes plt.subplots() xlabel ylabel title legend colorbar savefig tight_layout grid set_xlim set_ylim plot scatter hist boxplot imshow cmap alpha bins tick_params annotate quiver contour barh stackplot subplots_adjust axhline axvline semilogx semilogy loglog polar streamplot hexbin pcolor tricontour errorbar clabel set_aspect violinplot set_axis_off spines text hatch plt axis plt.bar() plt.axis import figure pyplot highlight_text pypalettes plt.subplots() xlabel ylabel title legend colorbar savefig tight_layout grid set_xlim set_ylim plot scatter hist boxplot imshow cmap alpha bins tick_params annotate quiver contour barh stackplot subplots_adjust axhline axvline semilogx semilogy loglog polar streamplot hexbin pcolor tricontour errorbar clabel set_aspect violinplot set_axis_off spines text hatch plt axis plt.bar() plt.axis import figure pyplot highlight_text pypalettes plt.subplots() xlabel ylabel title legend colorbar savefig tight_layout grid set_xlim set_ylim plot scatter hist boxplot imshow cmap alpha bins tick_params annotate quiver contour barh stackplot subplots_adjust axhline axvline semilogx semilogy loglog polar streamplot hexbin pcolor tricontour errorbar clabel set_aspect violinplot set_axis_off spines text hatch plt axis plt.bar() plt.axis import figure pyplot highlight_text pypalettes plt.subplots() xlabel ylabel title legend colorbar savefig tight_layout grid set_xlim set_ylim plot scatter hist boxplot imshow cmap alpha bins tick_params annotate quiver contour barh stackplot subplots_adjust axhline axvline semilogx semilogy loglog polar streamplot hexbin pcolor tricontour errorbar clabel set_aspect violinplot set_axis_off spines text hatch plt axis plt.bar() plt.axis import figure pyplot highlight_text pypalettes plt.subplots() xlabel ylabel title legend colorbar savefig tight_layout grid set_xlim set_ylim plot scatter hist boxplot imshow cmap alpha bins tick_params annotate quiver contour barh stackplot subplots_adjust axhline axvline semilogx semilogy loglog polar streamplot hexbin pcolor tricontour errorbar clabel set_aspect violinplot set_axis_off spines text hatch plt axis plt.bar() plt.axis import figure pyplot highlight_text pypalettes plt.subplots() xlabel ylabel title legend colorbar savefig tight_layout grid set_xlim set_ylim plot scatter hist boxplot imshow cmap alpha bins tick_params annotate quiver contour barh stackplot subplots_adjust axhline axvline semilogx semilogy loglog polar streamplot hexbin pcolor tricontour errorbar clabel set_aspect violinplot set_axis_off spines text hatch plt axis plt.bar() plt.axis import figure pyplot highlight_text pypalettes plt.subplots() xlabel ylabel title legend colorbar savefig tight_layout grid set_xlim set_ylim plot scatter hist boxplot imshow cmap alpha bins tick_params annotate quiver contour barh stackplot subplots_adjust axhline axvline semilogx semilogy loglog polar streamplot hexbin pcolor tricontour errorbar clabel set_aspect violinplot set_axis_off spines text hatch plt axis plt.bar() plt.axis import figure pyplot highlight_text pypalettes plt.subplots() xlabel ylabel title legend colorbar savefig tight_layout grid set_xlim set_ylim plot scatter hist boxplot imshow cmap alpha bins tick_params annotate quiver contour barh stackplot subplots_adjust axhline axvline semilogx semilogy loglog polar streamplot hexbin pcolor tricontour errorbar clabel set_aspect violinplot set_axis_off spines text hatch plt axis plt.bar() plt.axis import figure pyplot highlight_text pypalettes plt.subplots() xlabel ylabel title legend colorbar savefig tight_layout grid set_xlim set_ylim plot scatter hist boxplot imshow cmap alpha bins tick_params annotate quiver contour barh stackplot subplots_adjust axhline axvline semilogx semilogy loglog polar streamplot hexbin pcolor tricontour errorbar clabel set_aspect violinplot set_axis_off spines text hatch plt axis plt.bar() plt.axis import figure pyplot highlight_text pypalettes plt.subplots() xlabel ylabel title legend colorbar savefig tight_layout grid set_xlim set_ylim plot scatter hist boxplot imshow cmap alpha bins tick_params annotate quiver contour barh stackplot subplots_adjust axhline axvline semilogx semilogy loglog polar streamplot hexbin pcolor tricontour errorbar clabel set_aspect violinplot set_axis_off spines text hatch plt axis plt.bar() plt.axis import figure pyplot highlight_text pypalettes plt.subplots() xlabel ylabel title legend colorbar savefig tight_layout grid set_xlim set_ylim plot scatter hist boxplot imshow cmap alpha bins tick_params annotate quiver contour barh stackplot subplots_adjust axhline axvline semilogx semilogy loglog polar streamplot hexbin pcolor tricontour errorbar clabel set_aspect violinplot set_axis_off spines text hatch plt axis plt.bar() plt.axis import figure pyplot highlight_text pypalettes plt.subplots() xlabel ylabel title legend colorbar savefig tight_layout grid set_xlim set_ylim plot scatter hist boxplot imshow cmap alpha bins tick_params annotate quiver contour barh stackplot subplots_adjust axhline axvline semilogx semilogy loglog polar streamplot hexbin pcolor tricontour errorbar clabel set_aspect violinplot set_axis_off spines text hatch plt axis plt.bar() plt.axis import figure pyplot highlight_text pypalettes plt.subplots() xlabel ylabel title legend colorbar savefig tight_layout grid set_xlim set_ylim plot scatter hist boxplot imshow cmap alpha bins tick_params annotate quiver contour barh stackplot subplots_adjust axhline axvline semilogx semilogy loglog polar streamplot hexbin pcolor tricontour errorbar clabel set_aspect violinplot set_axis_off spines text hatch plt axis plt.bar() plt.axis import figure pyplot highlight_text pypalettes plt.subplots() xlabel ylabel title legend colorbar savefig tight_layout grid set_xlim set_ylim plot scatter hist boxplot imshow cmap alpha bins tick_params annotate quiver contour barh stackplot subplots_adjust axhline axvline semilogx semilogy loglog polar streamplot hexbin pcolor tricontour errorbar clabel set_aspect violinplot set_axis_off spines text hatch plt axis plt.bar() plt.axis import figure pyplot highlight_text pypalettes plt.subplots() xlabel ylabel title legend colorbar savefig tight_layout grid set_xlim set_ylim plot scatter hist boxplot imshow cmap alpha bins tick_params annotate quiver contour barh stackplot subplots_adjust axhline axvline semilogx semilogy loglog polar streamplot hexbin pcolor tricontour errorbar clabel set_aspect violinplot set_axis_off spines text hatch plt axis plt.bar() plt.axis import figure pyplot highlight_text pypalettes plt.subplots() xlabel ylabel title legend colorbar savefig tight_layout grid set_xlim set_ylim plot scatter hist boxplot imshow cmap alpha bins tick_params annotate quiver contour barh stackplot subplots_adjust axhline axvline semilogx semilogy loglog polar streamplot hexbin pcolor tricontour errorbar clabel set_aspect violinplot set_axis_off spines text hatch plt axis plt.bar() plt.axis import figure pyplot highlight_text pypalettes plt.subplots() xlabel ylabel title legend colorbar savefig tight_layout grid set_xlim set_ylim plot scatter hist boxplot imshow cmap alpha bins tick_params annotate quiver contour barh stackplot subplots_adjust axhline axvline semilogx semilogy loglog polar streamplot hexbin pcolor tricontour errorbar clabel set_aspect violinplot set_axis_off spines text hatch plt axis plt.bar() plt.axis import figure pyplot highlight_text pypalettes plt.subplots() xlabel ylabel title legend colorbar savefig tight_layout grid set_xlim set_ylim plot scatter hist boxplot imshow cmap alpha bins tick_params annotate quiver contour barh stackplot subplots_adjust axhline axvline semilogx semilogy loglog polar streamplot hexbin pcolor tricontour errorbar clabel set_aspect violinplot set_axis_off spines text hatch plt axis plt.bar() plt.axis import figure pyplot highlight_text pypalettes plt.subplots() xlabel ylabel title legend colorbar savefig tight_layout grid set_xlim set_ylim plot scatter hist boxplot imshow cmap alpha bins tick_params annotate quiver contour barh stackplot subplots_adjust axhline axvline semilogx semilogy loglog polar streamplot hexbin pcolor tricontour errorbar clabel set_aspect violinplot set_axis_off spines text hatch plt axis plt.bar() plt.axis import figure pyplot highlight_text pypalettes plt.subplots() xlabel ylabel title legend colorbar savefig tight_layout grid set_xlim set_ylim plot scatter hist boxplot imshow cmap alpha bins tick_params annotate quiver contour barh stackplot subplots_adjust axhline axvline semilogx semilogy loglog polar streamplot hexbin pcolor tricontour errorbar clabel set_aspect violinplot set_axis_off spines text hatch plt axis plt.bar() plt.axis import figure pyplot highlight_text pypalettes plt.subplots() xlabel ylabel title legend colorbar savefig tight_layout grid set_xlim set_ylim plot scatter hist boxplot imshow cmap alpha bins tick_params annotate quiver contour barh stackplot subplots_adjust axhline axvline semilogx semilogy loglog polar streamplot hexbin pcolor tricontour errorbar clabel set_aspect violinplot set_axis_off spines text hatch plt axis plt.bar() plt.axis import figure pyplot highlight_text pypalettes plt.subplots() xlabel ylabel title legend colorbar savefig tight_layout grid set_xlim set_ylim plot scatter hist boxplot imshow cmap alpha bins tick_params annotate quiver contour barh stackplot subplots_adjust axhline axvline semilogx semilogy loglog polar streamplot hexbin pcolor tricontour errorbar clabel set_aspect violinplot set_axis_off spines text hatch plt axis plt.bar() plt.axis import figure pyplot highlight_text pypalettes plt.subplots() xlabel ylabel title legend colorbar savefig tight_layout grid set_xlim set_ylim plot scatter hist boxplot imshow cmap alpha bins tick_params annotate quiver contour barh stackplot subplots_adjust axhline axvline semilogx semilogy loglog polar streamplot hexbin pcolor tricontour errorbar clabel set_aspect violinplot set_axis_off spines text hatch plt axis plt.bar() plt.axis import figure pyplot highlight_text pypalettes plt.subplots() xlabel ylabel title legend colorbar savefig tight_layout grid set_xlim set_ylim plot scatter hist boxplot imshow cmap alpha bins tick_params annotate quiver contour barh stackplot subplots_adjust axhline axvline semilogx semilogy loglog polar streamplot hexbin pcolor tricontour errorbar clabel set_aspect violinplot set_axis_off spines text hatch plt axis plt.bar() plt.axis import figure pyplot highlight_text pypalettes plt.subplots() xlabel ylabel title legend colorbar savefig tight_layout grid set_xlim set_ylim plot scatter hist boxplot imshow cmap alpha bins tick_params annotate quiver contour barh stackplot subplots_adjust axhline axvline semilogx semilogy loglog polar streamplot hexbin pcolor tricontour errorbar clabel set_aspect violinplot set_axis_off spines text hatch plt axis plt.bar() plt.axis import figure pyplot highlight_text pypalettes plt.subplots() xlabel ylabel title legend colorbar savefig tight_layout grid set_xlim set_ylim plot scatter hist boxplot imshow cmap alpha bins tick_params annotate quiver contour barh stackplot subplots_adjust axhline axvline semilogx semilogy loglog polar streamplot hexbin pcolor tricontour errorbar clabel set_aspect violinplot set_axis_off spines text hatch plt axis plt.bar() plt.axis import figure pyplot highlight_text pypalettes plt.subplots() xlabel ylabel title legend colorbar savefig tight_layout grid set_xlim set_ylim plot scatter hist boxplot imshow cmap alpha bins tick_params annotate quiver contour barh stackplot subplots_adjust axhline axvline semilogx semilogy loglog polar streamplot hexbin pcolor tricontour errorbar clabel set_aspect violinplot set_axis_off spines text hatch plt axis plt.bar() plt.axis import figure pyplot highlight_text pypalettes plt.subplots() xlabel ylabel title legend colorbar savefig tight_layout grid set_xlim set_ylim plot scatter hist boxplot imshow cmap alpha bins tick_params annotate quiver contour barh stackplot subplots_adjust axhline axvline semilogx semilogy loglog polar streamplot hexbin pcolor tricontour errorbar clabel set_aspect violinplot set_axis_off spines text hatch plt axis plt.bar() plt.axis import figure pyplot highlight_text pypalettes plt.subplots() xlabel ylabel title legend colorbar savefig tight_layout grid set_xlim set_ylim plot scatter hist boxplot imshow cmap alpha bins tick_params annotate quiver contour barh stackplot subplots_adjust axhline axvline semilogx semilogy loglog polar streamplot hexbin pcolor tricontour errorbar clabel set_aspect violinplot set_axis_off spines text hatch plt axis plt.bar() plt.axis import figure pyplot highlight_text pypalettes plt.subplots() xlabel ylabel title legend colorbar savefig tight_layout grid set_xlim set_ylim plot scatter hist boxplot imshow cmap alpha bins tick_params annotate quiver contour barh stackplot subplots_adjust axhline axvline semilogx semilogy loglog polar streamplot hexbin pcolor tricontour errorbar clabel set_aspect violinplot set_axis_off spines text hatch plt axis plt.bar() plt.axis import figure pyplot highlight_text pypalettes plt.subplots() xlabel ylabel title legend colorbar savefig tight_layout grid set_xlim set_ylim plot scatter hist boxplot imshow cmap alpha bins tick_params annotate quiver contour barh stackplot subplots_adjust axhline axvline semilogx semilogy loglog polar streamplot hexbin pcolor tricontour errorbar clabel set_aspect violinplot set_axis_off spines text hatch plt axis plt.bar() plt.axis import figure pyplot highlight_text pypalettes plt.subplots() xlabel ylabel title legend colorbar savefig tight_layout grid set_xlim set_ylim plot scatter hist boxplot imshow cmap alpha bins tick_params annotate quiver contour barh stackplot subplots_adjust axhline axvline semilogx semilogy loglog polar streamplot hexbin pcolor tricontour errorbar clabel set_aspect violinplot set_axis_off spines text hatch plt axis plt.bar() plt.axis import figure pyplot highlight_text pypalettes plt.subplots() xlabel ylabel title legend colorbar savefig tight_layout grid set_xlim set_ylim plot scatter hist boxplot imshow cmap alpha bins tick_params annotate quiver contour barh stackplot subplots_adjust axhline axvline semilogx semilogy loglog polar streamplot hexbin pcolor tricontour errorbar clabel set_aspect violinplot set_axis_off spines text hatch plt axis plt.bar() plt.axis import figure pyplot highlight_text pypalettes plt.subplots() xlabel ylabel title legend colorbar savefig tight_layout grid set_xlim set_ylim plot scatter hist boxplot imshow cmap alpha bins tick_params annotate quiver contour barh stackplot subplots_adjust axhline axvline semilogx semilogy loglog polar streamplot hexbin pcolor tricontour errorbar clabel set_aspect violinplot set_axis_off spines text hatch plt axis plt.bar() plt.axis import figure pyplot highlight_text pypalettes plt.subplots() xlabel ylabel title legend colorbar savefig tight_layout grid set_xlim set_ylim plot scatter hist boxplot imshow cmap alpha bins tick_params annotate quiver contour barh stackplot subplots_adjust axhline axvline semilogx semilogy loglog polar streamplot hexbin pcolor tricontour errorbar clabel set_aspect violinplot set_axis_off spines text hatch plt axis plt.bar() plt.axis import figure pyplot highlight_text pypalettes plt.subplots() xlabel ylabel title legend colorbar savefig tight_layout grid set_xlim set_ylim plot scatter hist boxplot imshow cmap alpha bins tick_params annotate quiver contour barh stackplot subplots_adjust axhline axvline semilogx semilogy loglog polar streamplot hexbin pcolor tricontour errorbar clabel set_aspect violinplot set_axis_off spines text hatch plt axis plt.bar() plt.axis import figure pyplot highlight_text pypalettes plt.subplots() xlabel ylabel title legend colorbar savefig tight_layout grid set_xlim set_ylim plot scatter hist boxplot imshow cmap alpha bins tick_params annotate quiver contour barh stackplot subplots_adjust axhline axvline semilogx semilogy loglog polar streamplot hexbin pcolor tricontour errorbar clabel set_aspect violinplot set_axis_off spines text hatch plt axis plt.bar() plt.axis import figure pyplot highlight_text pypalettes plt.subplots() xlabel ylabel title legend colorbar savefig tight_layout grid set_xlim set_ylim plot scatter hist boxplot imshow cmap alpha bins tick_params annotate quiver contour barh stackplot subplots_adjust axhline axvline semilogx semilogy loglog polar streamplot hexbin pcolor tricontour errorbar clabel set_aspect violinplot set_axis_off spines text hatch plt axis plt.bar() plt.axis import figure pyplot highlight_text pypalettes plt.subplots() xlabel ylabel title legend colorbar savefig tight_layout grid set_xlim set_ylim plot scatter hist boxplot imshow cmap alpha bins tick_params annotate quiver contour barh stackplot subplots_adjust axhline axvline semilogx semilogy loglog polar streamplot hexbin pcolor tricontour errorbar clabel set_aspect violinplot set_axis_off spines text hatch plt axis plt.bar() plt.axis import figure pyplot highlight_text pypalettes plt.subplots() xlabel ylabel title legend colorbar savefig tight_layout grid set_xlim set_ylim plot scatter hist boxplot imshow cmap alpha bins tick_params annotate quiver contour barh stackplot subplots_adjust axhline axvline semilogx semilogy loglog polar streamplot hexbin pcolor tricontour errorbar clabel set_aspect violinplot set_axis_off spines text hatch plt axis plt.bar() plt.axis import figure pyplot highlight_text pypalettes plt.subplots() xlabel ylabel title legend colorbar savefig tight_layout grid set_xlim set_ylim plot scatter hist boxplot imshow cmap alpha bins tick_params annotate quiver contour barh stackplot subplots_adjust axhline axvline semilogx semilogy loglog polar streamplot hexbin pcolor tricontour errorbar clabel set_aspect violinplot set_axis_off spines text hatch plt axis plt.bar() plt.axis import figure pyplot highlight_text pypalettes plt.subplots() xlabel ylabel title legend colorbar savefig tight_layout grid set_xlim set_ylim plot scatter hist boxplot imshow cmap alpha bins tick_params annotate quiver contour barh stackplot subplots_adjust axhline axvline semilogx semilogy loglog polar streamplot hexbin pcolor tricontour errorbar clabel set_aspect violinplot set_axis_off spines text hatch plt axis plt.bar() plt.axis import figure pyplot highlight_text pypalettes plt.subplots() xlabel ylabel title legend colorbar savefig tight_layout grid set_xlim set_ylim plot scatter hist boxplot imshow cmap alpha bins tick_params annotate quiver contour barh stackplot subplots_adjust axhline axvline semilogx semilogy loglog polar streamplot hexbin pcolor tricontour errorbar clabel set_aspect violinplot set_axis_off spines text hatch plt axis plt.bar() plt.axis import figure pyplot highlight_text pypalettes plt.subplots() xlabel ylabel title legend colorbar savefig tight_layout grid set_xlim set_ylim plot scatter hist boxplot imshow cmap alpha bins tick_params annotate quiver contour barh stackplot subplots_adjust axhline axvline semilogx semilogy loglog polar streamplot hexbin pcolor tricontour errorbar clabel set_aspect violinplot set_axis_off spines text hatch plt axis plt.bar() plt.axis import figure pyplot highlight_text pypalettes plt.subplots() xlabel ylabel title legend colorbar savefig tight_layout grid set_xlim set_ylim plot scatter hist boxplot imshow cmap alpha bins tick_params annotate quiver contour barh stackplot subplots_adjust axhline axvline semilogx semilogy loglog polar streamplot hexbin pcolor tricontour errorbar clabel set_aspect violinplot set_axis_off spines text hatch plt axis plt.bar() plt.axis import figure pyplot highlight_text pypalettes plt.subplots() xlabel ylabel title legend colorbar savefig tight_layout grid set_xlim set_ylim plot scatter hist boxplot imshow cmap alpha bins tick_params annotate quiver contour barh stackplot subplots_adjust axhline axvline semilogx semilogy loglog polar streamplot hexbin pcolor tricontour errorbar clabel set_aspect violinplot set_axis_off spines text hatch plt axis plt.bar() plt.axis import figure pyplot highlight_text pypalettes plt.subplots() xlabel ylabel title legend colorbar savefig tight_layout grid set_xlim set_ylim plot scatter hist boxplot imshow cmap alpha bins tick_params annotate quiver contour barh stackplot subplots_adjust axhline axvline semilogx semilogy loglog polar streamplot hexbin pcolor tricontour errorbar clabel set_aspect violinplot set_axis_off spines text hatch plt axis plt.bar() plt.axis import figure pyplot highlight_text pypalettes plt.subplots() xlabel ylabel title legend colorbar savefig tight_layout grid set_xlim set_ylim plot scatter hist boxplot imshow cmap alpha bins tick_params annotate quiver contour barh stackplot subplots_adjust axhline axvline semilogx semilogy loglog polar streamplot hexbin pcolor tricontour errorbar clabel set_aspect violinplot set_axis_off spines text hatch plt axis plt.bar() plt.axis import figure pyplot highlight_text pypalettes plt.subplots() xlabel ylabel title legend colorbar savefig tight_layout grid set_xlim set_ylim plot scatter hist boxplot imshow cmap alpha bins tick_params annotate quiver contour barh stackplot subplots_adjust axhline axvline semilogx semilogy loglog polar streamplot hexbin pcolor tricontour errorbar clabel set_aspect violinplot set_axis_off spines text hatch plt axis plt.bar() plt.axis import figure pyplot highlight_text pypalettes plt.subplots() xlabel ylabel title legend colorbar savefig tight_layout grid set_xlim set_ylim plot scatter hist boxplot imshow cmap alpha bins tick_params annotate quiver contour barh stackplot subplots_adjust axhline axvline semilogx semilogy loglog polar streamplot hexbin pcolor tricontour errorbar clabel set_aspect violinplot set_axis_off spines text hatch plt axis plt.bar() plt.axis import figure pyplot highlight_text pypalettes plt.subplots() xlabel ylabel title legend colorbar savefig tight_layout grid set_xlim set_ylim plot scatter hist boxplot imshow cmap alpha bins tick_params annotate quiver contour barh stackplot subplots_adjust axhline axvline semilogx semilogy loglog polar streamplot hexbin pcolor tricontour errorbar clabel set_aspect violinplot set_axis_off spines text hatch plt axis plt.bar() plt.axis import figure pyplot highlight_text pypalettes plt.subplots() xlabel ylabel title legend colorbar savefig tight_layout grid set_xlim set_ylim plot scatter hist boxplot imshow cmap alpha bins tick_params annotate quiver contour barh stackplot subplots_adjust axhline axvline semilogx semilogy loglog polar streamplot hexbin pcolor tricontour errorbar clabel set_aspect violinplot set_axis_off spines text hatch plt axis plt.bar() plt.axis import figure pyplot highlight_text pypalettes plt.subplots() xlabel ylabel title legend colorbar savefig tight_layout grid set_xlim set_ylim plot scatter hist boxplot imshow cmap alpha bins tick_params annotate quiver contour barh stackplot subplots_adjust axhline axvline semilogx semilogy loglog polar streamplot hexbin pcolor tricontour errorbar clabel set_aspect violinplot set_axis_off spines text hatch plt axis plt.bar() plt.axis import figure pyplot highlight_text pypalettes plt.subplots() xlabel ylabel title legend colorbar savefig tight_layout grid set_xlim set_ylim plot scatter hist boxplot imshow cmap alpha bins tick_params annotate quiver contour barh stackplot subplots_adjust axhline axvline semilogx semilogy loglog polar streamplot hexbin pcolor tricontour errorbar clabel set_aspect violinplot set_axis_off spines text hatch plt axis plt.bar() plt.axis import figure pyplot highlight_text pypalettes plt.subplots() xlabel ylabel title legend colorbar savefig tight_layout grid set_xlim set_ylim plot scatter hist boxplot imshow cmap alpha bins tick_params annotate quiver contour barh stackplot subplots_adjust axhline axvline semilogx semilogy loglog polar streamplot hexbin pcolor tricontour errorbar clabel set_aspect violinplot set_axis_off spines text hatch plt axis plt.bar() plt.axis import figure pyplot highlight_text pypalettes plt.subplots() xlabel ylabel title legend colorbar savefig tight_layout grid set_xlim set_ylim plot scatter hist boxplot imshow cmap alpha bins tick_params annotate quiver contour barh stackplot subplots_adjust axhline axvline semilogx semilogy loglog polar streamplot hexbin pcolor tricontour errorbar clabel set_aspect violinplot set_axis_off spines text hatch plt axis plt.bar() plt.axis import figure pyplot highlight_text pypalettes plt.subplots() xlabel ylabel title legend colorbar savefig tight_layout grid set_xlim set_ylim plot scatter hist boxplot imshow cmap alpha bins tick_params annotate quiver contour barh stackplot subplots_adjust axhline axvline semilogx semilogy loglog polar streamplot hexbin pcolor tricontour errorbar clabel set_aspect violinplot set_axis_off spines text hatch plt axis plt.bar() plt.axis import figure pyplot highlight_text pypalettes plt.subplots() xlabel ylabel title legend colorbar savefig tight_layout grid set_xlim set_ylim plot scatter hist boxplot imshow cmap alpha bins tick_params annotate quiver contour barh stackplot subplots_adjust axhline axvline semilogx semilogy loglog polar streamplot hexbin pcolor tricontour errorbar clabel set_aspect violinplot set_axis_off spines text hatch plt axis plt.bar() plt.axis import figure pyplot highlight_text pypalettes plt.subplots() xlabel ylabel title legend colorbar savefig tight_layout grid set_xlim set_ylim plot scatter hist boxplot imshow cmap alpha bins tick_params annotate quiver contour barh stackplot subplots_adjust axhline axvline semilogx semilogy loglog polar streamplot hexbin pcolor tricontour errorbar clabel set_aspect violinplot set_axis_off spines text hatch plt axis plt.bar() plt.axis import figure pyplot highlight_text pypalettes plt.subplots() xlabel ylabel title legend colorbar savefig tight_layout grid set_xlim set_ylim plot scatter hist boxplot imshow cmap alpha bins tick_params annotate quiver contour barh stackplot subplots_adjust axhline axvline semilogx semilogy loglog polar streamplot hexbin pcolor tricontour errorbar clabel set_aspect violinplot set_axis_off spines text hatch plt axis plt.bar() plt.axis import figure pyplot highlight_text pypalettes plt.subplots() xlabel ylabel title legend colorbar savefig tight_layout grid set_xlim set_ylim plot scatter hist boxplot imshow cmap alpha bins tick_params annotate quiver contour barh stackplot subplots_adjust axhline axvline semilogx semilogy loglog polar streamplot hexbin pcolor tricontour errorbar clabel set_aspect violinplot set_axis_off spines text hatch plt axis plt.bar() plt.axis import figure pyplot highlight_text pypalettes plt.subplots() xlabel ylabel title legend colorbar savefig tight_layout grid set_xlim set_ylim plot scatter hist boxplot imshow cmap alpha bins tick_params annotate quiver contour barh stackplot subplots_adjust axhline axvline semilogx semilogy loglog polar streamplot hexbin pcolor tricontour errorbar clabel set_aspect violinplot set_axis_off spines text hatch plt axis plt.bar() plt.axis import figure pyplot highlight_text pypalettes plt.subplots() xlabel ylabel title legend colorbar savefig tight_layout grid set_xlim set_ylim plot scatter hist boxplot imshow cmap alpha bins tick_params annotate quiver contour barh stackplot subplots_adjust axhline axvline semilogx semilogy loglog polar streamplot hexbin pcolor tricontour errorbar clabel set_aspect violinplot set_axis_off spines text hatch plt axis plt.bar() plt.axis import figure pyplot highlight_text pypalettes plt.subplots() xlabel ylabel title legend colorbar savefig tight_layout grid set_xlim set_ylim plot scatter hist boxplot imshow cmap alpha bins tick_params annotate quiver contour barh stackplot subplots_adjust axhline axvline semilogx semilogy loglog polar streamplot hexbin pcolor tricontour errorbar clabel set_aspect violinplot set_axis_off spines text hatch plt axis plt.bar() plt.axis import figure pyplot highlight_text pypalettes plt.subplots() xlabel ylabel title legend colorbar savefig tight_layout grid set_xlim set_ylim plot scatter hist boxplot imshow cmap alpha bins tick_params annotate quiver contour barh stackplot subplots_adjust axhline axvline semilogx semilogy loglog polar streamplot hexbin pcolor tricontour errorbar clabel set_aspect violinplot set_axis_off spines text hatch plt axis plt.bar() plt.axis import figure pyplot highlight_text pypalettes plt.subplots() xlabel ylabel title legend colorbar savefig tight_layout grid set_xlim set_ylim plot scatter hist boxplot imshow cmap alpha bins tick_params annotate quiver contour barh stackplot subplots_adjust axhline axvline semilogx semilogy loglog polar streamplot hexbin pcolor tricontour errorbar clabel set_aspect violinplot set_axis_off spines text hatch plt axis plt.bar() plt.axis import figure pyplot highlight_text pypalettes plt.subplots() xlabel ylabel title legend colorbar savefig tight_layout grid set_xlim set_ylim plot scatter hist boxplot imshow cmap alpha bins tick_params annotate quiver contour barh stackplot subplots_adjust axhline axvline semilogx semilogy loglog polar streamplot hexbin pcolor tricontour errorbar clabel set_aspect violinplot set_axis_off spines text hatch plt axis plt.bar() plt.axis import figure pyplot highlight_text pypalettes plt.subplots() xlabel ylabel title legend colorbar savefig tight_layout grid set_xlim set_ylim plot scatter hist boxplot imshow cmap alpha bins tick_params annotate quiver contour barh stackplot subplots_adjust axhline axvline semilogx semilogy loglog polar streamplot hexbin pcolor tricontour errorbar clabel set_aspect violinplot set_axis_off spines text hatch plt axis plt.bar() plt.axis import figure pyplot highlight_text pypalettes plt.subplots() xlabel ylabel title legend colorbar savefig tight_layout grid set_xlim set_ylim plot scatter hist boxplot imshow cmap alpha bins tick_params annotate quiver contour barh stackplot subplots_adjust axhline axvline semilogx semilogy loglog polar streamplot hexbin pcolor tricontour errorbar clabel set_aspect violinplot set_axis_off spines text hatch plt axis plt.bar() plt.axis import figure pyplot highlight_text pypalettes plt.subplots() xlabel ylabel title legend colorbar savefig tight_layout grid set_xlim set_ylim plot scatter hist boxplot imshow cmap alpha bins tick_params annotate quiver contour barh stackplot subplots_adjust axhline axvline semilogx semilogy loglog polar streamplot hexbin pcolor tricontour errorbar clabel set_aspect violinplot set_axis_off spines text hatch plt axis plt.bar() plt.axis import figure pyplot highlight_text pypalettes plt.subplots() xlabel ylabel title legend colorbar savefig tight_layout grid set_xlim set_ylim plot scatter hist boxplot imshow cmap alpha bins tick_params annotate quiver contour barh stackplot subplots_adjust axhline axvline semilogx semilogy loglog polar streamplot hexbin pcolor tricontour errorbar clabel set_aspect violinplot set_axis_off spines text hatch plt axis plt.bar() plt.axis import figure pyplot highlight_text pypalettes plt.subplots() xlabel ylabel title legend colorbar savefig tight_layout grid set_xlim set_ylim plot scatter hist boxplot imshow cmap alpha bins tick_params annotate quiver contour barh stackplot subplots_adjust axhline axvline semilogx semilogy loglog polar streamplot hexbin pcolor tricontour errorbar clabel set_aspect violinplot set_axis_off spines text hatch plt axis plt.bar() plt.axis import figure pyplot highlight_text pypalettes plt.subplots() xlabel ylabel title legend colorbar savefig tight_layout grid set_xlim set_ylim plot scatter hist boxplot imshow cmap alpha bins tick_params annotate quiver contour barh stackplot subplots_adjust axhline axvline semilogx semilogy loglog polar streamplot hexbin pcolor tricontour errorbar clabel set_aspect violinplot set_axis_off spines text hatch plt axis plt.bar() plt.axis import figure pyplot highlight_text pypalettes plt.subplots() xlabel ylabel title legend colorbar savefig tight_layout grid set_xlim set_ylim plot scatter hist boxplot imshow cmap alpha bins tick_params annotate quiver contour barh stackplot subplots_adjust axhline axvline semilogx semilogy loglog polar streamplot hexbin pcolor tricontour errorbar clabel set_aspect violinplot set_axis_off spines text hatch plt axis plt.bar() plt.axis import figure pyplot highlight_text pypalettes plt.subplots() xlabel ylabel title legend colorbar savefig tight_layout grid set_xlim set_ylim plot scatter hist boxplot imshow cmap alpha bins tick_params annotate quiver contour barh stackplot subplots_adjust axhline axvline semilogx semilogy loglog polar streamplot hexbin pcolor tricontour errorbar clabel set_aspect violinplot set_axis_off spines text hatch plt axis plt.bar() plt.axis import figure pyplot highlight_text pypalettes plt.subplots() xlabel ylabel title legend colorbar savefig tight_layout grid set_xlim set_ylim plot scatter hist boxplot imshow cmap alpha bins tick_params annotate quiver contour barh stackplot subplots_adjust axhline axvline semilogx semilogy loglog polar streamplot hexbin pcolor tricontour errorbar clabel set_aspect violinplot set_axis_off spines text hatch plt axis plt.bar() plt.axis import figure pyplot highlight_text pypalettes plt.subplots() xlabel ylabel title legend colorbar savefig tight_layout grid set_xlim set_ylim plot scatter hist boxplot imshow cmap alpha bins tick_params annotate quiver contour barh stackplot subplots_adjust axhline axvline semilogx semilogy loglog polar streamplot hexbin pcolor tricontour errorbar clabel set_aspect violinplot set_axis_off spines text hatch plt axis plt.bar() plt.axis import figure pyplot highlight_text pypalettes plt.subplots() xlabel ylabel title legend colorbar savefig tight_layout grid set_xlim set_ylim plot scatter hist boxplot imshow cmap alpha bins tick_params annotate quiver contour barh stackplot subplots_adjust axhline axvline semilogx semilogy loglog polar streamplot hexbin pcolor tricontour errorbar clabel set_aspect violinplot set_axis_off spines text hatch plt axis plt.bar() plt.axis import figure pyplot highlight_text pypalettes plt.subplots() xlabel ylabel title legend colorbar savefig tight_layout grid set_xlim set_ylim plot scatter hist boxplot imshow cmap alpha bins tick_params annotate quiver contour barh stackplot subplots_adjust axhline axvline semilogx semilogy loglog polar streamplot hexbin pcolor tricontour errorbar clabel set_aspect violinplot set_axis_off spines text hatch plt axis plt.bar() plt.axis import figure pyplot highlight_text pypalettes plt.subplots() xlabel ylabel title legend colorbar savefig tight_layout grid set_xlim set_ylim plot scatter hist boxplot imshow cmap alpha bins tick_params annotate quiver contour barh stackplot subplots_adjust axhline axvline semilogx semilogy loglog polar streamplot hexbin pcolor tricontour errorbar clabel set_aspect violinplot set_axis_off spines text hatch plt axis plt.bar() plt.axis import figure pyplot highlight_text pypalettes plt.subplots() xlabel ylabel title legend colorbar savefig tight_layout grid set_xlim set_ylim plot scatter hist boxplot imshow cmap alpha bins tick_params annotate quiver contour barh stackplot subplots_adjust axhline axvline semilogx semilogy loglog polar streamplot hexbin pcolor tricontour errorbar clabel set_aspect violinplot set_axis_off spines text hatch plt axis plt.bar() plt.axis import figure pyplot highlight_text pypalettes plt.subplots() xlabel ylabel title legend colorbar savefig tight_layout grid set_xlim set_ylim plot scatter hist boxplot imshow cmap alpha bins tick_params annotate quiver contour barh stackplot subplots_adjust axhline axvline semilogx semilogy loglog polar streamplot hexbin pcolor tricontour errorbar clabel set_aspect violinplot set_axis_off spines text hatch plt axis plt.bar() plt.axis import figure pyplot highlight_text pypalettes plt.subplots() xlabel ylabel title legend colorbar savefig tight_layout grid set_xlim set_ylim plot scatter hist boxplot imshow cmap alpha bins tick_params annotate quiver contour barh stackplot subplots_adjust axhline axvline semilogx semilogy loglog polar streamplot hexbin pcolor tricontour errorbar clabel set_aspect violinplot set_axis_off spines text hatch plt axis plt.bar() plt.axis import figure pyplot highlight_text pypalettes plt.subplots() xlabel ylabel title legend colorbar savefig tight_layout grid set_xlim set_ylim plot scatter hist boxplot imshow cmap alpha bins tick_params annotate quiver contour barh stackplot subplots_adjust axhline axvline semilogx semilogy loglog polar streamplot hexbin pcolor tricontour errorbar clabel set_aspect violinplot set_axis_off spines text hatch plt axis plt.bar() plt.axis import figure pyplot highlight_text pypalettes plt.subplots() xlabel ylabel title legend colorbar savefig tight_layout grid set_xlim set_ylim plot scatter hist boxplot imshow cmap alpha bins tick_params annotate quiver contour barh stackplot subplots_adjust axhline axvline semilogx semilogy loglog polar streamplot hexbin pcolor tricontour errorbar clabel set_aspect violinplot set_axis_off spines text hatch plt axis plt.bar() plt.axis import figure pyplot highlight_text pypalettes plt.subplots() xlabel ylabel title legend colorbar savefig tight_layout grid set_xlim set_ylim plot scatter hist boxplot imshow cmap alpha bins tick_params annotate quiver contour barh stackplot subplots_adjust axhline axvline semilogx semilogy loglog polar streamplot hexbin pcolor tricontour errorbar clabel set_aspect violinplot set_axis_off spines text hatch plt axis plt.bar() plt.axis import figure pyplot highlight_text pypalettes plt.subplots() xlabel ylabel title legend colorbar savefig tight_layout grid set_xlim set_ylim plot scatter hist boxplot imshow cmap alpha bins tick_params annotate quiver contour barh stackplot subplots_adjust axhline axvline semilogx semilogy loglog polar streamplot hexbin pcolor tricontour errorbar clabel set_aspect violinplot set_axis_off spines text hatch plt axis plt.bar() plt.axis import figure pyplot highlight_text pypalettes plt.subplots() xlabel ylabel title legend colorbar savefig tight_layout grid set_xlim set_ylim plot scatter hist boxplot imshow cmap alpha bins tick_params annotate quiver contour barh stackplot subplots_adjust axhline axvline semilogx semilogy loglog polar streamplot hexbin pcolor tricontour errorbar clabel set_aspect violinplot set_axis_off spines text hatch plt axis plt.bar() plt.axis import figure pyplot highlight_text pypalettes plt.subplots() xlabel ylabel title legend colorbar savefig tight_layout grid set_xlim set_ylim plot scatter hist boxplot imshow cmap alpha bins tick_params annotate quiver contour barh stackplot subplots_adjust axhline axvline semilogx semilogy loglog polar streamplot hexbin pcolor tricontour errorbar clabel set_aspect violinplot set_axis_off spines text hatch plt axis plt.bar() plt.axis import figure pyplot highlight_text pypalettes plt.subplots() xlabel ylabel title legend colorbar savefig tight_layout grid set_xlim set_ylim plot scatter hist boxplot imshow cmap alpha bins tick_params annotate quiver contour barh stackplot subplots_adjust axhline axvline semilogx semilogy loglog polar streamplot hexbin pcolor tricontour errorbar clabel set_aspect violinplot set_axis_off spines text hatch plt axis plt.bar() plt.axis import figure pyplot highlight_text pypalettes plt.subplots() xlabel ylabel title legend colorbar savefig tight_layout grid set_xlim set_ylim plot scatter hist boxplot imshow cmap alpha bins tick_params annotate quiver contour barh stackplot subplots_adjust axhline axvline semilogx semilogy loglog polar streamplot hexbin pcolor tricontour errorbar clabel set_aspect violinplot set_axis_off spines text hatch plt axis plt.bar() plt.axis import figure pyplot highlight_text pypalettes plt.subplots() xlabel ylabel title legend colorbar savefig tight_layout grid set_xlim set_ylim plot scatter hist boxplot imshow cmap alpha bins tick_params annotate quiver contour barh stackplot subplots_adjust axhline axvline semilogx semilogy loglog polar streamplot hexbin pcolor tricontour errorbar clabel set_aspect violinplot set_axis_off spines text hatch plt axis plt.bar() plt.axis import figure pyplot highlight_text pypalettes plt.subplots() xlabel ylabel title legend colorbar savefig tight_layout grid set_xlim set_ylim plot scatter hist boxplot imshow cmap alpha bins tick_params annotate quiver contour barh stackplot subplots_adjust axhline axvline semilogx semilogy loglog polar streamplot hexbin pcolor tricontour errorbar clabel set_aspect violinplot set_axis_off spines text hatch plt axis plt.bar() plt.axis import figure pyplot highlight_text pypalettes plt.subplots() xlabel ylabel title legend colorbar savefig tight_layout grid set_xlim set_ylim plot scatter hist boxplot imshow cmap alpha bins tick_params annotate quiver contour barh stackplot subplots_adjust axhline axvline semilogx semilogy loglog polar streamplot hexbin pcolor tricontour errorbar clabel set_aspect violinplot set_axis_off spines text hatch plt axis plt.bar() plt.axis import figure pyplot highlight_text pypalettes plt.subplots() xlabel ylabel title legend colorbar savefig tight_layout grid set_xlim set_ylim plot scatter hist boxplot imshow cmap alpha bins tick_params annotate quiver contour barh stackplot subplots_adjust axhline axvline semilogx semilogy loglog polar streamplot hexbin pcolor tricontour errorbar clabel set_aspect violinplot set_axis_off spines text hatch plt axis plt.bar() plt.axis import figure pyplot highlight_text pypalettes plt.subplots() xlabel ylabel title legend colorbar savefig tight_layout grid set_xlim set_ylim plot scatter hist boxplot imshow cmap alpha bins tick_params annotate quiver contour barh stackplot subplots_adjust axhline axvline semilogx semilogy loglog polar streamplot hexbin pcolor tricontour errorbar clabel set_aspect violinplot set_axis_off spines text hatch plt axis plt.bar() plt.axis import figure pyplot highlight_text pypalettes plt.subplots() xlabel ylabel title legend colorbar savefig tight_layout grid set_xlim set_ylim plot scatter hist boxplot imshow cmap alpha bins tick_params annotate quiver contour barh stackplot subplots_adjust axhline axvline semilogx semilogy loglog polar streamplot hexbin pcolor tricontour errorbar clabel set_aspect violinplot set_axis_off spines text hatch plt axis plt.bar() plt.axis import figure pyplot highlight_text pypalettes plt.subplots() xlabel ylabel title legend colorbar savefig tight_layout grid set_xlim set_ylim plot scatter hist boxplot imshow cmap alpha bins tick_params annotate quiver contour barh stackplot subplots_adjust axhline axvline semilogx semilogy loglog polar streamplot hexbin pcolor tricontour errorbar clabel set_aspect violinplot set_axis_off spines text hatch plt axis plt.bar() plt.axis import figure pyplot highlight_text pypalettes plt.subplots() xlabel ylabel title legend colorbar savefig tight_layout grid set_xlim set_ylim plot scatter hist boxplot imshow cmap alpha bins tick_params annotate quiver contour barh stackplot subplots_adjust axhline axvline semilogx semilogy loglog polar streamplot hexbin pcolor tricontour errorbar clabel set_aspect violinplot set_axis_off spines text hatch plt axis plt.bar() plt.axis import figure pyplot highlight_text pypalettes plt.subplots() xlabel ylabel title legend colorbar savefig tight_layout grid set_xlim set_ylim plot scatter hist boxplot imshow cmap alpha bins tick_params annotate quiver contour barh stackplot subplots_adjust axhline axvline semilogx semilogy loglog polar streamplot hexbin pcolor tricontour errorbar clabel set_aspect violinplot set_axis_off spines text hatch plt axis plt.bar() plt.axis import figure pyplot highlight_text pypalettes plt.subplots() xlabel ylabel title legend colorbar savefig tight_layout grid set_xlim set_ylim plot scatter hist boxplot imshow cmap alpha bins tick_params annotate quiver contour barh stackplot subplots_adjust axhline axvline semilogx semilogy loglog polar streamplot hexbin pcolor tricontour errorbar clabel set_aspect violinplot set_axis_off spines text hatch plt axis plt.bar() plt.axis import figure pyplot highlight_text pypalettes plt.subplots() xlabel ylabel title legend colorbar savefig tight_layout grid set_xlim set_ylim plot scatter hist boxplot imshow cmap alpha bins tick_params annotate quiver contour barh stackplot subplots_adjust axhline axvline semilogx semilogy loglog polar streamplot hexbin pcolor tricontour errorbar clabel set_aspect violinplot set_axis_off spines text hatch plt axis plt.bar() plt.axis import figure pyplot highlight_text pypalettes plt.subplots() xlabel ylabel title legend colorbar savefig tight_layout grid set_xlim set_ylim plot scatter hist boxplot imshow cmap alpha bins tick_params annotate quiver contour barh stackplot subplots_adjust axhline axvline semilogx semilogy loglog polar streamplot hexbin pcolor tricontour errorbar clabel set_aspect violinplot set_axis_off spines text hatch plt axis plt.bar() plt.axis import figure pyplot highlight_text pypalettes plt.subplots() xlabel ylabel title legend colorbar savefig tight_layout grid set_xlim set_ylim plot scatter hist boxplot imshow cmap alpha bins tick_params annotate quiver contour barh stackplot subplots_adjust axhline axvline semilogx semilogy loglog polar streamplot hexbin pcolor tricontour errorbar clabel set_aspect violinplot set_axis_off spines text hatch plt axis plt.bar() plt.axis import figure pyplot highlight_text pypalettes plt.subplots() xlabel ylabel title legend colorbar savefig tight_layout grid set_xlim set_ylim plot scatter hist boxplot imshow cmap alpha bins tick_params annotate quiver contour barh stackplot subplots_adjust axhline axvline semilogx semilogy loglog polar streamplot hexbin pcolor tricontour errorbar clabel set_aspect violinplot set_axis_off spines text hatch plt axis plt.bar() plt.axis import figure pyplot highlight_text pypalettes plt.subplots() xlabel ylabel title legend colorbar savefig tight_layout grid set_xlim set_ylim plot scatter hist boxplot imshow cmap alpha bins tick_params annotate quiver contour barh stackplot subplots_adjust axhline axvline semilogx semilogy loglog polar streamplot hexbin pcolor tricontour errorbar clabel set_aspect violinplot set_axis_off spines text hatch plt axis plt.bar() plt.axis import figure pyplot highlight_text pypalettes plt.subplots() xlabel ylabel title legend colorbar savefig tight_layout grid set_xlim set_ylim plot scatter hist boxplot imshow cmap alpha bins tick_params annotate quiver contour barh stackplot subplots_adjust axhline axvline semilogx semilogy loglog polar streamplot hexbin pcolor tricontour errorbar clabel set_aspect violinplot set_axis_off spines text hatch plt axis plt.bar() plt.axis import figure pyplot highlight_text pypalettes plt.subplots() xlabel ylabel title legend colorbar savefig tight_layout grid set_xlim set_ylim plot scatter hist boxplot imshow cmap alpha bins tick_params annotate quiver contour barh stackplot subplots_adjust axhline axvline semilogx semilogy loglog polar streamplot hexbin pcolor tricontour errorbar clabel set_aspect violinplot set_axis_off spines text hatch plt axis plt.bar() plt.axis import figure pyplot highlight_text pypalettes plt.subplots() xlabel ylabel title legend colorbar savefig tight_layout grid set_xlim set_ylim plot scatter hist boxplot imshow cmap alpha bins tick_params annotate quiver contour barh stackplot subplots_adjust axhline axvline semilogx semilogy loglog polar streamplot hexbin pcolor tricontour errorbar clabel set_aspect violinplot set_axis_off spines text hatch plt axis plt.bar() plt.axis import figure pyplot highlight_text pypalettes plt.subplots() xlabel ylabel title legend colorbar savefig tight_layout grid set_xlim set_ylim plot scatter hist boxplot imshow cmap alpha bins tick_params annotate quiver contour barh stackplot subplots_adjust axhline axvline semilogx semilogy loglog polar streamplot hexbin pcolor tricontour errorbar clabel set_aspect violinplot set_axis_off spines text hatch plt axis plt.bar() plt.axis import figure pyplot highlight_text pypalettes plt.subplots() xlabel ylabel title legend colorbar savefig tight_layout grid set_xlim set_ylim plot scatter hist boxplot imshow cmap alpha bins tick_params annotate quiver contour barh stackplot subplots_adjust axhline axvline semilogx semilogy loglog polar streamplot hexbin pcolor tricontour errorbar clabel set_aspect violinplot set_axis_off spines text hatch plt axis plt.bar() plt.axis import figure pyplot highlight_text pypalettes plt.subplots() xlabel ylabel title legend colorbar savefig tight_layout grid set_xlim set_ylim plot scatter hist boxplot imshow cmap alpha bins tick_params annotate quiver contour barh stackplot subplots_adjust axhline axvline semilogx semilogy loglog polar streamplot hexbin pcolor tricontour errorbar clabel set_aspect violinplot set_axis_off spines text hatch plt axis plt.bar() plt.axis import figure pyplot highlight_text pypalettes plt.subplots() xlabel ylabel title legend colorbar savefig tight_layout grid set_xlim set_ylim plot scatter hist boxplot imshow cmap alpha bins tick_params annotate quiver contour barh stackplot subplots_adjust axhline axvline semilogx semilogy loglog polar streamplot hexbin pcolor tricontour errorbar clabel set_aspect violinplot set_axis_off spines text hatch plt axis plt.bar() plt.axis import figure pyplot highlight_text pypalettes plt.subplots() xlabel ylabel title legend colorbar savefig tight_layout grid set_xlim set_ylim plot scatter hist boxplot imshow cmap alpha bins tick_params annotate quiver contour barh stackplot subplots_adjust axhline axvline semilogx semilogy loglog polar streamplot hexbin pcolor tricontour errorbar clabel set_aspect violinplot set_axis_off spines text hatch plt axis plt.bar() plt.axis import figure pyplot highlight_text pypalettes plt.subplots() xlabel ylabel title legend colorbar savefig tight_layout grid set_xlim set_ylim plot scatter hist boxplot imshow cmap alpha bins tick_params annotate quiver contour barh stackplot subplots_adjust axhline axvline semilogx semilogy loglog polar streamplot hexbin pcolor tricontour errorbar clabel set_aspect violinplot set_axis_off spines text hatch plt axis plt.bar() plt.axis import figure pyplot highlight_text pypalettes plt.subplots() xlabel ylabel title legend colorbar savefig tight_layout grid set_xlim set_ylim plot scatter hist boxplot imshow cmap alpha bins tick_params annotate quiver contour barh stackplot subplots_adjust axhline axvline semilogx semilogy loglog polar streamplot hexbin pcolor tricontour errorbar clabel set_aspect violinplot set_axis_off spines text hatch plt axis plt.bar() plt.axis import figure pyplot highlight_text pypalettes plt.subplots() xlabel ylabel title legend colorbar savefig tight_layout grid set_xlim set_ylim plot scatter hist boxplot imshow cmap alpha bins tick_params annotate quiver contour barh stackplot subplots_adjust axhline axvline semilogx semilogy loglog polar streamplot hexbin pcolor tricontour errorbar clabel set_aspect violinplot set_axis_off spines text hatch plt axis plt.bar() plt.axis import figure pyplot highlight_text pypalettes plt.subplots() xlabel ylabel title legend colorbar savefig tight_layout grid set_xlim set_ylim plot scatter hist boxplot imshow cmap alpha bins tick_params annotate quiver contour barh stackplot subplots_adjust axhline axvline semilogx semilogy loglog polar streamplot hexbin pcolor tricontour errorbar clabel set_aspect violinplot set_axis_off spines text hatch plt axis plt.bar() plt.axis import figure pyplot highlight_text pypalettes plt.subplots() xlabel ylabel title legend colorbar savefig tight_layout grid set_xlim set_ylim plot scatter hist boxplot imshow cmap alpha bins tick_params annotate quiver contour barh stackplot subplots_adjust axhline axvline semilogx semilogy loglog polar streamplot hexbin pcolor tricontour errorbar clabel set_aspect violinplot set_axis_off spines text hatch plt axis plt.bar() plt.axis import figure pyplot highlight_text pypalettes plt.subplots() xlabel ylabel title legend colorbar savefig tight_layout grid set_xlim set_ylim plot scatter hist boxplot imshow cmap alpha bins tick_params annotate quiver contour barh stackplot subplots_adjust axhline axvline semilogx semilogy loglog polar streamplot hexbin pcolor tricontour errorbar clabel set_aspect violinplot set_axis_off spines text hatch plt axis plt.bar() plt.axis import figure pyplot highlight_text pypalettes plt.subplots() xlabel ylabel title legend colorbar savefig tight_layout grid set_xlim set_ylim plot scatter hist boxplot imshow cmap alpha bins tick_params annotate quiver contour barh stackplot subplots_adjust axhline axvline semilogx semilogy loglog polar streamplot hexbin pcolor tricontour errorbar clabel set_aspect violinplot set_axis_off spines text hatch plt axis plt.bar() plt.axis import figure pyplot highlight_text pypalettes plt.subplots() xlabel ylabel title legend colorbar savefig tight_layout grid set_xlim set_ylim plot scatter hist boxplot imshow cmap alpha bins tick_params annotate quiver contour barh stackplot subplots_adjust axhline axvline semilogx semilogy loglog polar streamplot hexbin pcolor tricontour errorbar clabel set_aspect violinplot set_axis_off spines text hatch plt axis plt.bar() plt.axis import figure pyplot highlight_text pypalettes plt.subplots() xlabel ylabel title legend colorbar savefig tight_layout grid set_xlim set_ylim plot scatter hist boxplot imshow cmap alpha bins tick_params annotate quiver contour barh stackplot subplots_adjust axhline axvline semilogx semilogy loglog polar streamplot hexbin pcolor tricontour errorbar clabel set_aspect violinplot set_axis_off spines text hatch plt axis plt.bar() plt.axis import figure pyplot highlight_text pypalettes plt.subplots() xlabel ylabel title legend colorbar savefig tight_layout grid set_xlim set_ylim plot scatter hist boxplot imshow cmap alpha bins tick_params annotate quiver contour barh stackplot subplots_adjust axhline axvline semilogx semilogy loglog polar streamplot hexbin pcolor tricontour errorbar clabel set_aspect violinplot set_axis_off spines text hatch plt axis plt.bar() plt.axis import figure pyplot highlight_text pypalettes plt.subplots() xlabel ylabel title legend colorbar savefig tight_layout grid set_xlim set_ylim plot scatter hist boxplot imshow cmap alpha bins tick_params annotate quiver contour barh stackplot subplots_adjust axhline axvline semilogx semilogy loglog polar streamplot hexbin pcolor tricontour errorbar clabel set_aspect violinplot set_axis_off spines text hatch plt axis plt.bar() plt.axis import figure pyplot highlight_text pypalettes plt.subplots() xlabel ylabel title legend colorbar savefig tight_layout grid set_xlim set_ylim plot scatter hist boxplot imshow cmap alpha bins tick_params annotate quiver contour barh stackplot subplots_adjust axhline axvline semilogx semilogy loglog polar streamplot hexbin pcolor tricontour errorbar clabel set_aspect violinplot set_axis_off spines text hatch plt axis plt.bar() plt.axis import figure pyplot highlight_text pypalettes plt.subplots() xlabel ylabel title legend colorbar savefig tight_layout grid set_xlim set_ylim plot scatter hist boxplot imshow cmap alpha bins tick_params annotate quiver contour barh stackplot subplots_adjust axhline axvline semilogx semilogy loglog polar streamplot hexbin pcolor tricontour errorbar clabel set_aspect violinplot set_axis_off spines text hatch plt axis plt.bar() plt.axis import figure pyplot highlight_text pypalettes plt.subplots() xlabel ylabel title legend colorbar savefig tight_layout grid set_xlim set_ylim plot scatter hist boxplot imshow cmap alpha bins tick_params annotate quiver contour barh stackplot subplots_adjust axhline axvline semilogx semilogy loglog polar streamplot hexbin pcolor tricontour errorbar clabel set_aspect violinplot set_axis_off spines text hatch plt axis plt.bar() plt.axis import figure pyplot highlight_text pypalettes plt.subplots() xlabel ylabel title legend colorbar savefig tight_layout grid set_xlim set_ylim plot scatter hist boxplot imshow cmap alpha bins tick_params annotate quiver contour barh stackplot subplots_adjust axhline axvline semilogx semilogy loglog polar streamplot hexbin pcolor tricontour errorbar clabel set_aspect violinplot set_axis_off spines text hatch plt axis plt.bar() plt.axis import figure pyplot highlight_text pypalettes plt.subplots() xlabel ylabel title legend colorbar savefig tight_layout grid set_xlim set_ylim plot scatter hist boxplot imshow cmap alpha bins tick_params annotate quiver contour barh stackplot subplots_adjust axhline axvline semilogx semilogy loglog polar streamplot hexbin pcolor tricontour errorbar clabel set_aspect violinplot set_axis_off spines text hatch plt axis plt.bar() plt.axis import figure pyplot highlight_text pypalettes plt.subplots() xlabel ylabel title legend colorbar savefig tight_layout grid set_xlim set_ylim plot scatter hist boxplot imshow cmap alpha bins tick_params annotate quiver contour barh stackplot subplots_adjust axhline axvline semilogx semilogy loglog polar streamplot hexbin pcolor tricontour errorbar clabel set_aspect violinplot set_axis_off spines text hatch plt axis plt.bar() plt.axis import figure pyplot highlight_text pypalettes plt.subplots() xlabel ylabel title legend colorbar savefig tight_layout grid set_xlim set_ylim plot scatter hist boxplot imshow cmap alpha bins tick_params annotate quiver contour barh stackplot subplots_adjust axhline axvline semilogx semilogy loglog polar streamplot hexbin pcolor tricontour errorbar clabel set_aspect violinplot set_axis_off spines text hatch plt axis plt.bar() plt.axis import figure pyplot highlight_text pypalettes plt.subplots() xlabel ylabel title legend colorbar savefig tight_layout grid set_xlim set_ylim plot scatter hist boxplot imshow cmap alpha bins tick_params annotate quiver contour barh stackplot subplots_adjust axhline axvline semilogx semilogy loglog polar streamplot hexbin pcolor tricontour errorbar clabel set_aspect violinplot set_axis_off spines text hatch plt axis plt.bar() plt.axis import figure pyplot highlight_text pypalettes plt.subplots() xlabel ylabel title legend colorbar savefig tight_layout grid set_xlim set_ylim plot scatter hist boxplot imshow cmap alpha bins tick_params annotate quiver contour barh stackplot subplots_adjust axhline axvline semilogx semilogy loglog polar streamplot hexbin pcolor tricontour errorbar clabel set_aspect violinplot set_axis_off spines text hatch plt axis plt.bar() plt.axis import figure pyplot highlight_text pypalettes plt.subplots() xlabel ylabel title legend colorbar savefig tight_layout grid set_xlim set_ylim plot scatter hist boxplot imshow cmap alpha bins tick_params annotate quiver contour barh stackplot subplots_adjust axhline axvline semilogx semilogy loglog polar streamplot hexbin pcolor tricontour errorbar clabel set_aspect violinplot set_axis_off spines text hatch plt axis plt.bar() plt.axis import figure pyplot highlight_text pypalettes plt.subplots() xlabel ylabel title legend colorbar savefig tight_layout grid set_xlim set_ylim plot scatter hist boxplot imshow cmap alpha bins tick_params annotate quiver contour barh stackplot subplots_adjust axhline axvline semilogx semilogy loglog polar streamplot hexbin pcolor tricontour errorbar clabel set_aspect violinplot set_axis_off spines text hatch plt axis plt.bar() plt.axis import figure pyplot highlight_text pypalettes plt.subplots() xlabel ylabel title legend colorbar savefig tight_layout grid set_xlim set_ylim plot scatter hist boxplot imshow cmap alpha bins tick_params annotate quiver contour barh stackplot subplots_adjust axhline axvline semilogx semilogy loglog polar streamplot hexbin pcolor tricontour errorbar clabel set_aspect violinplot set_axis_off spines text hatch plt axis plt.bar() plt.axis import figure pyplot highlight_text pypalettes plt.subplots() xlabel ylabel title legend colorbar savefig tight_layout grid set_xlim set_ylim plot scatter hist boxplot imshow cmap alpha bins tick_params annotate quiver contour barh stackplot subplots_adjust axhline axvline semilogx semilogy loglog polar streamplot hexbin pcolor tricontour errorbar clabel set_aspect violinplot set_axis_off spines text hatch plt axis plt.bar() plt.axis import figure pyplot highlight_text pypalettes plt.subplots() xlabel ylabel title legend colorbar savefig tight_layout grid set_xlim set_ylim plot scatter hist boxplot imshow cmap alpha bins tick_params annotate quiver contour barh stackplot subplots_adjust axhline axvline semilogx semilogy loglog polar streamplot hexbin pcolor tricontour errorbar clabel set_aspect violinplot set_axis_off spines text hatch plt axis plt.bar() plt.axis import figure pyplot highlight_text pypalettes plt.subplots() xlabel ylabel title legend colorbar savefig tight_layout grid set_xlim set_ylim plot scatter hist boxplot imshow cmap alpha bins tick_params annotate quiver contour barh stackplot subplots_adjust axhline axvline semilogx semilogy loglog polar streamplot hexbin pcolor tricontour errorbar clabel set_aspect violinplot set_axis_off spines text hatch plt axis plt.bar() plt.axis import figure pyplot highlight_text pypalettes plt.subplots() xlabel ylabel title legend colorbar savefig tight_layout grid set_xlim set_ylim plot scatter hist boxplot imshow cmap alpha bins tick_params annotate quiver contour barh stackplot subplots_adjust axhline axvline semilogx semilogy loglog polar streamplot hexbin pcolor tricontour errorbar clabel set_aspect violinplot set_axis_off spines text hatch plt axis plt.bar() plt.axis import figure pyplot highlight_text pypalettes plt.subplots() xlabel ylabel title legend colorbar savefig tight_layout grid set_xlim set_ylim plot scatter hist boxplot imshow cmap alpha bins tick_params annotate quiver contour barh stackplot subplots_adjust axhline axvline semilogx semilogy loglog polar streamplot hexbin pcolor tricontour errorbar clabel set_aspect violinplot set_axis_off spines text hatch plt axis plt.bar() plt.axis import figure pyplot highlight_text pypalettes plt.subplots() xlabel ylabel title legend colorbar savefig tight_layout grid set_xlim set_ylim plot scatter hist boxplot imshow cmap alpha bins tick_params annotate quiver contour barh stackplot subplots_adjust axhline axvline semilogx semilogy loglog polar streamplot hexbin pcolor tricontour errorbar clabel set_aspect violinplot set_axis_off spines text hatch plt axis plt.bar() plt.axis import figure pyplot highlight_text pypalettes plt.subplots() xlabel ylabel title legend colorbar savefig tight_layout grid set_xlim set_ylim plot scatter hist boxplot imshow cmap alpha bins tick_params annotate quiver contour barh stackplot subplots_adjust axhline axvline semilogx semilogy loglog polar streamplot hexbin pcolor tricontour errorbar clabel set_aspect violinplot set_axis_off spines text hatch plt axis plt.bar() plt.axis import figure pyplot highlight_text pypalettes plt.subplots() xlabel ylabel title legend colorbar savefig tight_layout grid set_xlim set_ylim plot scatter hist boxplot imshow cmap alpha bins tick_params annotate quiver contour barh stackplot subplots_adjust axhline axvline semilogx semilogy loglog polar streamplot hexbin pcolor tricontour errorbar clabel set_aspect violinplot set_axis_off spines text hatch plt axis plt.bar() plt.axis import figure pyplot highlight_text pypalettes plt.subplots() xlabel ylabel title legend colorbar savefig tight_layout grid set_xlim set_ylim plot scatter hist boxplot imshow cmap alpha bins tick_params annotate quiver contour barh stackplot subplots_adjust axhline axvline semilogx semilogy loglog polar streamplot hexbin pcolor tricontour errorbar clabel set_aspect violinplot set_axis_off spines text hatch plt axis plt.bar() plt.axis import figure pyplot highlight_text pypalettes plt.subplots() xlabel ylabel title legend colorbar savefig tight_layout grid set_xlim set_ylim plot scatter hist boxplot imshow cmap alpha bins tick_params annotate quiver contour barh stackplot subplots_adjust axhline axvline semilogx semilogy loglog polar streamplot hexbin pcolor tricontour errorbar clabel set_aspect violinplot set_axis_off spines text hatch plt axis plt.bar() plt.axis import figure pyplot highlight_text pypalettes plt.subplots() xlabel ylabel title legend colorbar savefig tight_layout grid set_xlim set_ylim plot scatter hist boxplot imshow cmap alpha bins tick_params annotate quiver contour barh stackplot subplots_adjust axhline axvline semilogx semilogy loglog polar streamplot hexbin pcolor tricontour errorbar clabel set_aspect violinplot set_axis_off spines text hatch plt axis plt.bar() plt.axis import figure pyplot highlight_text pypalettes plt.subplots() xlabel ylabel title legend colorbar savefig tight_layout grid set_xlim set_ylim plot scatter hist boxplot imshow cmap alpha bins tick_params annotate quiver contour barh stackplot subplots_adjust axhline axvline semilogx semilogy loglog polar streamplot hexbin pcolor tricontour errorbar clabel set_aspect violinplot set_axis_off spines text hatch plt axis plt.bar() plt.axis import figure pyplot highlight_text pypalettes plt.subplots() xlabel ylabel title legend colorbar savefig tight_layout grid set_xlim set_ylim plot scatter hist boxplot imshow cmap alpha bins tick_params annotate quiver contour barh stackplot subplots_adjust axhline axvline semilogx semilogy loglog polar streamplot hexbin pcolor tricontour errorbar clabel set_aspect violinplot set_axis_off spines text hatch plt axis plt.bar() plt.axis import figure pyplot highlight_text pypalettes plt.subplots() xlabel ylabel title legend colorbar savefig tight_layout grid set_xlim set_ylim plot scatter hist boxplot imshow cmap alpha bins tick_params annotate quiver contour barh stackplot subplots_adjust axhline axvline semilogx semilogy loglog polar streamplot hexbin pcolor tricontour errorbar clabel set_aspect violinplot set_axis_off spines text hatch plt axis plt.bar() plt.axis import figure pyplot highlight_text pypalettes plt.subplots() xlabel ylabel title legend colorbar savefig tight_layout grid set_xlim set_ylim plot scatter hist boxplot imshow cmap alpha bins tick_params annotate quiver contour barh stackplot subplots_adjust axhline axvline semilogx semilogy loglog polar streamplot hexbin pcolor tricontour errorbar clabel set_aspect violinplot set_axis_off spines text hatch plt axis plt.bar() plt.axis import figure pyplot highlight_text pypalettes plt.subplots() xlabel ylabel title legend colorbar savefig tight_layout grid set_xlim set_ylim plot scatter hist boxplot imshow cmap alpha bins tick_params annotate quiver contour barh stackplot subplots_adjust axhline axvline semilogx semilogy loglog polar streamplot hexbin pcolor tricontour errorbar clabel set_aspect violinplot set_axis_off spines text hatch plt axis plt.bar() plt.axis import figure pyplot highlight_text pypalettes plt.subplots() xlabel ylabel title legend colorbar savefig tight_layout grid set_xlim set_ylim plot scatter hist boxplot imshow cmap alpha bins tick_params annotate quiver contour barh stackplot subplots_adjust axhline axvline semilogx semilogy loglog polar streamplot hexbin pcolor tricontour errorbar clabel set_aspect violinplot set_axis_off spines text hatch plt axis plt.bar() plt.axis import figure pyplot highlight_text pypalettes plt.subplots() xlabel ylabel title legend colorbar savefig tight_layout grid set_xlim set_ylim plot scatter hist boxplot imshow cmap alpha bins tick_params annotate quiver contour barh stackplot subplots_adjust axhline axvline semilogx semilogy loglog polar streamplot hexbin pcolor tricontour errorbar clabel set_aspect violinplot set_axis_off spines text hatch plt axis plt.bar() plt.axis import figure pyplot highlight_text pypalettes plt.subplots() xlabel ylabel title legend colorbar savefig tight_layout grid set_xlim set_ylim plot scatter hist boxplot imshow cmap alpha bins tick_params annotate quiver contour barh stackplot subplots_adjust axhline axvline semilogx semilogy loglog polar streamplot hexbin pcolor tricontour errorbar clabel set_aspect violinplot set_axis_off spines text hatch plt axis plt.bar() plt.axis import figure pyplot highlight_text pypalettes plt.subplots() xlabel ylabel title legend colorbar savefig tight_layout grid set_xlim set_ylim plot scatter hist boxplot imshow cmap alpha bins tick_params annotate quiver contour barh stackplot subplots_adjust axhline axvline semilogx semilogy loglog polar streamplot hexbin pcolor tricontour errorbar clabel set_aspect violinplot set_axis_off spines text hatch plt axis plt.bar() plt.axis import figure pyplot highlight_text pypalettes plt.subplots() xlabel ylabel title legend colorbar savefig tight_layout grid set_xlim set_ylim plot scatter hist boxplot imshow cmap alpha bins tick_params annotate quiver contour barh stackplot subplots_adjust axhline axvline semilogx semilogy loglog polar streamplot hexbin pcolor tricontour errorbar clabel set_aspect violinplot set_axis_off spines text hatch plt axis plt.bar() plt.axis import figure pyplot highlight_text pypalettes plt.subplots() xlabel ylabel title legend colorbar savefig tight_layout grid set_xlim set_ylim plot scatter hist boxplot imshow cmap alpha bins tick_params annotate quiver contour barh stackplot subplots_adjust axhline axvline semilogx semilogy loglog polar streamplot hexbin pcolor tricontour errorbar clabel set_aspect violinplot set_axis_off spines text hatch plt axis plt.bar() plt.axis import figure pyplot highlight_text pypalettes plt.subplots() xlabel ylabel title legend colorbar savefig tight_layout grid set_xlim set_ylim plot scatter hist boxplot imshow cmap alpha bins tick_params annotate quiver contour barh stackplot subplots_adjust axhline axvline semilogx semilogy loglog polar streamplot hexbin pcolor tricontour errorbar clabel set_aspect violinplot set_axis_off spines text hatch plt axis plt.bar() plt.axis import figure pyplot highlight_text pypalettes plt.subplots() xlabel ylabel title legend colorbar savefig tight_layout grid set_xlim set_ylim plot scatter hist boxplot imshow cmap alpha bins tick_params annotate quiver contour barh stackplot subplots_adjust axhline axvline semilogx semilogy loglog polar streamplot hexbin pcolor tricontour errorbar clabel set_aspect violinplot set_axis_off spines text hatch plt axis plt.bar() plt.axis import figure pyplot highlight_text pypalettes plt.subplots() xlabel ylabel title legend colorbar savefig tight_layout grid set_xlim set_ylim plot scatter hist boxplot imshow cmap alpha bins tick_params annotate quiver contour barh stackplot subplots_adjust axhline axvline semilogx semilogy loglog polar streamplot hexbin pcolor tricontour errorbar clabel set_aspect violinplot set_axis_off spines text hatch plt axis plt.bar() plt.axis import figure pyplot highlight_text pypalettes plt.subplots() xlabel ylabel title legend colorbar savefig tight_layout grid set_xlim set_ylim plot scatter hist boxplot imshow cmap alpha bins tick_params annotate quiver contour barh stackplot subplots_adjust axhline axvline semilogx semilogy loglog polar streamplot hexbin pcolor tricontour errorbar clabel set_aspect violinplot set_axis_off spines text hatch plt axis plt.bar() plt.axis import figure pyplot highlight_text pypalettes plt.subplots() xlabel ylabel title legend colorbar savefig tight_layout grid set_xlim set_ylim plot scatter hist boxplot imshow cmap alpha bins tick_params annotate quiver contour barh stackplot subplots_adjust axhline axvline semilogx semilogy loglog polar streamplot hexbin pcolor tricontour errorbar clabel set_aspect violinplot set_axis_off spines text hatch plt axis plt.bar() plt.axis import figure pyplot highlight_text pypalettes plt.subplots() xlabel ylabel title legend colorbar savefig tight_layout grid set_xlim set_ylim plot scatter hist boxplot imshow cmap alpha bins tick_params annotate quiver contour barh stackplot subplots_adjust axhline axvline semilogx semilogy loglog polar streamplot hexbin pcolor tricontour errorbar clabel set_aspect violinplot set_axis_off spines text hatch plt axis plt.bar() plt.axis import figure pyplot highlight_text pypalettes plt.subplots() xlabel ylabel title legend colorbar savefig tight_layout grid set_xlim set_ylim plot scatter hist boxplot imshow cmap alpha bins tick_params annotate quiver contour barh stackplot subplots_adjust axhline axvline semilogx semilogy loglog polar streamplot hexbin pcolor tricontour errorbar clabel set_aspect violinplot set_axis_off spines text hatch plt axis plt.bar() plt.axis import figure pyplot highlight_text pypalettes plt.subplots() xlabel ylabel title legend colorbar savefig tight_layout grid set_xlim set_ylim plot scatter hist boxplot imshow cmap alpha bins tick_params annotate quiver contour barh stackplot subplots_adjust axhline axvline semilogx semilogy loglog polar streamplot hexbin pcolor tricontour errorbar clabel set_aspect violinplot set_axis_off spines text hatch plt axis plt.bar() plt.axis import figure pyplot highlight_text pypalettes plt.subplots() xlabel ylabel title legend colorbar savefig tight_layout grid set_xlim set_ylim plot scatter hist boxplot imshow cmap alpha bins tick_params annotate quiver contour barh stackplot subplots_adjust axhline axvline semilogx semilogy loglog polar streamplot hexbin pcolor tricontour errorbar clabel set_aspect violinplot set_axis_off spines text hatch plt axis plt.bar() plt.axis import figure pyplot highlight_text pypalettes plt.subplots() xlabel ylabel title legend colorbar savefig tight_layout grid set_xlim set_ylim plot scatter hist boxplot imshow cmap alpha bins tick_params annotate quiver contour barh stackplot subplots_adjust axhline axvline semilogx semilogy loglog polar streamplot hexbin pcolor tricontour errorbar clabel set_aspect violinplot set_axis_off spines text hatch plt axis plt.bar() plt.axis import figure pyplot highlight_text pypalettes plt.subplots() xlabel ylabel title legend colorbar savefig tight_layout grid set_xlim set_ylim plot scatter hist boxplot imshow cmap alpha bins tick_params annotate quiver contour barh stackplot subplots_adjust axhline axvline semilogx semilogy loglog polar streamplot hexbin pcolor tricontour errorbar clabel set_aspect violinplot set_axis_off spines text hatch plt axis plt.bar() plt.axis import figure pyplot highlight_text pypalettes plt.subplots() xlabel ylabel title legend colorbar savefig tight_layout grid set_xlim set_ylim plot scatter hist boxplot imshow cmap alpha bins tick_params annotate quiver contour barh stackplot subplots_adjust axhline axvline semilogx semilogy loglog polar streamplot hexbin pcolor tricontour errorbar clabel set_aspect violinplot set_axis_off spines text hatch plt axis plt.bar() plt.axis import figure pyplot highlight_text pypalettes plt.subplots() xlabel ylabel title legend colorbar savefig tight_layout grid set_xlim set_ylim plot scatter hist boxplot imshow cmap alpha bins tick_params annotate quiver contour barh stackplot subplots_adjust axhline axvline semilogx semilogy loglog polar streamplot hexbin pcolor tricontour errorbar clabel set_aspect violinplot set_axis_off spines text hatch plt axis plt.bar() plt.axis import figure pyplot highlight_text pypalettes plt.subplots() xlabel ylabel title legend colorbar savefig tight_layout grid set_xlim set_ylim plot scatter hist boxplot imshow cmap alpha bins tick_params annotate quiver contour barh stackplot subplots_adjust axhline axvline semilogx semilogy loglog polar streamplot hexbin pcolor tricontour errorbar clabel set_aspect violinplot set_axis_off spines text hatch plt axis plt.bar() plt.axis import figure pyplot highlight_text pypalettes plt.subplots() xlabel ylabel title legend colorbar savefig tight_layout grid set_xlim set_ylim plot scatter hist boxplot imshow cmap alpha bins tick_params annotate quiver contour barh stackplot subplots_adjust axhline axvline semilogx semilogy loglog polar streamplot hexbin pcolor tricontour errorbar clabel set_aspect violinplot set_axis_off spines text hatch plt axis plt.bar() plt.axis import figure pyplot highlight_text pypalettes plt.subplots() xlabel ylabel title legend colorbar savefig tight_layout grid set_xlim set_ylim plot scatter hist boxplot imshow cmap alpha bins tick_params annotate quiver contour barh stackplot subplots_adjust axhline axvline semilogx semilogy loglog polar streamplot hexbin pcolor tricontour errorbar clabel set_aspect violinplot set_axis_off spines text hatch plt axis plt.bar() plt.axis import figure pyplot highlight_text pypalettes plt.subplots() xlabel ylabel title legend colorbar savefig tight_layout grid set_xlim set_ylim plot scatter hist boxplot imshow cmap alpha bins tick_params annotate quiver contour barh stackplot subplots_adjust axhline axvline semilogx semilogy loglog polar streamplot hexbin pcolor tricontour errorbar clabel set_aspect violinplot set_axis_off spines text hatch plt axis plt.bar() plt.axis import figure pyplot highlight_text pypalettes plt.subplots() xlabel ylabel title legend colorbar savefig tight_layout grid set_xlim set_ylim plot scatter hist boxplot imshow cmap alpha bins tick_params annotate quiver contour barh stackplot subplots_adjust axhline axvline semilogx semilogy loglog polar streamplot hexbin pcolor tricontour errorbar clabel set_aspect violinplot set_axis_off spines text hatch plt axis plt.bar() plt.axis import figure pyplot highlight_text pypalettes plt.subplots() xlabel ylabel title legend colorbar savefig tight_layout grid set_xlim set_ylim plot scatter hist boxplot imshow cmap alpha bins tick_params annotate quiver contour barh stackplot subplots_adjust axhline axvline semilogx semilogy loglog polar streamplot hexbin pcolor tricontour errorbar clabel set_aspect violinplot set_axis_off spines text hatch plt axis plt.bar() plt.axis import figure pyplot highlight_text pypalettes plt.subplots() xlabel ylabel title legend colorbar savefig tight_layout grid set_xlim set_ylim plot scatter hist boxplot imshow cmap alpha bins tick_params annotate quiver contour barh stackplot subplots_adjust axhline axvline semilogx semilogy loglog polar streamplot hexbin pcolor tricontour errorbar clabel set_aspect violinplot set_axis_off spines text hatch plt axis plt.bar() plt.axis import figure pyplot highlight_text pypalettes plt.subplots() xlabel ylabel title legend colorbar savefig tight_layout grid set_xlim set_ylim plot scatter hist boxplot imshow cmap alpha bins tick_params annotate quiver contour barh stackplot subplots_adjust axhline axvline semilogx semilogy loglog polar streamplot hexbin pcolor tricontour errorbar clabel set_aspect violinplot set_axis_off spines text hatch plt axis plt.bar() plt.axis import figure pyplot highlight_text pypalettes plt.subplots() xlabel ylabel title legend colorbar savefig tight_layout grid set_xlim set_ylim plot scatter hist boxplot imshow cmap alpha bins tick_params annotate quiver contour barh stackplot subplots_adjust axhline axvline semilogx semilogy loglog polar streamplot hexbin pcolor tricontour errorbar clabel set_aspect violinplot set_axis_off spines text hatch plt axis plt.bar() plt.axis import figure pyplot highlight_text pypalettes plt.subplots() xlabel ylabel title legend colorbar savefig tight_layout grid set_xlim set_ylim plot scatter hist boxplot imshow cmap alpha bins tick_params annotate quiver contour barh stackplot subplots_adjust axhline axvline semilogx semilogy loglog polar streamplot hexbin pcolor tricontour errorbar clabel set_aspect violinplot set_axis_off spines text hatch plt axis plt.bar() plt.axis import figure pyplot highlight_text pypalettes plt.subplots() xlabel ylabel title legend colorbar savefig tight_layout grid set_xlim set_ylim plot scatter hist boxplot imshow cmap alpha bins tick_params annotate quiver contour barh stackplot subplots_adjust axhline axvline semilogx semilogy loglog polar streamplot hexbin pcolor tricontour errorbar clabel set_aspect violinplot set_axis_off spines text hatch plt axis plt.bar() plt.axis import figure pyplot highlight_text pypalettes plt.subplots() xlabel ylabel title legend colorbar savefig tight_layout grid set_xlim set_ylim plot scatter hist boxplot imshow cmap alpha bins tick_params annotate quiver contour barh stackplot subplots_adjust axhline axvline semilogx semilogy loglog polar streamplot hexbin pcolor tricontour errorbar clabel set_aspect violinplot set_axis_off spines text hatch plt axis plt.bar() plt.axis import figure pyplot highlight_text pypalettes plt.subplots() xlabel ylabel title legend colorbar savefig tight_layout grid set_xlim set_ylim plot scatter hist boxplot imshow cmap alpha bins tick_params annotate quiver contour barh stackplot subplots_adjust axhline axvline semilogx semilogy loglog polar streamplot hexbin pcolor tricontour errorbar clabel set_aspect violinplot set_axis_off spines text hatch plt axis plt.bar() plt.axis import figure pyplot highlight_text pypalettes plt.subplots() xlabel ylabel title legend colorbar savefig tight_layout grid set_xlim set_ylim plot scatter hist boxplot imshow cmap alpha bins tick_params annotate quiver contour barh stackplot subplots_adjust axhline axvline semilogx semilogy loglog polar streamplot hexbin pcolor tricontour errorbar clabel set_aspect violinplot set_axis_off spines text hatch plt axis plt.bar() plt.axis import figure pyplot highlight_text pypalettes plt.subplots() xlabel ylabel title legend colorbar savefig tight_layout grid set_xlim set_ylim plot scatter hist boxplot imshow cmap alpha bins tick_params annotate quiver contour barh stackplot subplots_adjust axhline axvline semilogx semilogy loglog polar streamplot hexbin pcolor tricontour errorbar clabel set_aspect violinplot set_axis_off spines text hatch plt axis plt.bar() plt.axis import figure pyplot highlight_text pypalettes plt.subplots() xlabel ylabel title legend colorbar savefig tight_layout grid set_xlim set_ylim plot scatter hist boxplot imshow cmap alpha bins tick_params annotate quiver contour barh stackplot subplots_adjust axhline axvline semilogx semilogy loglog polar streamplot hexbin pcolor tricontour errorbar clabel set_aspect violinplot set_axis_off spines text hatch plt axis plt.bar() plt.axis import figure pyplot highlight_text pypalettes plt.subplots() xlabel ylabel title legend colorbar savefig tight_layout grid set_xlim set_ylim plot scatter hist boxplot imshow cmap alpha bins tick_params annotate quiver contour barh stackplot subplots_adjust axhline axvline semilogx semilogy loglog polar streamplot hexbin pcolor tricontour errorbar clabel set_aspect violinplot set_axis_off spines text hatch plt axis plt.bar() plt.axis import figure pyplot highlight_text pypalettes plt.subplots() xlabel ylabel title legend colorbar savefig tight_layout grid set_xlim set_ylim plot scatter hist boxplot imshow cmap alpha bins tick_params annotate quiver contour barh stackplot subplots_adjust axhline axvline semilogx semilogy loglog polar streamplot hexbin pcolor tricontour errorbar clabel set_aspect violinplot set_axis_off spines text hatch plt axis plt.bar() plt.axis import figure pyplot highlight_text pypalettes plt.subplots() xlabel ylabel title legend colorbar savefig tight_layout grid set_xlim set_ylim plot scatter hist boxplot imshow cmap alpha bins tick_params annotate quiver contour barh stackplot subplots_adjust axhline axvline semilogx semilogy loglog polar streamplot hexbin pcolor tricontour errorbar clabel set_aspect violinplot set_axis_off spines text hatch plt axis plt.bar() plt.axis import figure pyplot highlight_text pypalettes plt.subplots() xlabel ylabel title legend colorbar savefig tight_layout grid set_xlim set_ylim plot scatter hist boxplot imshow cmap alpha bins tick_params annotate quiver contour barh stackplot subplots_adjust axhline axvline semilogx semilogy loglog polar streamplot hexbin pcolor tricontour errorbar clabel set_aspect violinplot set_axis_off spines text hatch plt axis plt.bar() plt.axis import figure pyplot highlight_text pypalettes plt.subplots() xlabel ylabel title legend colorbar savefig tight_layout grid set_xlim set_ylim plot scatter hist boxplot imshow cmap alpha bins tick_params annotate quiver contour barh stackplot subplots_adjust axhline axvline semilogx semilogy loglog polar streamplot hexbin pcolor tricontour errorbar clabel set_aspect violinplot set_axis_off spines text hatch plt axis plt.bar() plt.axis import figure pyplot highlight_text pypalettes plt.subplots() xlabel ylabel title legend colorbar savefig tight_layout grid set_xlim set_ylim plot scatter hist boxplot imshow cmap alpha bins tick_params annotate quiver contour barh stackplot subplots_adjust axhline axvline semilogx semilogy loglog polar streamplot hexbin pcolor tricontour errorbar clabel set_aspect violinplot set_axis_off spines text hatch plt axis plt.bar() plt.axis import figure pyplot highlight_text pypalettes plt.subplots() xlabel ylabel title legend colorbar savefig tight_layout grid set_xlim set_ylim plot scatter hist boxplot imshow cmap alpha bins tick_params annotate quiver contour barh stackplot subplots_adjust axhline axvline semilogx semilogy loglog polar streamplot hexbin pcolor tricontour errorbar clabel set_aspect violinplot set_axis_off spines text hatch plt axis plt.bar() plt.axis import figure pyplot highlight_text pypalettes plt.subplots() xlabel ylabel title legend colorbar savefig tight_layout grid set_xlim set_ylim plot scatter hist boxplot imshow cmap alpha bins tick_params annotate quiver contour barh stackplot subplots_adjust axhline axvline semilogx semilogy loglog polar streamplot hexbin pcolor tricontour errorbar clabel set_aspect violinplot set_axis_off spines text hatch plt axis plt.bar() plt.axis import figure pyplot highlight_text pypalettes plt.subplots() xlabel ylabel title legend colorbar savefig tight_layout grid set_xlim set_ylim plot scatter hist boxplot imshow cmap alpha bins tick_params annotate quiver contour barh stackplot subplots_adjust axhline axvline semilogx semilogy loglog polar streamplot hexbin pcolor tricontour errorbar clabel set_aspect violinplot set_axis_off spines text hatch plt axis plt.bar() plt.axis import figure pyplot highlight_text pypalettes plt.subplots() xlabel ylabel title legend colorbar savefig tight_layout grid set_xlim set_ylim plot scatter hist boxplot imshow cmap alpha bins tick_params annotate quiver contour barh stackplot subplots_adjust axhline axvline semilogx semilogy loglog polar streamplot hexbin pcolor tricontour errorbar clabel set_aspect violinplot set_axis_off spines text hatch plt axis plt.bar() plt.axis import figure pyplot highlight_text pypalettes plt.subplots() xlabel ylabel title legend colorbar savefig tight_layout grid set_xlim set_ylim plot scatter hist boxplot imshow cmap alpha bins tick_params annotate quiver contour barh stackplot subplots_adjust axhline axvline semilogx semilogy loglog polar streamplot hexbin pcolor tricontour errorbar clabel set_aspect violinplot set_axis_off spines text hatch plt axis plt.bar() plt.axis import figure pyplot highlight_text pypalettes plt.subplots() xlabel ylabel title legend colorbar savefig tight_layout grid set_xlim set_ylim plot scatter hist boxplot imshow cmap alpha bins tick_params annotate quiver contour barh stackplot subplots_adjust axhline axvline semilogx semilogy loglog polar streamplot hexbin pcolor tricontour errorbar clabel set_aspect violinplot set_axis_off spines text hatch plt axis plt.bar() plt.axis import figure pyplot highlight_text pypalettes plt.subplots() xlabel ylabel title legend colorbar savefig tight_layout grid set_xlim set_ylim plot scatter hist boxplot imshow cmap alpha bins tick_params annotate quiver contour barh stackplot subplots_adjust axhline axvline semilogx semilogy loglog polar streamplot hexbin pcolor tricontour errorbar clabel set_aspect violinplot set_axis_off spines text hatch plt axis plt.bar() plt.axis import figure pyplot highlight_text pypalettes plt.subplots() xlabel ylabel title legend colorbar savefig tight_layout grid set_xlim set_ylim plot scatter hist boxplot imshow cmap alpha bins tick_params annotate quiver contour barh stackplot subplots_adjust axhline axvline semilogx semilogy loglog polar streamplot hexbin pcolor tricontour errorbar clabel set_aspect violinplot set_axis_off spines text hatch plt axis plt.bar() plt.axis import figure pyplot highlight_text pypalettes plt.subplots() xlabel ylabel title legend colorbar savefig tight_layout grid set_xlim set_ylim plot scatter hist boxplot imshow cmap alpha bins tick_params annotate quiver contour barh stackplot subplots_adjust axhline axvline semilogx semilogy loglog polar streamplot hexbin pcolor tricontour errorbar clabel set_aspect violinplot set_axis_off spines text hatch plt axis plt.bar() plt.axis import figure pyplot highlight_text pypalettes plt.subplots() xlabel ylabel title legend colorbar savefig tight_layout grid set_xlim set_ylim plot scatter hist boxplot imshow cmap alpha bins tick_params annotate quiver contour barh stackplot subplots_adjust axhline axvline semilogx semilogy loglog polar streamplot hexbin pcolor tricontour errorbar clabel set_aspect violinplot set_axis_off spines text hatch plt axis plt.bar() plt.axis import figure pyplot highlight_text pypalettes plt.subplots() xlabel ylabel title legend colorbar savefig tight_layout grid set_xlim set_ylim plot scatter hist boxplot imshow cmap alpha bins tick_params annotate quiver contour barh stackplot subplots_adjust axhline axvline semilogx semilogy loglog polar streamplot hexbin pcolor tricontour errorbar clabel set_aspect violinplot set_axis_off spines text hatch plt axis plt.bar() plt.axis import figure pyplot highlight_text pypalettes plt.subplots() xlabel ylabel title legend colorbar savefig tight_layout grid set_xlim set_ylim plot scatter hist boxplot imshow cmap alpha bins tick_params annotate quiver contour barh stackplot subplots_adjust axhline axvline semilogx semilogy loglog polar streamplot hexbin pcolor tricontour errorbar clabel set_aspect violinplot set_axis_off spines text hatch plt axis plt.bar() plt.axis import figure pyplot highlight_text pypalettes plt.subplots() xlabel ylabel title legend colorbar savefig tight_layout grid set_xlim set_ylim plot scatter hist boxplot imshow cmap alpha bins tick_params annotate quiver contour barh stackplot subplots_adjust axhline axvline semilogx semilogy loglog polar streamplot hexbin pcolor tricontour errorbar clabel set_aspect violinplot set_axis_off spines text hatch plt axis plt.bar() plt.axis import figure pyplot highlight_text pypalettes plt.subplots() xlabel ylabel title legend colorbar savefig tight_layout grid set_xlim set_ylim plot scatter hist boxplot imshow cmap alpha bins tick_params annotate quiver contour barh stackplot subplots_adjust axhline axvline semilogx semilogy loglog polar streamplot hexbin pcolor tricontour errorbar clabel set_aspect violinplot set_axis_off spines text hatch plt axis plt.bar() plt.axis import figure pyplot highlight_text pypalettes plt.subplots() xlabel ylabel title legend colorbar savefig tight_layout grid set_xlim set_ylim plot scatter hist boxplot imshow cmap alpha bins tick_params annotate quiver contour barh stackplot subplots_adjust axhline axvline semilogx semilogy loglog polar streamplot hexbin pcolor tricontour errorbar clabel set_aspect violinplot set_axis_off spines text hatch plt axis plt.bar() plt.axis import figure pyplot highlight_text pypalettes plt.subplots() xlabel ylabel title legend colorbar savefig tight_layout grid set_xlim set_ylim plot scatter hist boxplot imshow cmap alpha bins tick_params annotate quiver contour barh stackplot subplots_adjust axhline axvline semilogx semilogy loglog polar streamplot hexbin pcolor tricontour errorbar clabel set_aspect violinplot set_axis_off spines text hatch plt axis plt.bar() plt.axis import figure pyplot highlight_text pypalettes plt.subplots() xlabel ylabel title legend colorbar savefig tight_layout grid set_xlim set_ylim plot scatter hist boxplot imshow cmap alpha bins tick_params annotate quiver contour barh stackplot subplots_adjust axhline axvline semilogx semilogy loglog polar streamplot hexbin pcolor tricontour errorbar clabel set_aspect violinplot set_axis_off spines text hatch plt axis plt.bar() plt.axis import figure pyplot highlight_text pypalettes plt.subplots() xlabel ylabel title legend colorbar savefig tight_layout grid set_xlim set_ylim plot scatter hist boxplot imshow cmap alpha bins tick_params annotate quiver contour barh stackplot subplots_adjust axhline axvline semilogx semilogy loglog polar streamplot hexbin pcolor tricontour errorbar clabel set_aspect violinplot set_axis_off spines text hatch plt axis plt.bar() plt.axis import figure pyplot highlight_text pypalettes plt.subplots() xlabel ylabel title legend colorbar savefig tight_layout grid set_xlim set_ylim plot scatter hist boxplot imshow cmap alpha bins tick_params annotate quiver contour barh stackplot subplots_adjust axhline axvline semilogx semilogy loglog polar streamplot hexbin pcolor tricontour errorbar clabel set_aspect violinplot set_axis_off spines text hatch plt axis plt.bar() plt.axis import figure pyplot highlight_text pypalettes plt.subplots() xlabel ylabel title legend colorbar savefig tight_layout grid set_xlim set_ylim plot scatter hist boxplot imshow cmap alpha bins tick_params annotate quiver contour barh stackplot subplots_adjust axhline axvline semilogx semilogy loglog polar streamplot hexbin pcolor tricontour errorbar clabel set_aspect violinplot set_axis_off spines text hatch plt axis plt.bar() plt.axis import figure pyplot highlight_text pypalettes plt.subplots() xlabel ylabel title legend colorbar savefig tight_layout grid set_xlim set_ylim plot scatter hist boxplot imshow cmap alpha bins tick_params annotate quiver contour barh stackplot subplots_adjust axhline axvline semilogx semilogy loglog polar streamplot hexbin pcolor tricontour errorbar clabel set_aspect violinplot set_axis_off spines text hatch plt axis plt.bar() plt.axis import figure pyplot highlight_text pypalettes plt.subplots() xlabel ylabel title legend colorbar savefig tight_layout grid set_xlim set_ylim plot scatter hist boxplot imshow cmap alpha bins tick_params annotate quiver contour barh stackplot subplots_adjust axhline axvline semilogx semilogy loglog polar streamplot hexbin pcolor tricontour errorbar clabel set_aspect violinplot set_axis_off spines text hatch plt axis plt.bar() plt.axis import figure pyplot highlight_text pypalettes plt.subplots() xlabel ylabel title legend colorbar savefig tight_layout grid set_xlim set_ylim plot scatter hist boxplot imshow cmap alpha bins tick_params annotate quiver contour barh stackplot subplots_adjust axhline axvline semilogx semilogy loglog polar streamplot hexbin pcolor tricontour errorbar clabel set_aspect violinplot set_axis_off spines text hatch plt axis plt.bar() plt.axis import figure pyplot highlight_text pypalettes plt.subplots() xlabel ylabel title legend colorbar savefig tight_layout grid set_xlim set_ylim plot scatter hist boxplot imshow cmap alpha bins tick_params annotate quiver contour barh stackplot subplots_adjust axhline axvline semilogx semilogy loglog polar streamplot hexbin pcolor tricontour errorbar clabel set_aspect violinplot set_axis_off spines text hatch plt axis plt.bar() plt.axis import figure pyplot highlight_text pypalettes plt.subplots() xlabel ylabel title legend colorbar savefig tight_layout grid set_xlim set_ylim plot scatter hist boxplot imshow cmap alpha bins tick_params annotate quiver contour barh stackplot subplots_adjust axhline axvline semilogx semilogy loglog polar streamplot hexbin pcolor tricontour errorbar clabel set_aspect violinplot set_axis_off spines text hatch plt axis plt.bar() plt.axis import figure pyplot highlight_text pypalettes plt.subplots() xlabel ylabel title legend colorbar savefig tight_layout grid set_xlim set_ylim plot scatter hist boxplot imshow cmap alpha bins tick_params annotate quiver contour barh stackplot subplots_adjust axhline axvline semilogx semilogy loglog polar streamplot hexbin pcolor tricontour errorbar clabel set_aspect violinplot set_axis_off spines text hatch plt axis plt.bar() plt.axis import figure pyplot highlight_text pypalettes plt.subplots() xlabel ylabel title legend colorbar savefig tight_layout grid set_xlim set_ylim plot scatter hist boxplot imshow cmap alpha bins tick_params annotate quiver contour barh stackplot subplots_adjust axhline axvline semilogx semilogy loglog polar streamplot hexbin pcolor tricontour errorbar clabel set_aspect violinplot set_axis_off spines text hatch plt axis plt.bar() plt.axis import figure pyplot highlight_text pypalettes plt.subplots() xlabel ylabel title legend colorbar savefig tight_layout grid set_xlim set_ylim plot scatter hist boxplot imshow cmap alpha bins tick_params annotate quiver contour barh stackplot subplots_adjust axhline axvline semilogx semilogy loglog polar streamplot hexbin pcolor tricontour errorbar clabel set_aspect violinplot set_axis_off spines text hatch plt axis plt.bar() plt.axis import figure pyplot highlight_text pypalettes plt.subplots() xlabel ylabel title legend colorbar savefig tight_layout grid set_xlim set_ylim plot scatter hist boxplot imshow cmap alpha bins tick_params annotate quiver contour barh stackplot subplots_adjust axhline axvline semilogx semilogy loglog polar streamplot hexbin pcolor tricontour errorbar clabel set_aspect violinplot set_axis_off spines text hatch plt axis plt.bar() plt.axis import figure pyplot highlight_text pypalettes plt.subplots() xlabel ylabel title legend colorbar savefig tight_layout grid set_xlim set_ylim plot scatter hist boxplot imshow cmap alpha bins tick_params annotate quiver contour barh stackplot subplots_adjust axhline axvline semilogx semilogy loglog polar streamplot hexbin pcolor tricontour errorbar clabel set_aspect violinplot set_axis_off spines text hatch plt axis plt.bar() plt.axis import figure pyplot highlight_text pypalettes plt.subplots() xlabel ylabel title legend colorbar savefig tight_layout grid set_xlim set_ylim plot scatter hist boxplot imshow cmap alpha bins tick_params annotate quiver contour barh stackplot subplots_adjust axhline axvline semilogx semilogy loglog polar streamplot hexbin pcolor tricontour errorbar clabel set_aspect violinplot set_axis_off spines text hatch plt axis plt.bar() plt.axis import figure pyplot highlight_text pypalettes plt.subplots() xlabel ylabel title legend colorbar savefig tight_layout grid set_xlim set_ylim plot scatter hist boxplot imshow cmap alpha bins tick_params annotate quiver contour barh stackplot subplots_adjust axhline axvline semilogx semilogy loglog polar streamplot hexbin pcolor tricontour errorbar clabel set_aspect violinplot set_axis_off spines text hatch plt axis plt.bar() plt.axis import figure pyplot highlight_text pypalettes plt.subplots() xlabel ylabel title legend colorbar savefig tight_layout grid set_xlim set_ylim plot scatter hist boxplot imshow cmap alpha bins tick_params annotate quiver contour barh stackplot subplots_adjust axhline axvline semilogx semilogy loglog polar streamplot hexbin pcolor tricontour errorbar clabel set_aspect violinplot set_axis_off spines text hatch plt axis plt.bar() plt.axis import figure pyplot highlight_text pypalettes plt.subplots() xlabel ylabel title legend colorbar savefig tight_layout grid set_xlim set_ylim plot scatter hist boxplot imshow cmap alpha bins tick_params annotate quiver contour barh stackplot subplots_adjust axhline axvline semilogx semilogy loglog polar streamplot hexbin pcolor tricontour errorbar clabel set_aspect violinplot set_axis_off spines text hatch plt axis plt.bar() plt.axis import figure pyplot highlight_text pypalettes plt.subplots() xlabel ylabel title legend colorbar savefig tight_layout grid set_xlim set_ylim plot scatter hist boxplot imshow cmap alpha bins tick_params annotate quiver contour barh stackplot subplots_adjust axhline axvline semilogx semilogy loglog polar streamplot hexbin pcolor tricontour errorbar clabel set_aspect violinplot set_axis_off spines text hatch plt axis plt.bar() plt.axis import figure pyplot highlight_text pypalettes plt.subplots() xlabel ylabel title legend colorbar savefig tight_layout grid set_xlim set_ylim plot scatter hist boxplot imshow cmap alpha bins tick_params annotate quiver contour barh stackplot subplots_adjust axhline axvline semilogx semilogy loglog polar streamplot hexbin pcolor tricontour errorbar clabel set_aspect violinplot set_axis_off spines text hatch plt axis plt.bar() plt.axis import figure pyplot highlight_text pypalettes plt.subplots() xlabel ylabel title legend colorbar savefig tight_layout grid set_xlim set_ylim plot scatter hist boxplot imshow cmap alpha bins tick_params annotate quiver contour barh stackplot subplots_adjust axhline axvline semilogx semilogy loglog polar streamplot hexbin pcolor tricontour errorbar clabel set_aspect violinplot set_axis_off spines text hatch plt axis plt.bar() plt.axis import figure pyplot highlight_text pypalettes plt.subplots() xlabel ylabel title legend colorbar savefig tight_layout grid set_xlim set_ylim plot scatter hist boxplot imshow cmap alpha bins tick_params annotate quiver contour barh stackplot subplots_adjust axhline axvline semilogx semilogy loglog polar streamplot hexbin pcolor tricontour errorbar clabel set_aspect violinplot set_axis_off spines text hatch plt axis plt.bar() plt.axis import figure pyplot highlight_text pypalettes plt.subplots() xlabel ylabel title legend colorbar savefig tight_layout grid set_xlim set_ylim plot scatter hist boxplot imshow cmap alpha bins tick_params annotate quiver contour barh stackplot subplots_adjust axhline axvline semilogx semilogy loglog polar streamplot hexbin pcolor tricontour errorbar clabel set_aspect violinplot set_axis_off spines text hatch plt axis plt.bar() plt.axis import figure pyplot highlight_text pypalettes plt.subplots() xlabel ylabel title legend colorbar savefig tight_layout grid set_xlim set_ylim plot scatter hist boxplot imshow cmap alpha bins tick_params annotate quiver contour barh stackplot subplots_adjust axhline axvline semilogx semilogy loglog polar streamplot hexbin pcolor tricontour errorbar clabel set_aspect violinplot set_axis_off spines text hatch plt axis plt.bar() plt.axis import figure pyplot highlight_text pypalettes plt.subplots() xlabel ylabel title legend colorbar savefig tight_layout grid set_xlim set_ylim plot scatter hist boxplot imshow cmap alpha bins tick_params annotate quiver contour barh stackplot subplots_adjust axhline axvline semilogx semilogy loglog polar streamplot hexbin pcolor tricontour errorbar clabel set_aspect violinplot set_axis_off spines text hatch plt axis plt.bar() plt.axis import figure pyplot highlight_text pypalettes plt.subplots() xlabel ylabel title legend colorbar savefig tight_layout grid set_xlim set_ylim plot scatter hist boxplot imshow cmap alpha bins tick_params annotate quiver contour barh stackplot subplots_adjust axhline axvline semilogx semilogy loglog polar streamplot hexbin pcolor tricontour errorbar clabel set_aspect violinplot set_axis_off spines text hatch plt axis plt.bar() plt.axis import figure pyplot highlight_text pypalettes plt.subplots() xlabel ylabel title legend colorbar savefig tight_layout grid set_xlim set_ylim plot scatter hist boxplot imshow cmap alpha bins tick_params annotate quiver contour barh stackplot subplots_adjust axhline axvline semilogx semilogy loglog polar streamplot hexbin pcolor tricontour errorbar clabel set_aspect violinplot set_axis_off spines text hatch plt axis plt.bar() plt.axis import figure pyplot highlight_text pypalettes plt.subplots() xlabel ylabel title legend colorbar savefig tight_layout grid set_xlim set_ylim plot scatter hist boxplot imshow cmap alpha bins tick_params annotate quiver contour barh stackplot subplots_adjust axhline axvline semilogx semilogy loglog polar streamplot hexbin pcolor tricontour errorbar clabel set_aspect violinplot set_axis_off spines text hatch plt axis plt.bar() plt.axis import figure pyplot highlight_text pypalettes plt.subplots() xlabel ylabel title legend colorbar savefig tight_layout grid set_xlim set_ylim plot scatter hist boxplot imshow cmap alpha bins tick_params annotate quiver contour barh stackplot subplots_adjust axhline axvline semilogx semilogy loglog polar streamplot hexbin pcolor tricontour errorbar clabel set_aspect violinplot set_axis_off spines text hatch plt axis plt.bar() plt.axis import figure pyplot highlight_text pypalettes plt.subplots() xlabel ylabel title legend colorbar savefig tight_layout grid set_xlim set_ylim plot scatter hist boxplot imshow cmap alpha bins tick_params annotate quiver contour barh stackplot subplots_adjust axhline axvline semilogx semilogy loglog polar streamplot hexbin pcolor tricontour errorbar clabel set_aspect violinplot set_axis_off spines text hatch plt axis plt.bar() plt.axis import figure pyplot highlight_text pypalettes plt.subplots() xlabel ylabel title legend colorbar savefig tight_layout grid set_xlim set_ylim plot scatter hist boxplot imshow cmap alpha bins tick_params annotate quiver contour barh stackplot subplots_adjust axhline axvline semilogx semilogy loglog polar streamplot hexbin pcolor tricontour errorbar clabel set_aspect violinplot set_axis_off spines text hatch plt axis plt.bar() plt.axis import figure pyplot highlight_text pypalettes plt.subplots() xlabel ylabel title legend colorbar savefig tight_layout grid set_xlim set_ylim plot scatter hist boxplot imshow cmap alpha bins tick_params annotate quiver contour barh stackplot subplots_adjust axhline axvline semilogx semilogy loglog polar streamplot hexbin pcolor tricontour errorbar clabel set_aspect violinplot set_axis_off spines text hatch plt axis plt.bar() plt.axis import figure pyplot highlight_text pypalettes plt.subplots() xlabel ylabel title legend colorbar savefig tight_layout grid set_xlim set_ylim plot scatter hist boxplot imshow cmap alpha bins tick_params annotate quiver contour barh stackplot subplots_adjust axhline axvline semilogx semilogy loglog polar streamplot hexbin pcolor tricontour errorbar clabel set_aspect violinplot set_axis_off spines text hatch plt axis plt.bar() plt.axis import figure pyplot highlight_text pypalettes plt.subplots() xlabel ylabel title legend colorbar savefig tight_layout grid set_xlim set_ylim plot scatter hist boxplot imshow cmap alpha bins tick_params annotate quiver contour barh stackplot subplots_adjust axhline axvline semilogx semilogy loglog polar streamplot hexbin pcolor tricontour errorbar clabel set_aspect violinplot set_axis_off spines text hatch plt axis plt.bar() plt.axis import figure pyplot highlight_text pypalettes plt.subplots() xlabel ylabel title legend colorbar savefig tight_layout grid set_xlim set_ylim plot scatter hist boxplot imshow cmap alpha bins tick_params annotate quiver contour barh stackplot subplots_adjust axhline axvline semilogx semilogy loglog polar streamplot hexbin pcolor tricontour errorbar clabel set_aspect violinplot set_axis_off spines text hatch plt axis plt.bar() plt.axis import figure pyplot highlight_text pypalettes plt.subplots() xlabel ylabel title legend colorbar savefig tight_layout grid set_xlim set_ylim plot scatter hist boxplot imshow cmap alpha bins tick_params annotate quiver contour barh stackplot subplots_adjust axhline axvline semilogx semilogy loglog polar streamplot hexbin pcolor tricontour errorbar clabel set_aspect violinplot set_axis_off spines text hatch plt axis plt.bar() plt.axis import figure pyplot highlight_text pypalettes plt.subplots() xlabel ylabel title legend colorbar savefig tight_layout grid set_xlim set_ylim plot scatter hist boxplot imshow cmap alpha bins tick_params annotate quiver contour barh stackplot subplots_adjust axhline axvline semilogx semilogy loglog polar streamplot hexbin pcolor tricontour errorbar clabel set_aspect violinplot set_axis_off spines text hatch plt axis plt.bar() plt.axis import figure pyplot highlight_text pypalettes plt.subplots() xlabel ylabel title legend colorbar savefig tight_layout grid set_xlim set_ylim plot scatter hist boxplot imshow cmap alpha bins tick_params annotate quiver contour barh stackplot subplots_adjust axhline axvline semilogx semilogy loglog polar streamplot hexbin pcolor tricontour errorbar clabel set_aspect violinplot set_axis_off spines text hatch plt axis plt.bar() plt.axis import figure pyplot highlight_text pypalettes plt.subplots() xlabel ylabel title legend colorbar savefig tight_layout grid set_xlim set_ylim plot scatter hist boxplot imshow cmap alpha bins tick_params annotate quiver contour barh stackplot subplots_adjust axhline axvline semilogx semilogy loglog polar streamplot hexbin pcolor tricontour errorbar clabel set_aspect violinplot set_axis_off spines text hatch plt axis plt.bar() plt.axis import figure pyplot highlight_text pypalettes plt.subplots() xlabel ylabel title legend colorbar savefig tight_layout grid set_xlim set_ylim plot scatter hist boxplot imshow cmap alpha bins tick_params annotate quiver contour barh stackplot subplots_adjust axhline axvline semilogx semilogy loglog polar streamplot hexbin pcolor tricontour errorbar clabel set_aspect violinplot set_axis_off spines text hatch plt axis plt.bar() plt.axis import figure pyplot highlight_text pypalettes plt.subplots() xlabel ylabel title legend colorbar savefig tight_layout grid set_xlim set_ylim plot scatter hist boxplot imshow cmap alpha bins tick_params annotate quiver contour barh stackplot subplots_adjust axhline axvline semilogx semilogy loglog polar streamplot hexbin pcolor tricontour errorbar clabel set_aspect violinplot set_axis_off spines text hatch plt axis plt.bar() plt.axis import figure pyplot highlight_text pypalettes plt.subplots() xlabel ylabel title legend colorbar savefig tight_layout grid set_xlim set_ylim plot scatter hist boxplot imshow cmap alpha bins tick_params annotate quiver contour barh stackplot subplots_adjust axhline axvline semilogx semilogy loglog polar streamplot hexbin pcolor tricontour errorbar clabel set_aspect violinplot set_axis_off spines text hatch plt axis plt.bar() plt.axis import figure pyplot highlight_text pypalettes plt.subplots() xlabel ylabel title legend colorbar savefig tight_layout grid set_xlim set_ylim plot scatter hist boxplot imshow cmap alpha bins tick_params annotate quiver contour barh stackplot subplots_adjust axhline axvline semilogx semilogy loglog polar streamplot hexbin pcolor tricontour errorbar clabel set_aspect violinplot set_axis_off spines text hatch plt axis plt.bar() plt.axis import figure pyplot highlight_text pypalettes plt.subplots() xlabel ylabel title legend colorbar savefig tight_layout grid set_xlim set_ylim plot scatter hist boxplot imshow cmap alpha bins tick_params annotate quiver contour barh stackplot subplots_adjust axhline axvline semilogx semilogy loglog polar streamplot hexbin pcolor tricontour errorbar clabel set_aspect violinplot set_axis_off spines text hatch plt axis plt.bar() plt.axis import figure pyplot highlight_text pypalettes plt.subplots() xlabel ylabel title legend colorbar savefig tight_layout grid set_xlim set_ylim plot scatter hist boxplot imshow cmap alpha bins tick_params annotate quiver contour barh stackplot subplots_adjust axhline axvline semilogx semilogy loglog polar streamplot hexbin pcolor tricontour errorbar clabel set_aspect violinplot set_axis_off spines text hatch plt axis plt.bar() plt.axis import figure pyplot highlight_text pypalettes plt.subplots() xlabel ylabel title legend colorbar savefig tight_layout grid set_xlim set_ylim plot scatter hist boxplot imshow cmap alpha bins tick_params annotate quiver contour barh stackplot subplots_adjust axhline axvline semilogx semilogy loglog polar streamplot hexbin pcolor tricontour errorbar clabel set_aspect violinplot set_axis_off spines text hatch plt axis plt.bar() plt.axis import figure pyplot highlight_text pypalettes plt.subplots() xlabel ylabel title legend colorbar savefig tight_layout grid set_xlim set_ylim plot scatter hist boxplot imshow cmap alpha bins tick_params annotate quiver contour barh stackplot subplots_adjust axhline axvline semilogx semilogy loglog polar streamplot hexbin pcolor tricontour errorbar clabel set_aspect violinplot set_axis_off spines text hatch plt axis plt.bar() plt.axis import figure pyplot highlight_text pypalettes plt.subplots() xlabel ylabel title legend colorbar savefig tight_layout grid set_xlim set_ylim plot scatter hist boxplot imshow cmap alpha bins tick_params annotate quiver contour barh stackplot subplots_adjust axhline axvline semilogx semilogy loglog polar streamplot hexbin pcolor tricontour errorbar clabel set_aspect violinplot set_axis_off spines text hatch plt axis plt.bar() plt.axis import figure pyplot highlight_text pypalettes plt.subplots() xlabel ylabel title legend colorbar savefig tight_layout grid set_xlim set_ylim plot scatter hist boxplot imshow cmap alpha bins tick_params annotate quiver contour barh stackplot subplots_adjust axhline axvline semilogx semilogy loglog polar streamplot hexbin pcolor tricontour errorbar clabel set_aspect violinplot set_axis_off spines text hatch plt axis plt.bar() plt.axis import figure pyplot highlight_text pypalettes plt.subplots() xlabel ylabel title legend colorbar savefig tight_layout grid set_xlim set_ylim plot scatter hist boxplot imshow cmap alpha bins tick_params annotate quiver contour barh stackplot subplots_adjust axhline axvline semilogx semilogy loglog polar streamplot hexbin pcolor tricontour errorbar clabel set_aspect violinplot set_axis_off spines text hatch plt axis plt.bar() plt.axis import figure pyplot highlight_text pypalettes plt.subplots() xlabel ylabel title legend colorbar savefig tight_layout grid set_xlim set_ylim plot scatter hist boxplot imshow cmap alpha bins tick_params annotate quiver contour barh stackplot subplots_adjust axhline axvline semilogx semilogy loglog polar streamplot hexbin pcolor tricontour errorbar clabel set_aspect violinplot set_axis_off spines text hatch plt axis plt.bar() plt.axis import figure pyplot highlight_text pypalettes plt.subplots() xlabel ylabel title legend colorbar savefig tight_layout grid set_xlim set_ylim plot scatter hist boxplot imshow cmap alpha bins tick_params annotate quiver contour barh stackplot subplots_adjust axhline axvline semilogx semilogy loglog polar streamplot hexbin pcolor tricontour errorbar clabel set_aspect violinplot set_axis_off spines text hatch plt axis plt.bar() plt.axis import figure pyplot highlight_text pypalettes plt.subplots() xlabel ylabel title legend colorbar savefig tight_layout grid set_xlim set_ylim plot scatter hist boxplot imshow cmap alpha bins tick_params annotate quiver contour barh stackplot subplots_adjust axhline axvline semilogx semilogy loglog polar streamplot hexbin pcolor tricontour errorbar clabel set_aspect violinplot set_axis_off spines text hatch plt axis plt.bar() plt.axis import figure pyplot highlight_text pypalettes plt.subplots() xlabel ylabel title legend colorbar savefig tight_layout grid set_xlim set_ylim plot scatter hist boxplot imshow cmap alpha bins tick_params annotate quiver contour barh stackplot subplots_adjust axhline axvline semilogx semilogy loglog polar streamplot hexbin pcolor tricontour errorbar clabel set_aspect violinplot set_axis_off spines text hatch plt axis plt.bar() plt.axis import figure pyplot highlight_text pypalettes plt.subplots() xlabel ylabel title legend colorbar savefig tight_layout grid set_xlim set_ylim plot scatter hist boxplot imshow cmap alpha bins tick_params annotate quiver contour barh stackplot subplots_adjust axhline axvline semilogx semilogy loglog polar streamplot hexbin pcolor tricontour errorbar clabel set_aspect violinplot set_axis_off spines text hatch plt axis plt.bar() plt.axis import figure pyplot highlight_text pypalettes plt.subplots() xlabel ylabel title legend colorbar savefig tight_layout grid set_xlim set_ylim plot scatter hist boxplot imshow cmap alpha bins tick_params annotate quiver contour barh stackplot subplots_adjust axhline axvline semilogx semilogy loglog polar streamplot hexbin pcolor tricontour errorbar clabel set_aspect violinplot set_axis_off spines text hatch plt axis plt.bar() plt.axis import figure pyplot highlight_text pypalettes plt.subplots() xlabel ylabel title legend colorbar savefig tight_layout grid set_xlim set_ylim plot scatter hist boxplot imshow cmap alpha bins tick_params annotate quiver contour barh stackplot subplots_adjust axhline axvline semilogx semilogy loglog polar streamplot hexbin pcolor tricontour errorbar clabel set_aspect violinplot set_axis_off spines text hatch plt axis plt.bar() plt.axis import figure pyplot highlight_text pypalettes plt.subplots() xlabel ylabel title legend colorbar savefig tight_layout grid set_xlim set_ylim plot scatter hist boxplot imshow cmap alpha bins tick_params annotate quiver contour barh stackplot subplots_adjust axhline axvline semilogx semilogy loglog polar streamplot hexbin pcolor tricontour errorbar clabel set_aspect violinplot set_axis_off spines text hatch plt axis plt.bar() plt.axis import figure pyplot highlight_text pypalettes plt.subplots() xlabel ylabel title legend colorbar savefig tight_layout grid set_xlim set_ylim plot scatter hist boxplot imshow cmap alpha bins tick_params annotate quiver contour barh stackplot subplots_adjust axhline axvline semilogx semilogy loglog polar streamplot hexbin pcolor tricontour errorbar clabel set_aspect violinplot set_axis_off spines text hatch plt axis plt.bar() plt.axis import figure pyplot highlight_text pypalettes plt.subplots() xlabel ylabel title legend colorbar savefig tight_layout grid set_xlim set_ylim plot scatter hist boxplot imshow cmap alpha bins tick_params annotate quiver contour barh stackplot subplots_adjust axhline axvline semilogx semilogy loglog polar streamplot hexbin pcolor tricontour errorbar clabel set_aspect violinplot set_axis_off spines text hatch plt axis plt.bar() plt.axis import figure pyplot highlight_text pypalettes plt.subplots() xlabel ylabel title legend colorbar savefig tight_layout grid set_xlim set_ylim plot scatter hist boxplot imshow cmap alpha bins tick_params annotate quiver contour barh stackplot subplots_adjust axhline axvline semilogx semilogy loglog polar streamplot hexbin pcolor tricontour errorbar clabel set_aspect violinplot set_axis_off spines text hatch plt axis plt.bar() plt.axis import figure pyplot highlight_text pypalettes plt.subplots() xlabel ylabel title legend colorbar savefig tight_layout grid set_xlim set_ylim plot scatter hist boxplot imshow cmap alpha bins tick_params annotate quiver contour barh stackplot subplots_adjust axhline axvline semilogx semilogy loglog polar streamplot hexbin pcolor tricontour errorbar clabel set_aspect violinplot set_axis_off spines text hatch plt axis plt.bar() plt.axis import figure pyplot highlight_text pypalettes plt.subplots() xlabel ylabel title legend colorbar savefig tight_layout grid set_xlim set_ylim plot scatter hist boxplot imshow cmap alpha bins tick_params annotate quiver contour barh stackplot subplots_adjust axhline axvline semilogx semilogy loglog polar streamplot hexbin pcolor tricontour errorbar clabel set_aspect violinplot set_axis_off spines text hatch plt axis plt.bar() plt.axis import figure pyplot highlight_text pypalettes plt.subplots() xlabel ylabel title legend colorbar savefig tight_layout grid set_xlim set_ylim plot scatter hist boxplot imshow cmap alpha bins tick_params annotate quiver contour barh stackplot subplots_adjust axhline axvline semilogx semilogy loglog polar streamplot hexbin pcolor tricontour errorbar clabel set_aspect violinplot set_axis_off spines text hatch plt axis plt.bar() plt.axis import figure pyplot highlight_text pypalettes plt.subplots() xlabel ylabel title legend colorbar savefig tight_layout grid set_xlim set_ylim plot scatter hist boxplot imshow cmap alpha bins tick_params annotate quiver contour barh stackplot subplots_adjust axhline axvline semilogx semilogy loglog polar streamplot hexbin pcolor tricontour errorbar clabel set_aspect violinplot set_axis_off spines text hatch plt axis plt.bar() plt.axis import figure pyplot highlight_text pypalettes plt.subplots() xlabel ylabel title legend colorbar savefig tight_layout grid set_xlim set_ylim plot scatter hist boxplot imshow cmap alpha bins tick_params annotate quiver contour barh stackplot subplots_adjust axhline axvline semilogx semilogy loglog polar streamplot hexbin pcolor tricontour errorbar clabel set_aspect violinplot set_axis_off spines text hatch plt axis plt.bar() plt.axis import figure pyplot highlight_text pypalettes plt.subplots() xlabel ylabel title legend colorbar savefig tight_layout grid set_xlim set_ylim plot scatter hist boxplot imshow cmap alpha bins tick_params annotate quiver contour barh stackplot subplots_adjust axhline axvline semilogx semilogy loglog polar streamplot hexbin pcolor tricontour errorbar clabel set_aspect violinplot set_axis_off spines text hatch plt axis plt.bar() plt.axis import figure pyplot highlight_text pypalettes plt.subplots() xlabel ylabel title legend colorbar savefig tight_layout grid set_xlim set_ylim plot scatter hist boxplot imshow cmap alpha bins tick_params annotate quiver contour barh stackplot subplots_adjust axhline axvline semilogx semilogy loglog polar streamplot hexbin pcolor tricontour errorbar clabel set_aspect violinplot set_axis_off spines text hatch plt axis plt.bar() plt.axis import figure pyplot highlight_text pypalettes plt.subplots() xlabel ylabel title legend colorbar savefig tight_layout grid set_xlim set_ylim plot scatter hist boxplot imshow cmap alpha bins tick_params annotate quiver contour barh stackplot subplots_adjust axhline axvline semilogx semilogy loglog polar streamplot hexbin pcolor tricontour errorbar clabel set_aspect violinplot set_axis_off spines text hatch plt axis plt.bar() plt.axis import figure pyplot highlight_text pypalettes plt.subplots() xlabel ylabel title legend colorbar savefig tight_layout grid set_xlim set_ylim plot scatter hist boxplot imshow cmap alpha bins tick_params annotate quiver contour barh stackplot subplots_adjust axhline axvline semilogx semilogy loglog polar streamplot hexbin pcolor tricontour errorbar clabel set_aspect violinplot set_axis_off spines text hatch plt axis plt.bar() plt.axis import figure pyplot highlight_text pypalettes plt.subplots() xlabel ylabel title legend colorbar savefig tight_layout grid set_xlim set_ylim plot scatter hist boxplot imshow cmap alpha bins tick_params annotate quiver contour barh stackplot subplots_adjust axhline axvline semilogx semilogy loglog polar streamplot hexbin pcolor tricontour errorbar clabel set_aspect violinplot set_axis_off spines text hatch plt axis plt.bar() plt.axis import figure pyplot highlight_text pypalettes plt.subplots() xlabel ylabel title legend colorbar savefig tight_layout grid set_xlim set_ylim plot scatter hist boxplot imshow cmap alpha bins tick_params annotate quiver contour barh stackplot subplots_adjust axhline axvline semilogx semilogy loglog polar streamplot hexbin pcolor tricontour errorbar clabel set_aspect violinplot set_axis_off spines text hatch plt axis plt.bar() plt.axis import figure pyplot highlight_text pypalettes plt.subplots() xlabel ylabel title legend colorbar savefig tight_layout grid set_xlim set_ylim plot scatter hist boxplot imshow cmap alpha bins tick_params annotate quiver contour barh stackplot subplots_adjust axhline axvline semilogx semilogy loglog polar streamplot hexbin pcolor tricontour errorbar clabel set_aspect violinplot set_axis_off spines text hatch plt axis plt.bar() plt.axis import figure pyplot highlight_text pypalettes plt.subplots() xlabel ylabel title legend colorbar savefig tight_layout grid set_xlim set_ylim plot scatter hist boxplot imshow cmap alpha bins tick_params annotate quiver contour barh stackplot subplots_adjust axhline axvline semilogx semilogy loglog polar streamplot hexbin pcolor tricontour errorbar clabel set_aspect violinplot set_axis_off spines text hatch plt axis plt.bar() plt.axis import figure pyplot highlight_text pypalettes plt.subplots() xlabel ylabel title legend colorbar savefig tight_layout grid set_xlim set_ylim plot scatter hist boxplot imshow cmap alpha bins tick_params annotate quiver contour barh stackplot subplots_adjust axhline axvline semilogx semilogy loglog polar streamplot hexbin pcolor tricontour errorbar clabel set_aspect violinplot set_axis_off spines text hatch plt axis plt.bar() plt.axis import figure pyplot highlight_text pypalettes plt.subplots() xlabel ylabel title legend colorbar savefig tight_layout grid set_xlim set_ylim plot scatter hist boxplot imshow cmap alpha bins tick_params annotate quiver contour barh stackplot subplots_adjust axhline axvline semilogx semilogy loglog polar streamplot hexbin pcolor tricontour errorbar clabel set_aspect violinplot set_axis_off spines text hatch plt axis plt.bar() plt.axis import figure pyplot highlight_text pypalettes plt.subplots() xlabel ylabel title legend colorbar savefig tight_layout grid set_xlim set_ylim plot scatter hist boxplot imshow cmap alpha bins tick_params annotate quiver contour barh stackplot subplots_adjust axhline axvline semilogx semilogy loglog polar streamplot hexbin pcolor tricontour errorbar clabel set_aspect violinplot set_axis_off spines text hatch plt axis plt.bar() plt.axis import figure pyplot highlight_text pypalettes plt.subplots() xlabel ylabel title legend colorbar savefig tight_layout grid set_xlim set_ylim plot scatter hist boxplot imshow cmap alpha bins tick_params annotate quiver contour barh stackplot subplots_adjust axhline axvline semilogx semilogy loglog polar streamplot hexbin pcolor tricontour errorbar clabel set_aspect violinplot set_axis_off spines text hatch plt axis plt.bar() plt.axis import figure pyplot highlight_text pypalettes plt.subplots() xlabel ylabel title legend colorbar savefig tight_layout grid set_xlim set_ylim plot scatter hist boxplot imshow cmap alpha bins tick_params annotate quiver contour barh stackplot subplots_adjust axhline axvline semilogx semilogy loglog polar streamplot hexbin pcolor tricontour errorbar clabel set_aspect violinplot set_axis_off spines text hatch plt axis plt.bar() plt.axis import figure pyplot highlight_text pypalettes plt.subplots() xlabel ylabel title legend colorbar savefig tight_layout grid set_xlim set_ylim plot scatter hist boxplot imshow cmap alpha bins tick_params annotate quiver contour barh stackplot subplots_adjust axhline axvline semilogx semilogy loglog polar streamplot hexbin pcolor tricontour errorbar clabel set_aspect violinplot set_axis_off spines text hatch plt axis plt.bar() plt.axis import figure pyplot highlight_text pypalettes plt.subplots() xlabel ylabel title legend colorbar savefig tight_layout grid set_xlim set_ylim plot scatter hist boxplot imshow cmap alpha bins tick_params annotate quiver contour barh stackplot subplots_adjust axhline axvline semilogx semilogy loglog polar streamplot hexbin pcolor tricontour errorbar clabel set_aspect violinplot set_axis_off spines text hatch plt axis plt.bar() plt.axis import figure pyplot highlight_text pypalettes plt.subplots() xlabel ylabel title legend colorbar savefig tight_layout grid set_xlim set_ylim plot scatter hist boxplot imshow cmap alpha bins tick_params annotate quiver contour barh stackplot subplots_adjust axhline axvline semilogx semilogy loglog polar streamplot hexbin pcolor tricontour errorbar clabel set_aspect violinplot set_axis_off spines text hatch plt axis plt.bar() plt.axis import figure pyplot highlight_text pypalettes plt.subplots() xlabel ylabel title legend colorbar savefig tight_layout grid set_xlim set_ylim plot scatter hist boxplot imshow cmap alpha bins tick_params annotate quiver contour barh stackplot subplots_adjust axhline axvline semilogx semilogy loglog polar streamplot hexbin pcolor tricontour errorbar clabel set_aspect violinplot set_axis_off spines text hatch plt axis plt.bar() plt.axis import figure pyplot highlight_text pypalettes plt.subplots() xlabel ylabel title legend colorbar savefig tight_layout grid set_xlim set_ylim plot scatter hist boxplot imshow cmap alpha bins tick_params annotate quiver contour barh stackplot subplots_adjust axhline axvline semilogx semilogy loglog polar streamplot hexbin pcolor tricontour errorbar clabel set_aspect violinplot set_axis_off spines text hatch plt axis plt.bar() plt.axis import figure pyplot highlight_text pypalettes plt.subplots() xlabel ylabel title legend colorbar savefig tight_layout grid set_xlim set_ylim plot scatter hist boxplot imshow cmap alpha bins tick_params annotate quiver contour barh stackplot subplots_adjust axhline axvline semilogx semilogy loglog polar streamplot hexbin pcolor tricontour errorbar clabel set_aspect violinplot set_axis_off spines text hatch plt axis plt.bar() plt.axis import figure pyplot highlight_text pypalettes plt.subplots() xlabel ylabel title legend colorbar savefig tight_layout grid set_xlim set_ylim plot scatter hist boxplot imshow cmap alpha bins tick_params annotate quiver contour barh stackplot subplots_adjust axhline axvline semilogx semilogy loglog polar streamplot hexbin pcolor tricontour errorbar clabel set_aspect violinplot set_axis_off spines text hatch plt axis plt.bar() plt.axis import figure pyplot highlight_text pypalettes plt.subplots() xlabel ylabel title legend colorbar savefig tight_layout grid set_xlim set_ylim plot scatter hist boxplot imshow cmap alpha bins tick_params annotate quiver contour barh stackplot subplots_adjust axhline axvline semilogx semilogy loglog polar streamplot hexbin pcolor tricontour errorbar clabel set_aspect violinplot set_axis_off spines text hatch plt axis plt.bar() plt.axis import figure pyplot highlight_text pypalettes plt.subplots() xlabel ylabel title legend colorbar savefig tight_layout grid set_xlim set_ylim plot scatter hist boxplot imshow cmap alpha bins tick_params annotate quiver contour barh stackplot subplots_adjust axhline axvline semilogx semilogy loglog polar streamplot hexbin pcolor tricontour errorbar clabel set_aspect violinplot set_axis_off spines text hatch plt axis plt.bar() plt.axis import figure pyplot highlight_text pypalettes plt.subplots() xlabel ylabel title legend colorbar savefig tight_layout grid set_xlim set_ylim plot scatter hist boxplot imshow cmap alpha bins tick_params annotate quiver contour barh stackplot subplots_adjust axhline axvline semilogx semilogy loglog polar streamplot hexbin pcolor tricontour errorbar clabel set_aspect violinplot set_axis_off spines text hatch plt axis plt.bar() plt.axis import figure pyplot highlight_text pypalettes plt.subplots() xlabel ylabel title legend colorbar savefig tight_layout grid set_xlim set_ylim plot scatter hist boxplot imshow cmap alpha bins tick_params annotate quiver contour barh stackplot subplots_adjust axhline axvline semilogx semilogy loglog polar streamplot hexbin pcolor tricontour errorbar clabel set_aspect violinplot set_axis_off spines text hatch plt axis plt.bar() plt.axis import figure pyplot highlight_text pypalettes plt.subplots() xlabel ylabel title legend colorbar savefig tight_layout grid set_xlim set_ylim plot scatter hist boxplot imshow cmap alpha bins tick_params annotate quiver contour barh stackplot subplots_adjust axhline axvline semilogx semilogy loglog polar streamplot hexbin pcolor tricontour errorbar clabel set_aspect violinplot set_axis_off spines text hatch plt axis plt.bar() plt.axis import figure pyplot highlight_text pypalettes plt.subplots() xlabel ylabel title legend colorbar savefig tight_layout grid set_xlim set_ylim plot scatter hist boxplot imshow cmap alpha bins tick_params annotate quiver contour barh stackplot subplots_adjust axhline axvline semilogx semilogy loglog polar streamplot hexbin pcolor tricontour errorbar clabel set_aspect violinplot set_axis_off spines text hatch plt axis plt.bar() plt.axis import figure pyplot highlight_text pypalettes plt.subplots() xlabel ylabel title legend colorbar savefig tight_layout grid set_xlim set_ylim plot scatter hist boxplot imshow cmap alpha bins tick_params annotate quiver contour barh stackplot subplots_adjust axhline axvline semilogx semilogy loglog polar streamplot hexbin pcolor tricontour errorbar clabel set_aspect violinplot set_axis_off spines text hatch plt axis plt.bar() plt.axis import figure pyplot highlight_text pypalettes plt.subplots() xlabel ylabel title legend colorbar savefig tight_layout grid set_xlim set_ylim plot scatter hist boxplot imshow cmap alpha bins tick_params annotate quiver contour barh stackplot subplots_adjust axhline axvline semilogx semilogy loglog polar streamplot hexbin pcolor tricontour errorbar clabel set_aspect violinplot set_axis_off spines text hatch plt axis plt.bar() plt.axis import figure pyplot highlight_text pypalettes plt.subplots() xlabel ylabel title legend colorbar savefig tight_layout grid set_xlim set_ylim plot scatter hist boxplot imshow cmap alpha bins tick_params annotate quiver contour barh stackplot subplots_adjust axhline axvline semilogx semilogy loglog polar streamplot hexbin pcolor tricontour errorbar clabel set_aspect violinplot set_axis_off spines text hatch plt axis plt.bar() plt.axis import figure pyplot highlight_text pypalettes plt.subplots() xlabel ylabel title legend colorbar savefig tight_layout grid set_xlim set_ylim plot scatter hist boxplot imshow cmap alpha bins tick_params annotate quiver contour barh stackplot subplots_adjust axhline axvline semilogx semilogy loglog polar streamplot hexbin pcolor tricontour errorbar clabel set_aspect violinplot set_axis_off spines text hatch plt axis plt.bar() plt.axis import figure pyplot highlight_text pypalettes plt.subplots() xlabel ylabel title legend colorbar savefig tight_layout grid set_xlim set_ylim plot scatter hist boxplot imshow cmap alpha bins tick_params annotate quiver contour barh stackplot subplots_adjust axhline axvline semilogx semilogy loglog polar streamplot hexbin pcolor tricontour errorbar clabel set_aspect violinplot set_axis_off spines text hatch plt axis plt.bar() plt.axis import figure pyplot highlight_text pypalettes plt.subplots() xlabel ylabel title legend colorbar savefig tight_layout grid set_xlim set_ylim plot scatter hist boxplot imshow cmap alpha bins tick_params annotate quiver contour barh stackplot subplots_adjust axhline axvline semilogx semilogy loglog polar streamplot hexbin pcolor tricontour errorbar clabel set_aspect violinplot set_axis_off spines text hatch plt axis plt.bar() plt.axis import figure pyplot highlight_text pypalettes plt.subplots() xlabel ylabel title legend colorbar savefig tight_layout grid set_xlim set_ylim plot scatter hist boxplot imshow cmap alpha bins tick_params annotate quiver contour barh stackplot subplots_adjust axhline axvline semilogx semilogy loglog polar streamplot hexbin pcolor tricontour errorbar clabel set_aspect violinplot set_axis_off spines text hatch plt axis plt.bar() plt.axis import figure pyplot highlight_text pypalettes plt.subplots() xlabel ylabel title legend colorbar savefig tight_layout grid set_xlim set_ylim plot scatter hist boxplot imshow cmap alpha bins tick_params annotate quiver contour barh stackplot subplots_adjust axhline axvline semilogx semilogy loglog polar streamplot hexbin pcolor tricontour errorbar clabel set_aspect violinplot set_axis_off spines text hatch plt axis plt.bar() plt.axis import figure pyplot highlight_text pypalettes plt.subplots() xlabel ylabel title legend colorbar savefig tight_layout grid set_xlim set_ylim plot scatter hist boxplot imshow cmap alpha bins tick_params annotate quiver contour barh stackplot subplots_adjust axhline axvline semilogx semilogy loglog polar streamplot hexbin pcolor tricontour errorbar clabel set_aspect violinplot set_axis_off spines text hatch plt axis plt.bar() plt.axis import figure pyplot highlight_text pypalettes plt.subplots() xlabel ylabel title legend colorbar savefig tight_layout grid set_xlim set_ylim plot scatter hist boxplot imshow cmap alpha bins tick_params annotate quiver contour barh stackplot subplots_adjust axhline axvline semilogx semilogy loglog polar streamplot hexbin pcolor tricontour errorbar clabel set_aspect violinplot set_axis_off spines text hatch plt axis plt.bar() plt.axis import figure pyplot highlight_text pypalettes plt.subplots() xlabel ylabel title legend colorbar savefig tight_layout grid set_xlim set_ylim plot scatter hist boxplot imshow cmap alpha bins tick_params annotate quiver contour barh stackplot subplots_adjust axhline axvline semilogx semilogy loglog polar streamplot hexbin pcolor tricontour errorbar clabel set_aspect violinplot set_axis_off spines text hatch plt axis plt.bar() plt.axis import figure pyplot highlight_text pypalettes plt.subplots() xlabel ylabel title legend colorbar savefig tight_layout grid set_xlim set_ylim plot scatter hist boxplot imshow cmap alpha bins tick_params annotate quiver contour barh stackplot subplots_adjust axhline axvline semilogx semilogy loglog polar streamplot hexbin pcolor tricontour errorbar clabel set_aspect violinplot set_axis_off spines text hatch plt axis plt.bar() plt.axis import figure pyplot highlight_text pypalettes plt.subplots() xlabel ylabel title legend colorbar savefig tight_layout grid set_xlim set_ylim plot scatter hist boxplot imshow cmap alpha bins tick_params annotate quiver contour barh stackplot subplots_adjust axhline axvline semilogx semilogy loglog polar streamplot hexbin pcolor tricontour errorbar clabel set_aspect violinplot set_axis_off spines text hatch plt axis plt.bar() plt.axis import figure pyplot highlight_text pypalettes plt.subplots() xlabel ylabel title legend colorbar savefig tight_layout grid set_xlim set_ylim plot scatter hist boxplot imshow cmap alpha bins tick_params annotate quiver contour barh stackplot subplots_adjust axhline axvline semilogx semilogy loglog polar streamplot hexbin pcolor tricontour errorbar clabel set_aspect violinplot set_axis_off spines text hatch plt axis plt.bar() plt.axis import figure pyplot highlight_text pypalettes plt.subplots() xlabel ylabel title legend colorbar savefig tight_layout grid set_xlim set_ylim plot scatter hist boxplot imshow cmap alpha bins tick_params annotate quiver contour barh stackplot subplots_adjust axhline axvline semilogx semilogy loglog polar streamplot hexbin pcolor tricontour errorbar clabel set_aspect violinplot set_axis_off spines text hatch plt axis plt.bar() plt.axis import figure pyplot highlight_text pypalettes plt.subplots() xlabel ylabel title legend colorbar savefig tight_layout grid set_xlim set_ylim plot scatter hist boxplot imshow cmap alpha bins tick_params annotate quiver contour barh stackplot subplots_adjust axhline axvline semilogx semilogy loglog polar streamplot hexbin pcolor tricontour errorbar clabel set_aspect violinplot set_axis_off spines text hatch plt axis plt.bar() plt.axis import figure pyplot highlight_text pypalettes plt.subplots() xlabel ylabel title legend colorbar savefig tight_layout grid set_xlim set_ylim plot scatter hist boxplot imshow cmap alpha bins tick_params annotate quiver contour barh stackplot subplots_adjust axhline axvline semilogx semilogy loglog polar streamplot hexbin pcolor tricontour errorbar clabel set_aspect violinplot set_axis_off spines text hatch plt axis plt.bar() plt.axis import figure pyplot highlight_text pypalettes plt.subplots() xlabel ylabel title legend colorbar savefig tight_layout grid set_xlim set_ylim plot scatter hist boxplot imshow cmap alpha bins tick_params annotate quiver contour barh stackplot subplots_adjust axhline axvline semilogx semilogy loglog polar streamplot hexbin pcolor tricontour errorbar clabel set_aspect violinplot set_axis_off spines text hatch plt axis plt.bar() plt.axis import figure pyplot highlight_text pypalettes plt.subplots() xlabel ylabel title legend colorbar savefig tight_layout grid set_xlim set_ylim plot scatter hist boxplot imshow cmap alpha bins tick_params annotate quiver contour barh stackplot subplots_adjust axhline axvline semilogx semilogy loglog polar streamplot hexbin pcolor tricontour errorbar clabel set_aspect violinplot set_axis_off spines text hatch plt axis plt.bar() plt.axis import figure pyplot highlight_text pypalettes plt.subplots() xlabel ylabel title legend colorbar savefig tight_layout grid set_xlim set_ylim plot scatter hist boxplot imshow cmap alpha bins tick_params annotate quiver contour barh stackplot subplots_adjust axhline axvline semilogx semilogy loglog polar streamplot hexbin pcolor tricontour errorbar clabel set_aspect violinplot set_axis_off spines text hatch plt axis plt.bar() plt.axis import figure pyplot highlight_text pypalettes plt.subplots() xlabel ylabel title legend colorbar savefig tight_layout grid set_xlim set_ylim plot scatter hist boxplot imshow cmap alpha bins tick_params annotate quiver contour barh stackplot subplots_adjust axhline axvline semilogx semilogy loglog polar streamplot hexbin pcolor tricontour errorbar clabel set_aspect violinplot set_axis_off spines text hatch plt axis plt.bar() plt.axis import figure pyplot highlight_text pypalettes plt.subplots() xlabel ylabel title legend colorbar savefig tight_layout grid set_xlim set_ylim plot scatter hist boxplot imshow cmap alpha bins tick_params annotate quiver contour barh stackplot subplots_adjust axhline axvline semilogx semilogy loglog polar streamplot hexbin pcolor tricontour errorbar clabel set_aspect violinplot set_axis_off spines text hatch plt axis plt.bar() plt.axis import figure pyplot highlight_text pypalettes plt.subplots() xlabel ylabel title legend colorbar savefig tight_layout grid set_xlim set_ylim plot scatter hist boxplot imshow cmap alpha bins tick_params annotate quiver contour barh stackplot subplots_adjust axhline axvline semilogx semilogy loglog polar streamplot hexbin pcolor tricontour errorbar clabel set_aspect violinplot set_axis_off spines text hatch plt axis plt.bar() plt.axis import figure pyplot highlight_text pypalettes plt.subplots() xlabel ylabel title legend colorbar savefig tight_layout grid set_xlim set_ylim plot scatter hist boxplot imshow cmap alpha bins tick_params annotate quiver contour barh stackplot subplots_adjust axhline axvline semilogx semilogy loglog polar streamplot hexbin pcolor tricontour errorbar clabel set_aspect violinplot set_axis_off spines text hatch plt axis plt.bar() plt.axis import figure pyplot highlight_text pypalettes plt.subplots() xlabel ylabel title legend colorbar savefig tight_layout grid set_xlim set_ylim plot scatter hist boxplot imshow cmap alpha bins tick_params annotate quiver contour barh stackplot subplots_adjust axhline axvline semilogx semilogy loglog polar streamplot hexbin pcolor tricontour errorbar clabel set_aspect violinplot set_axis_off spines text hatch plt axis plt.bar() plt.axis import figure pyplot highlight_text pypalettes plt.subplots() xlabel ylabel title legend colorbar savefig tight_layout grid set_xlim set_ylim plot scatter hist boxplot imshow cmap alpha bins tick_params annotate quiver contour barh stackplot subplots_adjust axhline axvline semilogx semilogy loglog polar streamplot hexbin pcolor tricontour errorbar clabel set_aspect violinplot set_axis_off spines text hatch plt axis plt.bar() plt.axis import figure pyplot highlight_text pypalettes plt.subplots() xlabel ylabel title legend colorbar savefig tight_layout grid set_xlim set_ylim plot scatter hist boxplot imshow cmap alpha bins tick_params annotate quiver contour barh stackplot subplots_adjust axhline axvline semilogx semilogy loglog polar streamplot hexbin pcolor tricontour errorbar clabel set_aspect violinplot set_axis_off spines text hatch plt axis plt.bar() plt.axis import figure pyplot highlight_text pypalettes plt.subplots() xlabel ylabel title legend colorbar savefig tight_layout grid set_xlim set_ylim plot scatter hist boxplot imshow cmap alpha bins tick_params annotate quiver contour barh stackplot subplots_adjust axhline axvline semilogx semilogy loglog polar streamplot hexbin pcolor tricontour errorbar clabel set_aspect violinplot set_axis_off spines text hatch plt axis plt.bar() plt.axis import figure pyplot highlight_text pypalettes plt.subplots() xlabel ylabel title legend colorbar savefig tight_layout grid set_xlim set_ylim plot scatter hist boxplot imshow cmap alpha bins tick_params annotate quiver contour barh stackplot subplots_adjust axhline axvline semilogx semilogy loglog polar streamplot hexbin pcolor tricontour errorbar clabel set_aspect violinplot set_axis_off spines text hatch plt axis plt.bar() plt.axis import figure pyplot highlight_text pypalettes plt.subplots() xlabel ylabel title legend colorbar savefig tight_layout grid set_xlim set_ylim plot scatter hist boxplot imshow cmap alpha bins tick_params annotate quiver contour barh stackplot subplots_adjust axhline axvline semilogx semilogy loglog polar streamplot hexbin pcolor tricontour errorbar clabel set_aspect violinplot set_axis_off spines text hatch plt axis plt.bar() plt.axis import figure pyplot highlight_text pypalettes plt.subplots() xlabel ylabel title legend colorbar savefig tight_layout grid set_xlim set_ylim plot scatter hist boxplot imshow cmap alpha bins tick_params annotate quiver contour barh stackplot subplots_adjust axhline axvline semilogx semilogy loglog polar streamplot hexbin pcolor tricontour errorbar clabel set_aspect violinplot set_axis_off spines text hatch plt axis plt.bar() plt.axis import figure pyplot highlight_text pypalettes plt.subplots() xlabel ylabel title legend colorbar savefig tight_layout grid set_xlim set_ylim plot scatter hist boxplot imshow cmap alpha bins tick_params annotate quiver contour barh stackplot subplots_adjust axhline axvline semilogx semilogy loglog polar streamplot hexbin pcolor tricontour errorbar clabel set_aspect violinplot set_axis_off spines text hatch plt axis plt.bar() plt.axis import figure pyplot highlight_text pypalettes plt.subplots() xlabel ylabel title legend colorbar savefig tight_layout grid set_xlim set_ylim plot scatter hist boxplot imshow cmap alpha bins tick_params annotate quiver contour barh stackplot subplots_adjust axhline axvline semilogx semilogy loglog polar streamplot hexbin pcolor tricontour errorbar clabel set_aspect violinplot set_axis_off spines text hatch plt axis plt.bar() plt.axis import figure pyplot highlight_text pypalettes plt.subplots() xlabel ylabel title legend colorbar savefig tight_layout grid set_xlim set_ylim plot scatter hist boxplot imshow cmap alpha bins tick_params annotate quiver contour barh stackplot subplots_adjust axhline axvline semilogx semilogy loglog polar streamplot hexbin pcolor tricontour errorbar clabel set_aspect violinplot set_axis_off spines text hatch plt axis plt.bar() plt.axis import figure pyplot highlight_text pypalettes plt.subplots() xlabel ylabel title legend colorbar savefig tight_layout grid set_xlim set_ylim plot scatter hist boxplot imshow cmap alpha bins tick_params annotate quiver contour barh stackplot subplots_adjust axhline axvline semilogx semilogy loglog polar streamplot hexbin pcolor tricontour errorbar clabel set_aspect violinplot set_axis_off spines text hatch plt axis plt.bar() plt.axis import figure pyplot highlight_text pypalettes plt.subplots() xlabel ylabel title legend colorbar savefig tight_layout grid set_xlim set_ylim plot scatter hist boxplot imshow cmap alpha bins tick_params annotate quiver contour barh stackplot subplots_adjust axhline axvline semilogx semilogy loglog polar streamplot hexbin pcolor tricontour errorbar clabel set_aspect violinplot set_axis_off spines text hatch plt axis plt.bar() plt.axis import figure pyplot highlight_text pypalettes plt.subplots() xlabel ylabel title legend colorbar savefig tight_layout grid set_xlim set_ylim plot scatter hist boxplot imshow cmap alpha bins tick_params annotate quiver contour barh stackplot subplots_adjust axhline axvline semilogx semilogy loglog polar streamplot hexbin pcolor tricontour errorbar clabel set_aspect violinplot set_axis_off spines text hatch plt axis plt.bar() plt.axis import figure pyplot highlight_text pypalettes plt.subplots() xlabel ylabel title legend colorbar savefig tight_layout grid set_xlim set_ylim plot scatter hist boxplot imshow cmap alpha bins tick_params annotate quiver contour barh stackplot subplots_adjust axhline axvline semilogx semilogy loglog polar streamplot hexbin pcolor tricontour errorbar clabel set_aspect violinplot set_axis_off spines text hatch plt axis plt.bar() plt.axis import figure pyplot highlight_text pypalettes plt.subplots() xlabel ylabel title legend colorbar savefig tight_layout grid set_xlim set_ylim plot scatter hist boxplot imshow cmap alpha bins tick_params annotate quiver contour barh stackplot subplots_adjust axhline axvline semilogx semilogy loglog polar streamplot hexbin pcolor tricontour errorbar clabel set_aspect violinplot set_axis_off spines text hatch plt axis plt.bar() plt.axis import figure pyplot highlight_text pypalettes plt.subplots() xlabel ylabel title legend colorbar savefig tight_layout grid set_xlim set_ylim plot scatter hist boxplot imshow cmap alpha bins tick_params annotate quiver contour barh stackplot subplots_adjust axhline axvline semilogx semilogy loglog polar streamplot hexbin pcolor tricontour errorbar clabel set_aspect violinplot set_axis_off spines text hatch plt axis plt.bar() plt.axis import figure pyplot highlight_text pypalettes plt.subplots() xlabel ylabel title legend colorbar savefig tight_layout grid set_xlim set_ylim plot scatter hist boxplot imshow cmap alpha bins tick_params annotate quiver contour barh stackplot subplots_adjust axhline axvline semilogx semilogy loglog polar streamplot hexbin pcolor tricontour errorbar clabel set_aspect violinplot set_axis_off spines text hatch plt axis plt.bar() plt.axis import figure pyplot highlight_text pypalettes plt.subplots() xlabel ylabel title legend colorbar savefig tight_layout grid set_xlim set_ylim plot scatter hist boxplot imshow cmap alpha bins tick_params annotate quiver contour barh stackplot subplots_adjust axhline axvline semilogx semilogy loglog polar streamplot hexbin pcolor tricontour errorbar clabel set_aspect violinplot set_axis_off spines text hatch plt axis plt.bar() plt.axis import figure pyplot highlight_text pypalettes plt.subplots() xlabel ylabel title legend colorbar savefig tight_layout grid set_xlim set_ylim plot scatter hist boxplot imshow cmap alpha bins tick_params annotate quiver contour barh stackplot subplots_adjust axhline axvline semilogx semilogy loglog polar streamplot hexbin pcolor tricontour errorbar clabel set_aspect violinplot set_axis_off spines text hatch plt axis plt.bar() plt.axis import figure pyplot highlight_text pypalettes plt.subplots() xlabel ylabel title legend colorbar savefig tight_layout grid set_xlim set_ylim plot scatter hist boxplot imshow cmap alpha bins tick_params annotate quiver contour barh stackplot subplots_adjust axhline axvline semilogx semilogy loglog polar streamplot hexbin pcolor tricontour errorbar clabel set_aspect violinplot set_axis_off spines text hatch plt axis plt.bar() plt.axis import figure pyplot highlight_text pypalettes plt.subplots() xlabel ylabel title legend colorbar savefig tight_layout grid set_xlim set_ylim plot scatter hist boxplot imshow cmap alpha bins tick_params annotate quiver contour barh stackplot subplots_adjust axhline axvline semilogx semilogy loglog polar streamplot hexbin pcolor tricontour errorbar clabel set_aspect violinplot set_axis_off spines text hatch plt axis plt.bar() plt.axis import figure pyplot highlight_text pypalettes plt.subplots() xlabel ylabel title legend colorbar savefig tight_layout grid set_xlim set_ylim plot scatter hist boxplot imshow cmap alpha bins tick_params annotate quiver contour barh stackplot subplots_adjust axhline axvline semilogx semilogy loglog polar streamplot hexbin pcolor tricontour errorbar clabel set_aspect violinplot set_axis_off spines text hatch plt axis plt.bar() plt.axis import figure pyplot highlight_text pypalettes plt.subplots() xlabel ylabel title legend colorbar savefig tight_layout grid set_xlim set_ylim plot scatter hist boxplot imshow cmap alpha bins tick_params annotate quiver contour barh stackplot subplots_adjust axhline axvline semilogx semilogy loglog polar streamplot hexbin pcolor tricontour errorbar clabel set_aspect violinplot set_axis_off spines text hatch plt axis plt.bar() plt.axis import figure pyplot highlight_text pypalettes plt.subplots() xlabel ylabel title legend colorbar savefig tight_layout grid set_xlim set_ylim plot scatter hist boxplot imshow cmap alpha bins tick_params annotate quiver contour barh stackplot subplots_adjust axhline axvline semilogx semilogy loglog polar streamplot hexbin pcolor tricontour errorbar clabel set_aspect violinplot set_axis_off spines text hatch plt axis plt.bar() plt.axis import figure pyplot highlight_text pypalettes plt.subplots() xlabel ylabel title legend colorbar savefig tight_layout grid set_xlim set_ylim plot scatter hist boxplot imshow cmap alpha bins tick_params annotate quiver contour barh stackplot subplots_adjust axhline axvline semilogx semilogy loglog polar streamplot hexbin pcolor tricontour errorbar clabel set_aspect violinplot set_axis_off spines text hatch plt axis plt.bar() plt.axis import figure pyplot highlight_text pypalettes plt.subplots() xlabel ylabel title legend colorbar savefig tight_layout grid set_xlim set_ylim plot scatter hist boxplot imshow cmap alpha bins tick_params annotate quiver contour barh stackplot subplots_adjust axhline axvline semilogx semilogy loglog polar streamplot hexbin pcolor tricontour errorbar clabel set_aspect violinplot set_axis_off spines text hatch plt axis plt.bar() plt.axis import figure pyplot highlight_text pypalettes plt.subplots() xlabel ylabel title legend colorbar savefig tight_layout grid set_xlim set_ylim plot scatter hist boxplot imshow cmap alpha bins tick_params annotate quiver contour barh stackplot subplots_adjust axhline axvline semilogx semilogy loglog polar streamplot hexbin pcolor tricontour errorbar clabel set_aspect violinplot set_axis_off spines text hatch plt axis plt.bar() plt.axis import figure pyplot highlight_text pypalettes plt.subplots() xlabel ylabel title legend colorbar savefig tight_layout grid set_xlim set_ylim plot scatter hist boxplot imshow cmap alpha bins tick_params annotate quiver contour barh stackplot subplots_adjust axhline axvline semilogx semilogy loglog polar streamplot hexbin pcolor tricontour errorbar clabel set_aspect violinplot set_axis_off spines text hatch plt axis plt.bar() plt.axis import figure pyplot highlight_text pypalettes plt.subplots() xlabel ylabel title legend colorbar savefig tight_layout grid set_xlim set_ylim plot scatter hist boxplot imshow cmap alpha bins tick_params annotate quiver contour barh stackplot subplots_adjust axhline axvline semilogx semilogy loglog polar streamplot hexbin pcolor tricontour errorbar clabel set_aspect violinplot set_axis_off spines text hatch plt axis plt.bar() plt.axis import figure pyplot highlight_text pypalettes plt.subplots() xlabel ylabel title legend colorbar savefig tight_layout grid set_xlim set_ylim plot scatter hist boxplot imshow cmap alpha bins tick_params annotate quiver contour barh stackplot subplots_adjust axhline axvline semilogx semilogy loglog polar streamplot hexbin pcolor tricontour errorbar clabel set_aspect violinplot set_axis_off spines text hatch plt axis plt.bar() plt.axis import figure pyplot highlight_text pypalettes plt.subplots() xlabel ylabel title legend colorbar savefig tight_layout grid set_xlim set_ylim plot scatter hist boxplot imshow cmap alpha bins tick_params annotate quiver contour barh stackplot subplots_adjust axhline axvline semilogx semilogy loglog polar streamplot hexbin pcolor tricontour errorbar clabel set_aspect violinplot set_axis_off spines text hatch plt axis plt.bar() plt.axis import figure pyplot highlight_text pypalettes plt.subplots() xlabel ylabel title legend colorbar savefig tight_layout grid set_xlim set_ylim plot scatter hist boxplot imshow cmap alpha bins tick_params annotate quiver contour barh stackplot subplots_adjust axhline axvline semilogx semilogy loglog polar streamplot hexbin pcolor tricontour errorbar clabel set_aspect violinplot set_axis_off spines text hatch plt axis plt.bar() plt.axis import figure pyplot highlight_text pypalettes plt.subplots() xlabel ylabel title legend colorbar savefig tight_layout grid set_xlim set_ylim plot scatter hist boxplot imshow cmap alpha bins tick_params annotate quiver contour barh stackplot subplots_adjust axhline axvline semilogx semilogy loglog polar streamplot hexbin pcolor tricontour errorbar clabel set_aspect violinplot set_axis_off spines text hatch plt axis plt.bar() plt.axis import figure pyplot highlight_text pypalettes plt.subplots() xlabel ylabel title legend colorbar savefig tight_layout grid set_xlim set_ylim plot scatter hist boxplot imshow cmap alpha bins tick_params annotate quiver contour barh stackplot subplots_adjust axhline axvline semilogx semilogy loglog polar streamplot hexbin pcolor tricontour errorbar clabel set_aspect violinplot set_axis_off spines text hatch plt axis plt.bar() plt.axis import figure pyplot highlight_text pypalettes plt.subplots() xlabel ylabel title legend colorbar savefig tight_layout grid set_xlim set_ylim plot scatter hist boxplot imshow cmap alpha bins tick_params annotate quiver contour barh stackplot subplots_adjust axhline axvline semilogx semilogy loglog polar streamplot hexbin pcolor tricontour errorbar clabel set_aspect violinplot set_axis_off spines text hatch plt axis plt.bar() plt.axis import figure pyplot highlight_text pypalettes plt.subplots() xlabel ylabel title legend colorbar savefig tight_layout grid set_xlim set_ylim plot scatter hist boxplot imshow cmap alpha bins tick_params annotate quiver contour barh stackplot subplots_adjust axhline axvline semilogx semilogy loglog polar streamplot hexbin pcolor tricontour errorbar clabel set_aspect violinplot set_axis_off spines text hatch plt axis plt.bar() plt.axis import figure pyplot highlight_text pypalettes plt.subplots() xlabel ylabel title legend colorbar savefig tight_layout grid set_xlim set_ylim plot scatter hist boxplot imshow cmap alpha bins tick_params annotate quiver contour barh stackplot subplots_adjust axhline axvline semilogx semilogy loglog polar streamplot hexbin pcolor tricontour errorbar clabel set_aspect violinplot set_axis_off spines text hatch plt axis plt.bar() plt.axis import figure pyplot highlight_text pypalettes plt.subplots() xlabel ylabel title legend colorbar savefig tight_layout grid set_xlim set_ylim plot scatter hist boxplot imshow cmap alpha bins tick_params annotate quiver contour barh stackplot subplots_adjust axhline axvline semilogx semilogy loglog polar streamplot hexbin pcolor tricontour errorbar clabel set_aspect violinplot set_axis_off spines text hatch plt axis plt.bar() plt.axis import figure pyplot highlight_text pypalettes plt.subplots() xlabel ylabel title legend colorbar savefig tight_layout grid set_xlim set_ylim plot scatter hist boxplot imshow cmap alpha bins tick_params annotate quiver contour barh stackplot subplots_adjust axhline axvline semilogx semilogy loglog polar streamplot hexbin pcolor tricontour errorbar clabel set_aspect violinplot set_axis_off spines text hatch plt axis plt.bar() plt.axis import figure pyplot highlight_text pypalettes plt.subplots() xlabel ylabel title legend colorbar savefig tight_layout grid set_xlim set_ylim plot scatter hist boxplot imshow cmap alpha bins tick_params annotate quiver contour barh stackplot subplots_adjust axhline axvline semilogx semilogy loglog polar streamplot hexbin pcolor tricontour errorbar clabel set_aspect violinplot set_axis_off spines text hatch plt axis plt.bar() plt.axis import figure pyplot highlight_text pypalettes plt.subplots() xlabel ylabel title legend colorbar savefig tight_layout grid set_xlim set_ylim plot scatter hist boxplot imshow cmap alpha bins tick_params annotate quiver contour barh stackplot subplots_adjust axhline axvline semilogx semilogy loglog polar streamplot hexbin pcolor tricontour errorbar clabel set_aspect violinplot set_axis_off spines text hatch plt axis plt.bar() plt.axis import figure pyplot highlight_text pypalettes plt.subplots() xlabel ylabel title legend colorbar savefig tight_layout grid set_xlim set_ylim plot scatter hist boxplot imshow cmap alpha bins tick_params annotate quiver contour barh stackplot subplots_adjust axhline axvline semilogx semilogy loglog polar streamplot hexbin pcolor tricontour errorbar clabel set_aspect violinplot set_axis_off spines text hatch plt axis plt.bar() plt.axis import figure pyplot highlight_text pypalettes plt.subplots() xlabel ylabel title legend colorbar savefig tight_layout grid set_xlim set_ylim plot scatter hist boxplot imshow cmap alpha bins tick_params annotate quiver contour barh stackplot subplots_adjust axhline axvline semilogx semilogy loglog polar streamplot hexbin pcolor tricontour errorbar clabel set_aspect violinplot set_axis_off spines text hatch plt axis plt.bar() plt.axis import figure pyplot highlight_text pypalettes plt.subplots() xlabel ylabel title legend colorbar savefig tight_layout grid set_xlim set_ylim plot scatter hist boxplot imshow cmap alpha bins tick_params annotate quiver contour barh stackplot subplots_adjust axhline axvline semilogx semilogy loglog polar streamplot hexbin pcolor tricontour errorbar clabel set_aspect violinplot set_axis_off spines text hatch plt axis plt.bar() plt.axis import figure pyplot highlight_text pypalettes plt.subplots() xlabel ylabel title legend colorbar savefig tight_layout grid set_xlim set_ylim plot scatter hist boxplot imshow cmap alpha bins tick_params annotate quiver contour barh stackplot subplots_adjust axhline axvline semilogx semilogy loglog polar streamplot hexbin pcolor tricontour errorbar clabel set_aspect violinplot set_axis_off spines text hatch plt axis plt.bar() plt.axis import figure pyplot highlight_text pypalettes plt.subplots() xlabel ylabel title legend colorbar savefig tight_layout grid set_xlim set_ylim plot scatter hist boxplot imshow cmap alpha bins tick_params annotate quiver contour barh stackplot subplots_adjust axhline axvline semilogx semilogy loglog polar streamplot hexbin pcolor tricontour errorbar clabel set_aspect violinplot set_axis_off spines text hatch plt axis plt.bar() plt.axis import figure pyplot highlight_text pypalettes plt.subplots() xlabel ylabel title legend colorbar savefig tight_layout grid set_xlim set_ylim plot scatter hist boxplot imshow cmap alpha bins tick_params annotate quiver contour barh stackplot subplots_adjust axhline axvline semilogx semilogy loglog polar streamplot hexbin pcolor tricontour errorbar clabel set_aspect violinplot set_axis_off spines text hatch plt axis plt.bar() plt.axis import figure pyplot highlight_text pypalettes plt.subplots() xlabel ylabel title legend colorbar savefig tight_layout grid set_xlim set_ylim plot scatter hist boxplot imshow cmap alpha bins tick_params annotate quiver contour barh stackplot subplots_adjust axhline axvline semilogx semilogy loglog polar streamplot hexbin pcolor tricontour errorbar clabel set_aspect violinplot set_axis_off spines text hatch plt axis plt.bar() plt.axis import figure pyplot highlight_text pypalettes plt.subplots() xlabel ylabel title legend colorbar savefig tight_layout grid set_xlim set_ylim plot scatter hist boxplot imshow cmap alpha bins tick_params annotate quiver contour barh stackplot subplots_adjust axhline axvline semilogx semilogy loglog polar streamplot hexbin pcolor tricontour errorbar clabel set_aspect violinplot set_axis_off spines text hatch plt axis plt.bar() plt.axis import figure pyplot highlight_text pypalettes plt.subplots() xlabel ylabel title legend colorbar savefig tight_layout grid set_xlim set_ylim plot scatter hist boxplot imshow cmap alpha bins tick_params annotate quiver contour barh stackplot subplots_adjust axhline axvline semilogx semilogy loglog polar streamplot hexbin pcolor tricontour errorbar clabel set_aspect violinplot set_axis_off spines text hatch plt axis plt.bar() plt.axis import figure pyplot highlight_text pypalettes plt.subplots() xlabel ylabel title legend colorbar savefig tight_layout grid set_xlim set_ylim plot scatter hist boxplot imshow cmap alpha bins tick_params annotate quiver contour barh stackplot subplots_adjust axhline axvline semilogx semilogy loglog polar streamplot hexbin pcolor tricontour errorbar clabel set_aspect violinplot set_axis_off spines text hatch plt axis plt.bar() plt.axis import figure pyplot highlight_text pypalettes plt.subplots() xlabel ylabel title legend colorbar savefig tight_layout grid set_xlim set_ylim plot scatter hist boxplot imshow cmap alpha bins tick_params annotate quiver contour barh stackplot subplots_adjust axhline axvline semilogx semilogy loglog polar streamplot hexbin pcolor tricontour errorbar clabel set_aspect violinplot set_axis_off spines text hatch plt axis plt.bar() plt.axis import figure pyplot highlight_text pypalettes plt.subplots() xlabel ylabel title legend colorbar savefig tight_layout grid set_xlim set_ylim plot scatter hist boxplot imshow cmap alpha bins tick_params annotate quiver contour barh stackplot subplots_adjust axhline axvline semilogx semilogy loglog polar streamplot hexbin pcolor tricontour errorbar clabel set_aspect violinplot set_axis_off spines text hatch plt axis plt.bar() plt.axis import figure pyplot highlight_text pypalettes plt.subplots() xlabel ylabel title legend colorbar savefig tight_layout grid set_xlim set_ylim plot scatter hist boxplot imshow cmap alpha bins tick_params annotate quiver contour barh stackplot subplots_adjust axhline axvline semilogx semilogy loglog polar streamplot hexbin pcolor tricontour errorbar clabel set_aspect violinplot set_axis_off spines text hatch plt axis plt.bar() plt.axis import figure pyplot highlight_text pypalettes plt.subplots() xlabel ylabel title legend colorbar savefig tight_layout grid set_xlim set_ylim plot scatter hist boxplot imshow cmap alpha bins tick_params annotate quiver contour barh stackplot subplots_adjust axhline axvline semilogx semilogy loglog polar streamplot hexbin pcolor tricontour errorbar clabel set_aspect violinplot set_axis_off spines text hatch plt axis plt.bar() plt.axis import figure pyplot highlight_text pypalettes plt.subplots() xlabel ylabel title legend colorbar savefig tight_layout grid set_xlim set_ylim plot scatter hist boxplot imshow cmap alpha bins tick_params annotate quiver contour barh stackplot subplots_adjust axhline axvline semilogx semilogy loglog polar streamplot hexbin pcolor tricontour errorbar clabel set_aspect violinplot set_axis_off spines text hatch plt axis plt.bar() plt.axis import figure pyplot highlight_text pypalettes plt.subplots() xlabel ylabel title legend colorbar savefig tight_layout grid set_xlim set_ylim plot scatter hist boxplot imshow cmap alpha bins tick_params annotate quiver contour barh stackplot subplots_adjust axhline axvline semilogx semilogy loglog polar streamplot hexbin pcolor tricontour errorbar clabel set_aspect violinplot set_axis_off spines text hatch plt axis plt.bar() plt.axis import figure pyplot highlight_text pypalettes plt.subplots() xlabel ylabel title legend colorbar savefig tight_layout grid set_xlim set_ylim plot scatter hist boxplot imshow cmap alpha bins tick_params annotate quiver contour barh stackplot subplots_adjust axhline axvline semilogx semilogy loglog polar streamplot hexbin pcolor tricontour errorbar clabel set_aspect violinplot set_axis_off spines text hatch plt axis plt.bar() plt.axis import figure pyplot highlight_text pypalettes plt.subplots() xlabel ylabel title legend colorbar savefig tight_layout grid set_xlim set_ylim plot scatter hist boxplot imshow cmap alpha bins tick_params annotate quiver contour barh stackplot subplots_adjust axhline axvline semilogx semilogy loglog polar streamplot hexbin pcolor tricontour errorbar clabel set_aspect violinplot set_axis_off spines text hatch plt axis plt.bar() plt.axis import figure pyplot highlight_text pypalettes plt.subplots() xlabel ylabel title legend colorbar savefig tight_layout grid set_xlim set_ylim plot scatter hist boxplot imshow cmap alpha bins tick_params annotate quiver contour barh stackplot subplots_adjust axhline axvline semilogx semilogy loglog polar streamplot hexbin pcolor tricontour errorbar clabel set_aspect violinplot set_axis_off spines text hatch plt axis plt.bar() plt.axis import figure pyplot highlight_text pypalettes plt.subplots() xlabel ylabel title legend colorbar savefig tight_layout grid set_xlim set_ylim plot scatter hist boxplot imshow cmap alpha bins tick_params annotate quiver contour barh stackplot subplots_adjust axhline axvline semilogx semilogy loglog polar streamplot hexbin pcolor tricontour errorbar clabel set_aspect violinplot set_axis_off spines text hatch plt axis plt.bar() plt.axis import figure pyplot highlight_text pypalettes plt.subplots() xlabel ylabel title legend colorbar savefig tight_layout grid set_xlim set_ylim plot scatter hist boxplot imshow cmap alpha bins tick_params annotate quiver contour barh stackplot subplots_adjust axhline axvline semilogx semilogy loglog polar streamplot hexbin pcolor tricontour errorbar clabel set_aspect violinplot set_axis_off spines text hatch plt axis plt.bar() plt.axis import figure pyplot highlight_text pypalettes plt.subplots() xlabel ylabel title legend colorbar savefig tight_layout grid set_xlim set_ylim plot scatter hist boxplot imshow cmap alpha bins tick_params annotate quiver contour barh stackplot subplots_adjust axhline axvline semilogx semilogy loglog polar streamplot hexbin pcolor tricontour errorbar clabel set_aspect violinplot set_axis_off spines text hatch plt axis plt.bar() plt.axis import figure pyplot highlight_text pypalettes plt.subplots() xlabel ylabel title legend colorbar savefig tight_layout grid set_xlim set_ylim plot scatter hist boxplot imshow cmap alpha bins tick_params annotate quiver contour barh stackplot subplots_adjust axhline axvline semilogx semilogy loglog polar streamplot hexbin pcolor tricontour errorbar clabel set_aspect violinplot set_axis_off spines text hatch plt axis plt.bar() plt.axis import figure pyplot highlight_text pypalettes plt.subplots() xlabel ylabel title legend colorbar savefig tight_layout grid set_xlim set_ylim plot scatter hist boxplot imshow cmap alpha bins tick_params annotate quiver contour barh stackplot subplots_adjust axhline axvline semilogx semilogy loglog polar streamplot hexbin pcolor tricontour errorbar clabel set_aspect violinplot set_axis_off spines text hatch plt axis plt.bar() plt.axis import figure pyplot highlight_text pypalettes plt.subplots() xlabel ylabel title legend colorbar savefig tight_layout grid set_xlim set_ylim plot scatter hist boxplot imshow cmap alpha bins tick_params annotate quiver contour barh stackplot subplots_adjust axhline axvline semilogx semilogy loglog polar streamplot hexbin pcolor tricontour errorbar clabel set_aspect violinplot set_axis_off spines text hatch plt axis plt.bar() plt.axis import figure pyplot highlight_text pypalettes plt.subplots() xlabel ylabel title legend colorbar savefig tight_layout grid set_xlim set_ylim plot scatter hist boxplot imshow cmap alpha bins tick_params annotate quiver contour barh stackplot subplots_adjust axhline axvline semilogx semilogy loglog polar streamplot hexbin pcolor tricontour errorbar clabel set_aspect violinplot set_axis_off spines text hatch plt axis plt.bar() plt.axis import figure pyplot highlight_text pypalettes plt.subplots() xlabel ylabel title legend colorbar savefig tight_layout grid set_xlim set_ylim plot scatter hist boxplot imshow cmap alpha bins tick_params annotate quiver contour barh stackplot subplots_adjust axhline axvline semilogx semilogy loglog polar streamplot hexbin pcolor tricontour errorbar clabel set_aspect violinplot set_axis_off spines text hatch plt axis plt.bar() plt.axis import figure pyplot highlight_text pypalettes plt.subplots() xlabel ylabel title legend colorbar savefig tight_layout grid set_xlim set_ylim plot scatter hist boxplot imshow cmap alpha bins tick_params annotate quiver contour barh stackplot subplots_adjust axhline axvline semilogx semilogy loglog polar streamplot hexbin pcolor tricontour errorbar clabel set_aspect violinplot set_axis_off spines text hatch plt axis plt.bar() plt.axis import figure pyplot highlight_text pypalettes plt.subplots() xlabel ylabel title legend colorbar savefig tight_layout grid set_xlim set_ylim plot scatter hist boxplot imshow cmap alpha bins tick_params annotate quiver contour barh stackplot subplots_adjust axhline axvline semilogx semilogy loglog polar streamplot hexbin pcolor tricontour errorbar clabel set_aspect violinplot set_axis_off spines text hatch plt axis plt.bar() plt.axis import figure pyplot highlight_text pypalettes plt.subplots() xlabel ylabel title legend colorbar savefig tight_layout grid set_xlim set_ylim plot scatter hist boxplot imshow cmap alpha bins tick_params annotate quiver contour barh stackplot subplots_adjust axhline axvline semilogx semilogy loglog polar streamplot hexbin pcolor tricontour errorbar clabel set_aspect violinplot set_axis_off spines text hatch plt axis plt.bar() plt.axis import figure pyplot highlight_text pypalettes plt.subplots() xlabel ylabel title legend colorbar savefig tight_layout grid set_xlim set_ylim plot scatter hist boxplot imshow cmap alpha bins tick_params annotate quiver contour barh stackplot subplots_adjust axhline axvline semilogx semilogy loglog polar streamplot hexbin pcolor tricontour errorbar clabel set_aspect violinplot set_axis_off spines text hatch plt axis plt.bar() plt.axis import figure pyplot highlight_text pypalettes plt.subplots() xlabel ylabel title legend colorbar savefig tight_layout grid set_xlim set_ylim plot scatter hist boxplot imshow cmap alpha bins tick_params annotate quiver contour barh stackplot subplots_adjust axhline axvline semilogx semilogy loglog polar streamplot hexbin pcolor tricontour errorbar clabel set_aspect violinplot set_axis_off spines text hatch plt axis plt.bar() plt.axis import figure pyplot highlight_text pypalettes plt.subplots() xlabel ylabel title legend colorbar savefig tight_layout grid set_xlim set_ylim plot scatter hist boxplot imshow cmap alpha bins tick_params annotate quiver contour barh stackplot subplots_adjust axhline axvline semilogx semilogy loglog polar streamplot hexbin pcolor tricontour errorbar clabel set_aspect violinplot set_axis_off spines text hatch plt axis plt.bar() plt.axis import figure pyplot highlight_text pypalettes plt.subplots() xlabel ylabel title legend colorbar savefig tight_layout grid set_xlim set_ylim plot scatter hist boxplot imshow cmap alpha bins tick_params annotate quiver contour barh stackplot subplots_adjust axhline axvline semilogx semilogy loglog polar streamplot hexbin pcolor tricontour errorbar clabel set_aspect violinplot set_axis_off spines text hatch plt axis plt.bar() plt.axis import figure pyplot highlight_text pypalettes plt.subplots() xlabel ylabel title legend colorbar savefig tight_layout grid set_xlim set_ylim plot scatter hist boxplot imshow cmap alpha bins tick_params annotate quiver contour barh stackplot subplots_adjust axhline axvline semilogx semilogy loglog polar streamplot hexbin pcolor tricontour errorbar clabel set_aspect violinplot set_axis_off spines text hatch plt axis plt.bar() plt.axis import figure pyplot highlight_text pypalettes plt.subplots() xlabel ylabel title legend colorbar savefig tight_layout grid set_xlim set_ylim plot scatter hist boxplot imshow cmap alpha bins tick_params annotate quiver contour barh stackplot subplots_adjust axhline axvline semilogx semilogy loglog polar streamplot hexbin pcolor tricontour errorbar clabel set_aspect violinplot set_axis_off spines text hatch plt axis plt.bar() plt.axis import figure pyplot highlight_text pypalettes plt.subplots() xlabel ylabel title legend colorbar savefig tight_layout grid set_xlim set_ylim plot scatter hist boxplot imshow cmap alpha bins tick_params annotate quiver contour barh stackplot subplots_adjust axhline axvline semilogx semilogy loglog polar streamplot hexbin pcolor tricontour errorbar clabel set_aspect violinplot set_axis_off spines text hatch plt axis plt.bar() plt.axis import figure pyplot highlight_text pypalettes plt.subplots() xlabel ylabel title legend colorbar savefig tight_layout grid set_xlim set_ylim plot scatter hist boxplot imshow cmap alpha bins tick_params annotate quiver contour barh stackplot subplots_adjust axhline axvline semilogx semilogy loglog polar streamplot hexbin pcolor tricontour errorbar clabel set_aspect violinplot set_axis_off spines text hatch plt axis plt.bar() plt.axis import figure pyplot highlight_text pypalettes plt.subplots() xlabel ylabel title legend colorbar savefig tight_layout grid set_xlim set_ylim plot scatter hist boxplot imshow cmap alpha bins tick_params annotate quiver contour barh stackplot subplots_adjust axhline axvline semilogx semilogy loglog polar streamplot hexbin pcolor tricontour errorbar clabel set_aspect violinplot set_axis_off spines text hatch plt axis plt.bar() plt.axis import figure pyplot highlight_text pypalettes plt.subplots() xlabel ylabel title legend colorbar savefig tight_layout grid set_xlim set_ylim plot scatter hist boxplot imshow cmap alpha bins tick_params annotate quiver contour barh stackplot subplots_adjust axhline axvline semilogx semilogy loglog polar streamplot hexbin pcolor tricontour errorbar clabel set_aspect violinplot set_axis_off spines text hatch plt axis plt.bar() plt.axis import figure pyplot highlight_text pypalettes plt.subplots() xlabel ylabel title legend colorbar savefig tight_layout grid set_xlim set_ylim plot scatter hist boxplot imshow cmap alpha bins tick_params annotate quiver contour barh stackplot subplots_adjust axhline axvline semilogx semilogy loglog polar streamplot hexbin pcolor tricontour errorbar clabel set_aspect violinplot set_axis_off spines text hatch plt axis plt.bar() plt.axis import figure pyplot highlight_text pypalettes plt.subplots() xlabel ylabel title legend colorbar savefig tight_layout grid set_xlim set_ylim plot scatter hist boxplot imshow cmap alpha bins tick_params annotate quiver contour barh stackplot subplots_adjust axhline axvline semilogx semilogy loglog polar streamplot hexbin pcolor tricontour errorbar clabel set_aspect violinplot set_axis_off spines text hatch plt axis plt.bar() plt.axis import figure pyplot highlight_text pypalettes plt.subplots() xlabel ylabel title legend colorbar savefig tight_layout grid set_xlim set_ylim plot scatter hist boxplot imshow cmap alpha bins tick_params annotate quiver contour barh stackplot subplots_adjust axhline axvline semilogx semilogy loglog polar streamplot hexbin pcolor tricontour errorbar clabel set_aspect violinplot set_axis_off spines text hatch plt axis plt.bar() plt.axis import figure pyplot highlight_text pypalettes plt.subplots() xlabel ylabel title legend colorbar savefig tight_layout grid set_xlim set_ylim plot scatter hist boxplot imshow cmap alpha bins tick_params annotate quiver contour barh stackplot subplots_adjust axhline axvline semilogx semilogy loglog polar streamplot hexbin pcolor tricontour errorbar clabel set_aspect violinplot set_axis_off spines text hatch plt axis plt.bar() plt.axis import figure pyplot highlight_text pypalettes plt.subplots() xlabel ylabel title legend colorbar savefig tight_layout grid set_xlim set_ylim plot scatter hist boxplot imshow cmap alpha bins tick_params annotate quiver contour barh stackplot subplots_adjust axhline axvline semilogx semilogy loglog polar streamplot hexbin pcolor tricontour errorbar clabel set_aspect violinplot set_axis_off spines text hatch plt axis plt.bar() plt.axis import figure pyplot highlight_text pypalettes plt.subplots() xlabel ylabel title legend colorbar savefig tight_layout grid set_xlim set_ylim plot scatter hist boxplot imshow cmap alpha bins tick_params annotate quiver contour barh stackplot subplots_adjust axhline axvline semilogx semilogy loglog polar streamplot hexbin pcolor tricontour errorbar clabel set_aspect violinplot set_axis_off spines text hatch plt axis plt.bar() plt.axis import figure pyplot highlight_text pypalettes plt.subplots() xlabel ylabel title legend colorbar savefig tight_layout grid set_xlim set_ylim plot scatter hist boxplot imshow cmap alpha bins tick_params annotate quiver contour barh stackplot subplots_adjust axhline axvline semilogx semilogy loglog polar streamplot hexbin pcolor tricontour errorbar clabel set_aspect violinplot set_axis_off spines text hatch plt axis plt.bar() plt.axis import figure pyplot highlight_text pypalettes plt.subplots() xlabel ylabel title legend colorbar savefig tight_layout grid set_xlim set_ylim plot scatter hist boxplot imshow cmap alpha bins tick_params annotate quiver contour barh stackplot subplots_adjust axhline axvline semilogx semilogy loglog polar streamplot hexbin pcolor tricontour errorbar clabel set_aspect violinplot set_axis_off spines text hatch plt axis plt.bar() plt.axis import figure pyplot highlight_text pypalettes plt.subplots() xlabel ylabel title legend colorbar savefig tight_layout grid set_xlim set_ylim plot scatter hist boxplot imshow cmap alpha bins tick_params annotate quiver contour barh stackplot subplots_adjust axhline axvline semilogx semilogy loglog polar streamplot hexbin pcolor tricontour errorbar clabel set_aspect violinplot set_axis_off spines text hatch plt axis plt.bar() plt.axis import figure pyplot highlight_text pypalettes plt.subplots() xlabel ylabel title legend colorbar savefig tight_layout grid set_xlim set_ylim plot scatter hist boxplot imshow cmap alpha bins tick_params annotate quiver contour barh stackplot subplots_adjust axhline axvline semilogx semilogy loglog polar streamplot hexbin pcolor tricontour errorbar clabel set_aspect violinplot set_axis_off spines text hatch plt axis plt.bar() plt.axis import figure pyplot highlight_text pypalettes plt.subplots() xlabel ylabel title legend colorbar savefig tight_layout grid set_xlim set_ylim plot scatter hist boxplot imshow cmap alpha bins tick_params annotate quiver contour barh stackplot subplots_adjust axhline axvline semilogx semilogy loglog polar streamplot hexbin pcolor tricontour errorbar clabel set_aspect violinplot set_axis_off spines text hatch plt axis plt.bar() plt.axis import figure pyplot highlight_text pypalettes plt.subplots() xlabel ylabel title legend colorbar savefig tight_layout grid set_xlim set_ylim plot scatter hist boxplot imshow cmap alpha bins tick_params annotate quiver contour barh stackplot subplots_adjust axhline axvline semilogx semilogy loglog polar streamplot hexbin pcolor tricontour errorbar clabel set_aspect violinplot set_axis_off spines text hatch plt axis plt.bar() plt.axis import figure pyplot highlight_text pypalettes plt.subplots() xlabel ylabel title legend colorbar savefig tight_layout grid set_xlim set_ylim plot scatter hist boxplot imshow cmap alpha bins tick_params annotate quiver contour barh stackplot subplots_adjust axhline axvline semilogx semilogy loglog polar streamplot hexbin pcolor tricontour errorbar clabel set_aspect violinplot set_axis_off spines text hatch plt axis plt.bar() plt.axis import figure pyplot highlight_text pypalettes plt.subplots() xlabel ylabel title legend colorbar savefig tight_layout grid set_xlim set_ylim plot scatter hist boxplot imshow cmap alpha bins tick_params annotate quiver contour barh stackplot subplots_adjust axhline axvline semilogx semilogy loglog polar streamplot hexbin pcolor tricontour errorbar clabel set_aspect violinplot set_axis_off spines text hatch plt axis plt.bar() plt.axis import figure pyplot highlight_text pypalettes plt.subplots() xlabel ylabel title legend colorbar savefig tight_layout grid set_xlim set_ylim plot scatter hist boxplot imshow cmap alpha bins tick_params annotate quiver contour barh stackplot subplots_adjust axhline axvline semilogx semilogy loglog polar streamplot hexbin pcolor tricontour errorbar clabel set_aspect violinplot set_axis_off spines text hatch plt axis plt.bar() plt.axis import figure pyplot highlight_text pypalettes plt.subplots() xlabel ylabel title legend colorbar savefig tight_layout grid set_xlim set_ylim plot scatter hist boxplot imshow cmap alpha bins tick_params annotate quiver contour barh stackplot subplots_adjust axhline axvline semilogx semilogy loglog polar streamplot hexbin pcolor tricontour errorbar clabel set_aspect violinplot set_axis_off spines text hatch plt axis plt.bar() plt.axis import figure pyplot highlight_text pypalettes plt.subplots() xlabel ylabel title legend colorbar savefig tight_layout grid set_xlim set_ylim plot scatter hist boxplot imshow cmap alpha bins tick_params annotate quiver contour barh stackplot subplots_adjust axhline axvline semilogx semilogy loglog polar streamplot hexbin pcolor tricontour errorbar clabel set_aspect violinplot set_axis_off spines text hatch plt axis plt.bar() plt.axis import figure pyplot highlight_text pypalettes plt.subplots() xlabel ylabel title legend colorbar savefig tight_layout grid set_xlim set_ylim plot scatter hist boxplot imshow cmap alpha bins tick_params annotate quiver contour barh stackplot subplots_adjust axhline axvline semilogx semilogy loglog polar streamplot hexbin pcolor tricontour errorbar clabel set_aspect violinplot set_axis_off spines text hatch plt axis plt.bar() plt.axis import figure pyplot highlight_text pypalettes plt.subplots() xlabel ylabel title legend colorbar savefig tight_layout grid set_xlim set_ylim plot scatter hist boxplot imshow cmap alpha bins tick_params annotate quiver contour barh stackplot subplots_adjust axhline axvline semilogx semilogy loglog polar streamplot hexbin pcolor tricontour errorbar clabel set_aspect violinplot set_axis_off spines text hatch plt axis plt.bar() plt.axis import figure pyplot highlight_text pypalettes plt.subplots() xlabel ylabel title legend colorbar savefig tight_layout grid set_xlim set_ylim plot scatter hist boxplot imshow cmap alpha bins tick_params annotate quiver contour barh stackplot subplots_adjust axhline axvline semilogx semilogy loglog polar streamplot hexbin pcolor tricontour errorbar clabel set_aspect violinplot set_axis_off spines text hatch plt axis plt.bar() plt.axis import figure pyplot highlight_text pypalettes plt.subplots() xlabel ylabel title legend colorbar savefig tight_layout grid set_xlim set_ylim plot scatter hist boxplot imshow cmap alpha bins tick_params annotate quiver contour barh stackplot subplots_adjust axhline axvline semilogx semilogy loglog polar streamplot hexbin pcolor tricontour errorbar clabel set_aspect violinplot set_axis_off spines text hatch plt axis plt.bar() plt.axis import figure pyplot highlight_text pypalettes plt.subplots() xlabel ylabel title legend colorbar savefig tight_layout grid set_xlim set_ylim plot scatter hist boxplot imshow cmap alpha bins tick_params annotate quiver contour barh stackplot subplots_adjust axhline axvline semilogx semilogy loglog polar streamplot hexbin pcolor tricontour errorbar clabel set_aspect violinplot set_axis_off spines text hatch plt axis plt.bar() plt.axis import figure pyplot highlight_text pypalettes plt.subplots() xlabel ylabel title legend colorbar savefig tight_layout grid set_xlim set_ylim plot scatter hist boxplot imshow cmap alpha bins tick_params annotate quiver contour barh stackplot subplots_adjust axhline axvline semilogx semilogy loglog polar streamplot hexbin pcolor tricontour errorbar clabel set_aspect violinplot set_axis_off spines text hatch plt axis plt.bar() plt.axis import figure pyplot highlight_text pypalettes plt.subplots() xlabel ylabel title legend colorbar savefig tight_layout grid set_xlim set_ylim plot scatter hist boxplot imshow cmap alpha bins tick_params annotate quiver contour barh stackplot subplots_adjust axhline axvline semilogx semilogy loglog polar streamplot hexbin pcolor tricontour errorbar clabel set_aspect violinplot set_axis_off spines text hatch plt axis plt.bar() plt.axis import figure pyplot highlight_text pypalettes plt.subplots() xlabel ylabel title legend colorbar savefig tight_layout grid set_xlim set_ylim plot scatter hist boxplot imshow cmap alpha bins tick_params annotate quiver contour barh stackplot subplots_adjust axhline axvline semilogx semilogy loglog polar streamplot hexbin pcolor tricontour errorbar clabel set_aspect violinplot set_axis_off spines text hatch plt axis plt.bar() plt.axis import figure pyplot highlight_text pypalettes plt.subplots() xlabel ylabel title legend colorbar savefig tight_layout grid set_xlim set_ylim plot scatter hist boxplot imshow cmap alpha bins tick_params annotate quiver contour barh stackplot subplots_adjust axhline axvline semilogx semilogy loglog polar streamplot hexbin pcolor tricontour errorbar clabel set_aspect violinplot set_axis_off spines text hatch plt axis plt.bar() plt.axis import figure pyplot highlight_text pypalettes plt.subplots() xlabel ylabel title legend colorbar savefig tight_layout grid set_xlim set_ylim plot scatter hist boxplot imshow cmap alpha bins tick_params annotate quiver contour barh stackplot subplots_adjust axhline axvline semilogx semilogy loglog polar streamplot hexbin pcolor tricontour errorbar clabel set_aspect violinplot set_axis_off spines text hatch plt axis plt.bar() plt.axis import figure pyplot highlight_text pypalettes plt.subplots() xlabel ylabel title legend colorbar savefig tight_layout grid set_xlim set_ylim plot scatter hist boxplot imshow cmap alpha bins tick_params annotate quiver contour barh stackplot subplots_adjust axhline axvline semilogx semilogy loglog polar streamplot hexbin pcolor tricontour errorbar clabel set_aspect violinplot set_axis_off spines text hatch plt axis plt.bar() plt.axis import figure pyplot highlight_text pypalettes plt.subplots() xlabel ylabel title legend colorbar savefig tight_layout grid set_xlim set_ylim plot scatter hist boxplot imshow cmap alpha bins tick_params annotate quiver contour barh stackplot subplots_adjust axhline axvline semilogx semilogy loglog polar streamplot hexbin pcolor tricontour errorbar clabel set_aspect violinplot set_axis_off spines text hatch plt axis plt.bar() plt.axis import figure pyplot highlight_text pypalettes plt.subplots() xlabel ylabel title legend colorbar savefig tight_layout grid set_xlim set_ylim plot scatter hist boxplot imshow cmap alpha bins tick_params annotate quiver contour barh stackplot subplots_adjust axhline axvline semilogx semilogy loglog polar streamplot hexbin pcolor tricontour errorbar clabel set_aspect violinplot set_axis_off spines text hatch plt axis plt.bar() plt.axis import figure pyplot highlight_text pypalettes plt.subplots() xlabel ylabel title legend colorbar savefig tight_layout grid set_xlim set_ylim plot scatter hist boxplot imshow cmap alpha bins tick_params annotate quiver contour barh stackplot subplots_adjust axhline axvline semilogx semilogy loglog polar streamplot hexbin pcolor tricontour errorbar clabel set_aspect violinplot set_axis_off spines text hatch plt axis plt.bar() plt.axis import figure pyplot highlight_text pypalettes plt.subplots() xlabel ylabel title legend colorbar savefig tight_layout grid set_xlim set_ylim plot scatter hist boxplot imshow cmap alpha bins tick_params annotate quiver contour barh stackplot subplots_adjust axhline axvline semilogx semilogy loglog polar streamplot hexbin pcolor tricontour errorbar clabel set_aspect violinplot set_axis_off spines text hatch plt axis plt.bar() plt.axis import figure pyplot highlight_text pypalettes plt.subplots() xlabel ylabel title legend colorbar savefig tight_layout grid set_xlim set_ylim plot scatter hist boxplot imshow cmap alpha bins tick_params annotate quiver contour barh stackplot subplots_adjust axhline axvline semilogx semilogy loglog polar streamplot hexbin pcolor tricontour errorbar clabel set_aspect violinplot set_axis_off spines text hatch plt axis plt.bar() plt.axis import figure pyplot highlight_text pypalettes plt.subplots() xlabel ylabel title legend colorbar savefig tight_layout grid set_xlim set_ylim plot scatter hist boxplot imshow cmap alpha bins tick_params annotate quiver contour barh stackplot subplots_adjust axhline axvline semilogx semilogy loglog polar streamplot hexbin pcolor tricontour errorbar clabel set_aspect violinplot set_axis_off spines text hatch plt axis plt.bar() plt.axis import figure pyplot highlight_text pypalettes plt.subplots() xlabel ylabel title legend colorbar savefig tight_layout grid set_xlim set_ylim plot scatter hist boxplot imshow cmap alpha bins tick_params annotate quiver contour barh stackplot subplots_adjust axhline axvline semilogx semilogy loglog polar streamplot hexbin pcolor tricontour errorbar clabel set_aspect violinplot set_axis_off spines text hatch plt axis plt.bar() plt.axis import figure pyplot highlight_text pypalettes plt.subplots() xlabel ylabel title legend colorbar savefig tight_layout grid set_xlim set_ylim plot scatter hist boxplot imshow cmap alpha bins tick_params annotate quiver contour barh stackplot subplots_adjust axhline axvline semilogx semilogy loglog polar streamplot hexbin pcolor tricontour errorbar clabel set_aspect violinplot set_axis_off spines text hatch plt axis plt.bar() plt.axis import figure pyplot highlight_text pypalettes plt.subplots() xlabel ylabel title legend colorbar savefig tight_layout grid set_xlim set_ylim plot scatter hist boxplot imshow cmap alpha bins tick_params annotate quiver contour barh stackplot subplots_adjust axhline axvline semilogx semilogy loglog polar streamplot hexbin pcolor tricontour errorbar clabel set_aspect violinplot set_axis_off spines text hatch plt axis plt.bar() plt.axis import figure pyplot highlight_text pypalettes plt.subplots() xlabel ylabel title legend colorbar savefig tight_layout grid set_xlim set_ylim plot scatter hist boxplot imshow cmap alpha bins tick_params annotate quiver contour barh stackplot subplots_adjust axhline axvline semilogx semilogy loglog polar streamplot hexbin pcolor tricontour errorbar clabel set_aspect violinplot set_axis_off spines text hatch plt axis plt.bar() plt.axis import figure pyplot highlight_text pypalettes plt.subplots() xlabel ylabel title legend colorbar savefig tight_layout grid set_xlim set_ylim plot scatter hist boxplot imshow cmap alpha bins tick_params annotate quiver contour barh stackplot subplots_adjust axhline axvline semilogx semilogy loglog polar streamplot hexbin pcolor tricontour errorbar clabel set_aspect violinplot set_axis_off spines text hatch plt axis plt.bar() plt.axis import figure pyplot highlight_text pypalettes plt.subplots() xlabel ylabel title legend colorbar savefig tight_layout grid set_xlim set_ylim plot scatter hist boxplot imshow cmap alpha bins tick_params annotate quiver contour barh stackplot subplots_adjust axhline axvline semilogx semilogy loglog polar streamplot hexbin pcolor tricontour errorbar clabel set_aspect violinplot set_axis_off spines text hatch plt axis plt.bar() plt.axis import figure pyplot highlight_text pypalettes plt.subplots() xlabel ylabel title legend colorbar savefig tight_layout grid set_xlim set_ylim plot scatter hist boxplot imshow cmap alpha bins tick_params annotate quiver contour barh stackplot subplots_adjust axhline axvline semilogx semilogy loglog polar streamplot hexbin pcolor tricontour errorbar clabel set_aspect violinplot set_axis_off spines text hatch plt axis plt.bar() plt.axis import figure pyplot highlight_text pypalettes plt.subplots() xlabel ylabel title legend colorbar savefig tight_layout grid set_xlim set_ylim plot scatter hist boxplot imshow cmap alpha bins tick_params annotate quiver contour barh stackplot subplots_adjust axhline axvline semilogx semilogy loglog polar streamplot hexbin pcolor tricontour errorbar clabel set_aspect violinplot set_axis_off spines text hatch plt axis plt.bar() plt.axis import figure pyplot highlight_text pypalettes plt.subplots() xlabel ylabel title legend colorbar savefig tight_layout grid set_xlim set_ylim plot scatter hist boxplot imshow cmap alpha bins tick_params annotate quiver contour barh stackplot subplots_adjust axhline axvline semilogx semilogy loglog polar streamplot hexbin pcolor tricontour errorbar clabel set_aspect violinplot set_axis_off spines text hatch plt axis plt.bar() plt.axis import figure pyplot highlight_text pypalettes plt.subplots() xlabel ylabel title legend colorbar savefig tight_layout grid set_xlim set_ylim plot scatter hist boxplot imshow cmap alpha bins tick_params annotate quiver contour barh stackplot subplots_adjust axhline axvline semilogx semilogy loglog polar streamplot hexbin pcolor tricontour errorbar clabel set_aspect violinplot set_axis_off spines text hatch plt axis plt.bar() plt.axis import figure pyplot highlight_text pypalettes plt.subplots() xlabel ylabel title legend colorbar savefig tight_layout grid set_xlim set_ylim plot scatter hist boxplot imshow cmap alpha bins tick_params annotate quiver contour barh stackplot subplots_adjust axhline axvline semilogx semilogy loglog polar streamplot hexbin pcolor tricontour errorbar clabel set_aspect violinplot set_axis_off spines text hatch plt axis plt.bar() plt.axis import figure pyplot highlight_text pypalettes plt.subplots() xlabel ylabel title legend colorbar savefig tight_layout grid set_xlim set_ylim plot scatter hist boxplot imshow cmap alpha bins tick_params annotate quiver contour barh stackplot subplots_adjust axhline axvline semilogx semilogy loglog polar streamplot hexbin pcolor tricontour errorbar clabel set_aspect violinplot set_axis_off spines text hatch plt axis plt.bar() plt.axis import figure pyplot highlight_text pypalettes plt.subplots() xlabel ylabel title legend colorbar savefig tight_layout grid set_xlim set_ylim plot scatter hist boxplot imshow cmap alpha bins tick_params annotate quiver contour barh stackplot subplots_adjust axhline axvline semilogx semilogy loglog polar streamplot hexbin pcolor tricontour errorbar clabel set_aspect violinplot set_axis_off spines text hatch plt axis plt.bar() plt.axis import figure pyplot highlight_text pypalettes plt.subplots() xlabel ylabel title legend colorbar savefig tight_layout grid set_xlim set_ylim plot scatter hist boxplot imshow cmap alpha bins tick_params annotate quiver contour barh stackplot subplots_adjust axhline axvline semilogx semilogy loglog polar streamplot hexbin pcolor tricontour errorbar clabel set_aspect violinplot set_axis_off spines text hatch plt axis plt.bar() plt.axis import figure pyplot highlight_text pypalettes plt.subplots() xlabel ylabel title legend colorbar savefig tight_layout grid set_xlim set_ylim plot scatter hist boxplot imshow cmap alpha bins tick_params annotate quiver contour barh stackplot subplots_adjust axhline axvline semilogx semilogy loglog polar streamplot hexbin pcolor tricontour errorbar clabel set_aspect violinplot set_axis_off spines text hatch plt axis plt.bar() plt.axis import figure pyplot highlight_text pypalettes plt.subplots() xlabel ylabel title legend colorbar savefig tight_layout grid set_xlim set_ylim plot scatter hist boxplot imshow cmap alpha bins tick_params annotate quiver contour barh stackplot subplots_adjust axhline axvline semilogx semilogy loglog polar streamplot hexbin pcolor tricontour errorbar clabel set_aspect violinplot set_axis_off spines text hatch plt axis plt.bar() plt.axis import figure pyplot highlight_text pypalettes plt.subplots() xlabel ylabel title legend colorbar savefig tight_layout grid set_xlim set_ylim plot scatter hist boxplot imshow cmap alpha bins tick_params annotate quiver contour barh stackplot subplots_adjust axhline axvline semilogx semilogy loglog polar streamplot hexbin pcolor tricontour errorbar clabel set_aspect violinplot set_axis_off spines text hatch plt axis plt.bar() plt.axis import figure pyplot highlight_text pypalettes plt.subplots() xlabel ylabel title legend colorbar savefig tight_layout grid set_xlim set_ylim plot scatter hist boxplot imshow cmap alpha bins tick_params annotate quiver contour barh stackplot subplots_adjust axhline axvline semilogx semilogy loglog polar streamplot hexbin pcolor tricontour errorbar clabel set_aspect violinplot set_axis_off spines text hatch plt axis plt.bar() plt.axis import figure pyplot highlight_text pypalettes plt.subplots() xlabel ylabel title legend colorbar savefig tight_layout grid set_xlim set_ylim plot scatter hist boxplot imshow cmap alpha bins tick_params annotate quiver contour barh stackplot subplots_adjust axhline axvline semilogx semilogy loglog polar streamplot hexbin pcolor tricontour errorbar clabel set_aspect violinplot set_axis_off spines text hatch plt axis plt.bar() plt.axis import figure pyplot highlight_text pypalettes plt.subplots() xlabel ylabel title legend colorbar savefig tight_layout grid set_xlim set_ylim plot scatter hist boxplot imshow cmap alpha bins tick_params annotate quiver contour barh stackplot subplots_adjust axhline axvline semilogx semilogy loglog polar streamplot hexbin pcolor tricontour errorbar clabel set_aspect violinplot set_axis_off spines text hatch plt axis plt.bar() plt.axis import figure pyplot highlight_text pypalettes plt.subplots() xlabel ylabel title legend colorbar savefig tight_layout grid set_xlim set_ylim plot scatter hist boxplot imshow cmap alpha bins tick_params annotate quiver contour barh stackplot subplots_adjust axhline axvline semilogx semilogy loglog polar streamplot hexbin pcolor tricontour errorbar clabel set_aspect violinplot set_axis_off spines text hatch plt axis plt.bar() plt.axis import figure pyplot highlight_text pypalettes plt.subplots() xlabel ylabel title legend colorbar savefig tight_layout grid set_xlim set_ylim plot scatter hist boxplot imshow cmap alpha bins tick_params annotate quiver contour barh stackplot subplots_adjust axhline axvline semilogx semilogy loglog polar streamplot hexbin pcolor tricontour errorbar clabel set_aspect violinplot set_axis_off spines text hatch plt axis plt.bar() plt.axis import figure pyplot highlight_text pypalettes plt.subplots() xlabel ylabel title legend colorbar savefig tight_layout grid set_xlim set_ylim plot scatter hist boxplot imshow cmap alpha bins tick_params annotate quiver contour barh stackplot subplots_adjust axhline axvline semilogx semilogy loglog polar streamplot hexbin pcolor tricontour errorbar clabel set_aspect violinplot set_axis_off spines text hatch plt axis plt.bar() plt.axis import figure pyplot highlight_text pypalettes plt.subplots() xlabel ylabel title legend colorbar savefig tight_layout grid set_xlim set_ylim plot scatter hist boxplot imshow cmap alpha bins tick_params annotate quiver contour barh stackplot subplots_adjust axhline axvline semilogx semilogy loglog polar streamplot hexbin pcolor tricontour errorbar clabel set_aspect violinplot set_axis_off spines text hatch plt axis plt.bar() plt.axis import figure pyplot highlight_text pypalettes plt.subplots() xlabel ylabel title legend colorbar savefig tight_layout grid set_xlim set_ylim plot scatter hist boxplot imshow cmap alpha bins tick_params annotate quiver contour barh stackplot subplots_adjust axhline axvline semilogx semilogy loglog polar streamplot hexbin pcolor tricontour errorbar clabel set_aspect violinplot set_axis_off spines text hatch plt axis plt.bar() plt.axis import figure pyplot highlight_text pypalettes plt.subplots() xlabel ylabel title legend colorbar savefig tight_layout grid set_xlim set_ylim plot scatter hist boxplot imshow cmap alpha bins tick_params annotate quiver contour barh stackplot subplots_adjust axhline axvline semilogx semilogy loglog polar streamplot hexbin pcolor tricontour errorbar clabel set_aspect violinplot set_axis_off spines text hatch plt axis plt.bar() plt.axis import figure pyplot highlight_text pypalettes plt.subplots() xlabel ylabel title legend colorbar savefig tight_layout grid set_xlim set_ylim plot scatter hist boxplot imshow cmap alpha bins tick_params annotate quiver contour barh stackplot subplots_adjust axhline axvline semilogx semilogy loglog polar streamplot hexbin pcolor tricontour errorbar clabel set_aspect violinplot set_axis_off spines text hatch plt axis plt.bar() plt.axis import figure pyplot highlight_text pypalettes plt.subplots() xlabel ylabel title legend colorbar savefig tight_layout grid set_xlim set_ylim plot scatter hist boxplot imshow cmap alpha bins tick_params annotate quiver contour barh stackplot subplots_adjust axhline axvline semilogx semilogy loglog polar streamplot hexbin pcolor tricontour errorbar clabel set_aspect violinplot set_axis_off spines text hatch plt axis plt.bar() plt.axis import figure pyplot highlight_text pypalettes plt.subplots() xlabel ylabel title legend colorbar savefig tight_layout grid set_xlim set_ylim plot scatter hist boxplot imshow cmap alpha bins tick_params annotate quiver contour barh stackplot subplots_adjust axhline axvline semilogx semilogy loglog polar streamplot hexbin pcolor tricontour errorbar clabel set_aspect violinplot set_axis_off spines text hatch plt axis plt.bar() plt.axis import figure pyplot highlight_text pypalettes plt.subplots() xlabel ylabel title legend colorbar savefig tight_layout grid set_xlim set_ylim plot scatter hist boxplot imshow cmap alpha bins tick_params annotate quiver contour barh stackplot subplots_adjust axhline axvline semilogx semilogy loglog polar streamplot hexbin pcolor tricontour errorbar clabel set_aspect violinplot set_axis_off spines text hatch plt axis plt.bar() plt.axis import figure pyplot highlight_text pypalettes plt.subplots() xlabel ylabel title legend colorbar savefig tight_layout grid set_xlim set_ylim plot scatter hist boxplot imshow cmap alpha bins tick_params annotate quiver contour barh stackplot subplots_adjust axhline axvline semilogx semilogy loglog polar streamplot hexbin pcolor tricontour errorbar clabel set_aspect violinplot set_axis_off spines text hatch plt axis plt.bar() plt.axis import figure pyplot highlight_text pypalettes plt.subplots() xlabel ylabel title legend colorbar savefig tight_layout grid set_xlim set_ylim plot scatter hist boxplot imshow cmap alpha bins tick_params annotate quiver contour barh stackplot subplots_adjust axhline axvline semilogx semilogy loglog polar streamplot hexbin pcolor tricontour errorbar clabel set_aspect violinplot set_axis_off spines text hatch plt axis plt.bar() plt.axis import figure pyplot highlight_text pypalettes plt.subplots() xlabel ylabel title legend colorbar savefig tight_layout grid set_xlim set_ylim plot scatter hist boxplot imshow cmap alpha bins tick_params annotate quiver contour barh stackplot subplots_adjust axhline axvline semilogx semilogy loglog polar streamplot hexbin pcolor tricontour errorbar clabel set_aspect violinplot set_axis_off spines text hatch plt axis plt.bar() plt.axis import figure pyplot highlight_text pypalettes plt.subplots() xlabel ylabel title legend colorbar savefig tight_layout grid set_xlim set_ylim plot scatter hist boxplot imshow cmap alpha bins tick_params annotate quiver contour barh stackplot subplots_adjust axhline axvline semilogx semilogy loglog polar streamplot hexbin pcolor tricontour errorbar clabel set_aspect violinplot set_axis_off spines text hatch plt axis plt.bar() plt.axis import figure pyplot highlight_text pypalettes plt.subplots() xlabel ylabel title legend colorbar savefig tight_layout grid set_xlim set_ylim plot scatter hist boxplot imshow cmap alpha bins tick_params annotate quiver contour barh stackplot subplots_adjust axhline axvline semilogx semilogy loglog polar streamplot hexbin pcolor tricontour errorbar clabel set_aspect violinplot set_axis_off spines text hatch plt axis plt.bar() plt.axis import figure pyplot highlight_text pypalettes plt.subplots() xlabel ylabel title legend colorbar savefig tight_layout grid set_xlim set_ylim plot scatter hist boxplot imshow cmap alpha bins tick_params annotate quiver contour barh stackplot subplots_adjust axhline axvline semilogx semilogy loglog polar streamplot hexbin pcolor tricontour errorbar clabel set_aspect violinplot set_axis_off spines text hatch plt axis plt.bar() plt.axis import figure pyplot highlight_text pypalettes plt.subplots() xlabel ylabel title legend colorbar savefig tight_layout grid set_xlim set_ylim plot scatter hist boxplot imshow cmap alpha bins tick_params annotate quiver contour barh stackplot subplots_adjust axhline axvline semilogx semilogy loglog polar streamplot hexbin pcolor tricontour errorbar clabel set_aspect violinplot set_axis_off spines text hatch plt axis plt.bar() plt.axis import figure pyplot highlight_text pypalettes plt.subplots() xlabel ylabel title legend colorbar savefig tight_layout grid set_xlim set_ylim plot scatter hist boxplot imshow cmap alpha bins tick_params annotate quiver contour barh stackplot subplots_adjust axhline axvline semilogx semilogy loglog polar streamplot hexbin pcolor tricontour errorbar clabel set_aspect violinplot set_axis_off spines text hatch plt axis plt.bar() plt.axis import figure pyplot highlight_text pypalettes plt.subplots() xlabel ylabel title legend colorbar savefig tight_layout grid set_xlim set_ylim plot scatter hist boxplot imshow cmap alpha bins tick_params annotate quiver contour barh stackplot subplots_adjust axhline axvline semilogx semilogy loglog polar streamplot hexbin pcolor tricontour errorbar clabel set_aspect violinplot set_axis_off spines text hatch plt axis plt.bar() plt.axis import figure pyplot highlight_text pypalettes plt.subplots() xlabel ylabel title legend colorbar savefig tight_layout grid set_xlim set_ylim plot scatter hist boxplot imshow cmap alpha bins tick_params annotate quiver contour barh stackplot subplots_adjust axhline axvline semilogx semilogy loglog polar streamplot hexbin pcolor tricontour errorbar clabel set_aspect violinplot set_axis_off spines text hatch plt axis plt.bar() plt.axis import figure pyplot highlight_text pypalettes plt.subplots() xlabel ylabel title legend colorbar savefig tight_layout grid set_xlim set_ylim plot scatter hist boxplot imshow cmap alpha bins tick_params annotate quiver contour barh stackplot subplots_adjust axhline axvline semilogx semilogy loglog polar streamplot hexbin pcolor tricontour errorbar clabel set_aspect violinplot set_axis_off spines text hatch plt axis plt.bar() plt.axis import figure pyplot highlight_text pypalettes plt.subplots() xlabel ylabel title legend colorbar savefig tight_layout grid set_xlim set_ylim plot scatter hist boxplot imshow cmap alpha bins tick_params annotate quiver contour barh stackplot subplots_adjust axhline axvline semilogx semilogy loglog polar streamplot hexbin pcolor tricontour errorbar clabel set_aspect violinplot set_axis_off spines text hatch plt axis plt.bar() plt.axis import figure pyplot highlight_text pypalettes plt.subplots() xlabel ylabel title legend colorbar savefig tight_layout grid set_xlim set_ylim plot scatter hist boxplot imshow cmap alpha bins tick_params annotate quiver contour barh stackplot subplots_adjust axhline axvline semilogx semilogy loglog polar streamplot hexbin pcolor tricontour errorbar clabel set_aspect violinplot set_axis_off spines text hatch plt axis plt.bar() plt.axis import figure pyplot highlight_text pypalettes plt.subplots() xlabel ylabel title legend colorbar savefig tight_layout grid set_xlim set_ylim plot scatter hist boxplot imshow cmap alpha bins tick_params annotate quiver contour barh stackplot subplots_adjust axhline axvline semilogx semilogy loglog polar streamplot hexbin pcolor tricontour errorbar clabel set_aspect violinplot set_axis_off spines text hatch plt axis plt.bar() plt.axis import figure pyplot highlight_text pypalettes plt.subplots() xlabel ylabel title legend colorbar savefig tight_layout grid set_xlim set_ylim plot scatter hist boxplot imshow cmap alpha bins tick_params annotate quiver contour barh stackplot subplots_adjust axhline axvline semilogx semilogy loglog polar streamplot hexbin pcolor tricontour errorbar clabel set_aspect violinplot set_axis_off spines text hatch plt axis plt.bar() plt.axis import figure pyplot highlight_text pypalettes plt.subplots() xlabel ylabel title legend colorbar savefig tight_layout grid set_xlim set_ylim plot scatter hist boxplot imshow cmap alpha bins tick_params annotate quiver contour barh stackplot subplots_adjust axhline axvline semilogx semilogy loglog polar streamplot hexbin pcolor tricontour errorbar clabel set_aspect violinplot set_axis_off spines text hatch plt axis plt.bar() plt.axis import figure pyplot highlight_text pypalettes plt.subplots() xlabel ylabel title legend colorbar savefig tight_layout grid set_xlim set_ylim plot scatter hist boxplot imshow cmap alpha bins tick_params annotate quiver contour barh stackplot subplots_adjust axhline axvline semilogx semilogy loglog polar streamplot hexbin pcolor tricontour errorbar clabel set_aspect violinplot set_axis_off spines text hatch plt axis plt.bar() plt.axis import figure pyplot highlight_text pypalettes plt.subplots() xlabel ylabel title legend colorbar savefig tight_layout grid set_xlim set_ylim plot scatter hist boxplot imshow cmap alpha bins tick_params annotate quiver contour barh stackplot subplots_adjust axhline axvline semilogx semilogy loglog polar streamplot hexbin pcolor tricontour errorbar clabel set_aspect violinplot set_axis_off spines text hatch plt axis plt.bar() plt.axis import figure pyplot highlight_text pypalettes plt.subplots() xlabel ylabel title legend colorbar savefig tight_layout grid set_xlim set_ylim plot scatter hist boxplot imshow cmap alpha bins tick_params annotate quiver contour barh stackplot subplots_adjust axhline axvline semilogx semilogy loglog polar streamplot hexbin pcolor tricontour errorbar clabel set_aspect violinplot set_axis_off spines text hatch plt axis plt.bar() plt.axis import figure pyplot highlight_text pypalettes plt.subplots() xlabel ylabel title legend colorbar savefig tight_layout grid set_xlim set_ylim plot scatter hist boxplot imshow cmap alpha bins tick_params annotate quiver contour barh stackplot subplots_adjust axhline axvline semilogx semilogy loglog polar streamplot hexbin pcolor tricontour errorbar clabel set_aspect violinplot set_axis_off spines text hatch plt axis plt.bar() plt.axis import figure pyplot highlight_text pypalettes plt.subplots() xlabel ylabel title legend colorbar savefig tight_layout grid set_xlim set_ylim plot scatter hist boxplot imshow cmap alpha bins tick_params annotate quiver contour barh stackplot subplots_adjust axhline axvline semilogx semilogy loglog polar streamplot hexbin pcolor tricontour errorbar clabel set_aspect violinplot set_axis_off spines text hatch plt axis plt.bar() plt.axis import figure pyplot highlight_text pypalettes plt.subplots() xlabel ylabel title legend colorbar savefig tight_layout grid set_xlim set_ylim plot scatter hist boxplot imshow cmap alpha bins tick_params annotate quiver contour barh stackplot subplots_adjust axhline axvline semilogx semilogy loglog polar streamplot hexbin pcolor tricontour errorbar clabel set_aspect violinplot set_axis_off spines text hatch plt axis plt.bar() plt.axis import figure pyplot highlight_text pypalettes plt.subplots() xlabel ylabel title legend colorbar savefig tight_layout grid set_xlim set_ylim plot scatter hist boxplot imshow cmap alpha bins tick_params annotate quiver contour barh stackplot subplots_adjust axhline axvline semilogx semilogy loglog polar streamplot hexbin pcolor tricontour errorbar clabel set_aspect violinplot set_axis_off spines text hatch plt axis plt.bar() plt.axis import figure pyplot highlight_text pypalettes plt.subplots() xlabel ylabel title legend colorbar savefig tight_layout grid set_xlim set_ylim plot scatter hist boxplot imshow cmap alpha bins tick_params annotate quiver contour barh stackplot subplots_adjust axhline axvline semilogx semilogy loglog polar streamplot hexbin pcolor tricontour errorbar clabel set_aspect violinplot set_axis_off spines text hatch plt axis plt.bar() plt.axis import figure pyplot highlight_text pypalettes plt.subplots() xlabel ylabel title legend colorbar savefig tight_layout grid set_xlim set_ylim plot scatter hist boxplot imshow cmap alpha bins tick_params annotate quiver contour barh stackplot subplots_adjust axhline axvline semilogx semilogy loglog polar streamplot hexbin pcolor tricontour errorbar clabel set_aspect violinplot set_axis_off spines text hatch plt axis plt.bar() plt.axis import figure pyplot highlight_text pypalettes plt.subplots() xlabel ylabel title legend colorbar savefig tight_layout grid set_xlim set_ylim plot scatter hist boxplot imshow cmap alpha bins tick_params annotate quiver contour barh stackplot subplots_adjust axhline axvline semilogx semilogy loglog polar streamplot hexbin pcolor tricontour errorbar clabel set_aspect violinplot set_axis_off spines text hatch plt axis plt.bar() plt.axis import figure pyplot highlight_text pypalettes plt.subplots() xlabel ylabel title legend colorbar savefig tight_layout grid set_xlim set_ylim plot scatter hist boxplot imshow cmap alpha bins tick_params annotate quiver contour barh stackplot subplots_adjust axhline axvline semilogx semilogy loglog polar streamplot hexbin pcolor tricontour errorbar clabel set_aspect violinplot set_axis_off spines text hatch plt axis plt.bar() plt.axis import figure pyplot highlight_text pypalettes plt.subplots() xlabel ylabel title legend colorbar savefig tight_layout grid set_xlim set_ylim plot scatter hist boxplot imshow cmap alpha bins tick_params annotate quiver contour barh stackplot subplots_adjust axhline axvline semilogx semilogy loglog polar streamplot hexbin pcolor tricontour errorbar clabel set_aspect violinplot set_axis_off spines text hatch plt axis plt.bar() plt.axis import figure pyplot highlight_text pypalettes plt.subplots() xlabel ylabel title legend colorbar savefig tight_layout grid set_xlim set_ylim plot scatter hist boxplot imshow cmap alpha bins tick_params annotate quiver contour barh stackplot subplots_adjust axhline axvline semilogx semilogy loglog polar streamplot hexbin pcolor tricontour errorbar clabel set_aspect violinplot set_axis_off spines text hatch plt axis plt.bar() plt.axis import figure pyplot highlight_text pypalettes plt.subplots() xlabel ylabel title legend colorbar savefig tight_layout grid set_xlim set_ylim plot scatter hist boxplot imshow cmap alpha bins tick_params annotate quiver contour barh stackplot subplots_adjust axhline axvline semilogx semilogy loglog polar streamplot hexbin pcolor tricontour errorbar clabel set_aspect violinplot set_axis_off spines text hatch plt axis plt.bar() plt.axis import figure pyplot highlight_text pypalettes plt.subplots() xlabel ylabel title legend colorbar savefig tight_layout grid set_xlim set_ylim plot scatter hist boxplot imshow cmap alpha bins tick_params annotate quiver contour barh stackplot subplots_adjust axhline axvline semilogx semilogy loglog polar streamplot hexbin pcolor tricontour errorbar clabel set_aspect violinplot set_axis_off spines text hatch plt axis plt.bar() plt.axis import figure pyplot highlight_text pypalettes plt.subplots() xlabel ylabel title legend colorbar savefig tight_layout grid set_xlim set_ylim plot scatter hist boxplot imshow cmap alpha bins tick_params annotate quiver contour barh stackplot subplots_adjust axhline axvline semilogx semilogy loglog polar streamplot hexbin pcolor tricontour errorbar clabel set_aspect violinplot set_axis_off spines text hatch plt axis plt.bar() plt.axis import figure pyplot highlight_text pypalettes plt.subplots() xlabel ylabel title legend colorbar savefig tight_layout grid set_xlim set_ylim plot scatter hist boxplot imshow cmap alpha bins tick_params annotate quiver contour barh stackplot subplots_adjust axhline axvline semilogx semilogy loglog polar streamplot hexbin pcolor tricontour errorbar clabel set_aspect violinplot set_axis_off spines text hatch plt axis plt.bar() plt.axis import figure pyplot highlight_text pypalettes plt.subplots() xlabel ylabel title legend colorbar savefig tight_layout grid set_xlim set_ylim plot scatter hist boxplot imshow cmap alpha bins tick_params annotate quiver contour barh stackplot subplots_adjust axhline axvline semilogx semilogy loglog polar streamplot hexbin pcolor tricontour errorbar clabel set_aspect violinplot set_axis_off spines text hatch plt axis plt.bar() plt.axis import figure pyplot highlight_text pypalettes plt.subplots() xlabel ylabel title legend colorbar savefig tight_layout grid set_xlim set_ylim plot scatter hist boxplot imshow cmap alpha bins tick_params annotate quiver contour barh stackplot subplots_adjust axhline axvline semilogx semilogy loglog polar streamplot hexbin pcolor tricontour errorbar clabel set_aspect violinplot set_axis_off spines text hatch plt axis plt.bar() plt.axis import figure pyplot highlight_text pypalettes plt.subplots() xlabel ylabel title legend colorbar savefig tight_layout grid set_xlim set_ylim plot scatter hist boxplot imshow cmap alpha bins tick_params annotate quiver contour barh stackplot subplots_adjust axhline axvline semilogx semilogy loglog polar streamplot hexbin pcolor tricontour errorbar clabel set_aspect violinplot set_axis_off spines text hatch plt axis plt.bar() plt.axis import figure pyplot highlight_text pypalettes plt.subplots() xlabel ylabel title legend colorbar savefig tight_layout grid set_xlim set_ylim plot scatter hist boxplot imshow cmap alpha bins tick_params annotate quiver contour barh stackplot subplots_adjust axhline axvline semilogx semilogy loglog polar streamplot hexbin pcolor tricontour errorbar clabel set_aspect violinplot set_axis_off spines text hatch plt axis plt.bar() plt.axis import figure pyplot highlight_text pypalettes plt.subplots() xlabel ylabel title legend colorbar savefig tight_layout grid set_xlim set_ylim plot scatter hist boxplot imshow cmap alpha bins tick_params annotate quiver contour barh stackplot subplots_adjust axhline axvline semilogx semilogy loglog polar streamplot hexbin pcolor tricontour errorbar clabel set_aspect violinplot set_axis_off spines text hatch plt axis plt.bar() plt.axis import figure pyplot highlight_text pypalettes plt.subplots() xlabel ylabel title legend colorbar savefig tight_layout grid set_xlim set_ylim plot scatter hist boxplot imshow cmap alpha bins tick_params annotate quiver contour barh stackplot subplots_adjust axhline axvline semilogx semilogy loglog polar streamplot hexbin pcolor tricontour errorbar clabel set_aspect violinplot set_axis_off spines text hatch plt axis plt.bar() plt.axis import figure pyplot highlight_text pypalettes plt.subplots() xlabel ylabel title legend colorbar savefig tight_layout grid set_xlim set_ylim plot scatter hist boxplot imshow cmap alpha bins tick_params annotate quiver contour barh stackplot subplots_adjust axhline axvline semilogx semilogy loglog polar streamplot hexbin pcolor tricontour errorbar clabel set_aspect violinplot set_axis_off spines text hatch plt axis plt.bar() plt.axis import figure pyplot highlight_text pypalettes plt.subplots() xlabel ylabel title legend colorbar savefig tight_layout grid set_xlim set_ylim plot scatter hist boxplot imshow cmap alpha bins tick_params annotate quiver contour barh stackplot subplots_adjust axhline axvline semilogx semilogy loglog polar streamplot hexbin pcolor tricontour errorbar clabel set_aspect violinplot set_axis_off spines text hatch plt axis plt.bar() plt.axis import figure pyplot highlight_text pypalettes plt.subplots() xlabel ylabel title legend colorbar savefig tight_layout grid set_xlim set_ylim plot scatter hist boxplot imshow cmap alpha bins tick_params annotate quiver contour barh stackplot subplots_adjust axhline axvline semilogx semilogy loglog polar streamplot hexbin pcolor tricontour errorbar clabel set_aspect violinplot set_axis_off spines text hatch
Pyplot VS Axes
This is because Matplotlib provides two distinct interfaces. One of them is highly recommended—let’s explore why!
⚡️ Matplotlib Has Two Interfaces
For a long time, I found Matplotlib examples on the web incredibly confusing. The reason?
Matplotlib has two distinct interfaces.
Technically three, but the third one is highly deprecated.
These are essentially two different syntaxes for achieving the same results. One is the Axes interface (covered in the previous lesson), and the other is the pyplot interface.
This lesson boils down to the image below: we’re here to show you why sticking to the Axes interface is the way to go.
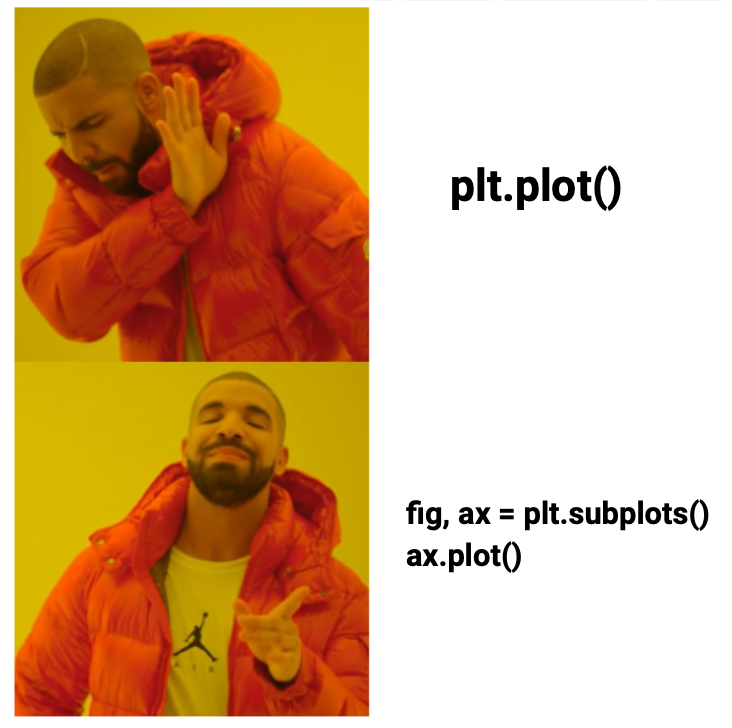
Matplotlib offers two ways to achieve the same results: the pyplot interface (top) and the axes interface (bottom).
The Pyplot Interface 🙈
If you've worked with Matplotlib before, you've likely come across code like this.
The pyplot module is imported with the plt alias, and its plot() method is called directly—no need to create a fig or ax first:
Oh no! 😱
It seems like you haven’t enrolled in the course yet!
Join many other students today and become the matplotlib expert your company needs!
Or Login