plt axis plt.bar() plt.axis import figure pyplot highlight_text pypalettes plt.subplots() xlabel ylabel title legend colorbar savefig tight_layout grid set_xlim set_ylim plot scatter hist boxplot imshow cmap alpha bins tick_params annotate quiver contour barh stackplot subplots_adjust axhline axvline semilogx semilogy loglog polar streamplot hexbin pcolor tricontour errorbar clabel set_aspect violinplot set_axis_off spines text hatch plt axis plt.bar() plt.axis import figure pyplot highlight_text pypalettes plt.subplots() xlabel ylabel title legend colorbar savefig tight_layout grid set_xlim set_ylim plot scatter hist boxplot imshow cmap alpha bins tick_params annotate quiver contour barh stackplot subplots_adjust axhline axvline semilogx semilogy loglog polar streamplot hexbin pcolor tricontour errorbar clabel set_aspect violinplot set_axis_off spines text hatch plt axis plt.bar() plt.axis import figure pyplot highlight_text pypalettes plt.subplots() xlabel ylabel title legend colorbar savefig tight_layout grid set_xlim set_ylim plot scatter hist boxplot imshow cmap alpha bins tick_params annotate quiver contour barh stackplot subplots_adjust axhline axvline semilogx semilogy loglog polar streamplot hexbin pcolor tricontour errorbar clabel set_aspect violinplot set_axis_off spines text hatch plt axis plt.bar() plt.axis import figure pyplot highlight_text pypalettes plt.subplots() xlabel ylabel title legend colorbar savefig tight_layout grid set_xlim set_ylim plot scatter hist boxplot imshow cmap alpha bins tick_params annotate quiver contour barh stackplot subplots_adjust axhline axvline semilogx semilogy loglog polar streamplot hexbin pcolor tricontour errorbar clabel set_aspect violinplot set_axis_off spines text hatch plt axis plt.bar() plt.axis import figure pyplot highlight_text pypalettes plt.subplots() xlabel ylabel title legend colorbar savefig tight_layout grid set_xlim set_ylim plot scatter hist boxplot imshow cmap alpha bins tick_params annotate quiver contour barh stackplot subplots_adjust axhline axvline semilogx semilogy loglog polar streamplot hexbin pcolor tricontour errorbar clabel set_aspect violinplot set_axis_off spines text hatch plt axis plt.bar() plt.axis import figure pyplot highlight_text pypalettes plt.subplots() xlabel ylabel title legend colorbar savefig tight_layout grid set_xlim set_ylim plot scatter hist boxplot imshow cmap alpha bins tick_params annotate quiver contour barh stackplot subplots_adjust axhline axvline semilogx semilogy loglog polar streamplot hexbin pcolor tricontour errorbar clabel set_aspect violinplot set_axis_off spines text hatch plt axis plt.bar() plt.axis import figure pyplot highlight_text pypalettes plt.subplots() xlabel ylabel title legend colorbar savefig tight_layout grid set_xlim set_ylim plot scatter hist boxplot imshow cmap alpha bins tick_params annotate quiver contour barh stackplot subplots_adjust axhline axvline semilogx semilogy loglog polar streamplot hexbin pcolor tricontour errorbar clabel set_aspect violinplot set_axis_off spines text hatch plt axis plt.bar() plt.axis import figure pyplot highlight_text pypalettes plt.subplots() xlabel ylabel title legend colorbar savefig tight_layout grid set_xlim set_ylim plot scatter hist boxplot imshow cmap alpha bins tick_params annotate quiver contour barh stackplot subplots_adjust axhline axvline semilogx semilogy loglog polar streamplot hexbin pcolor tricontour errorbar clabel set_aspect violinplot set_axis_off spines text hatch plt axis plt.bar() plt.axis import figure pyplot highlight_text pypalettes plt.subplots() xlabel ylabel title legend colorbar savefig tight_layout grid set_xlim set_ylim plot scatter hist boxplot imshow cmap alpha bins tick_params annotate quiver contour barh stackplot subplots_adjust axhline axvline semilogx semilogy loglog polar streamplot hexbin pcolor tricontour errorbar clabel set_aspect violinplot set_axis_off spines text hatch plt axis plt.bar() plt.axis import figure pyplot highlight_text pypalettes plt.subplots() xlabel ylabel title legend colorbar savefig tight_layout grid set_xlim set_ylim plot scatter hist boxplot imshow cmap alpha bins tick_params annotate quiver contour barh stackplot subplots_adjust axhline axvline semilogx semilogy loglog polar streamplot hexbin pcolor tricontour errorbar clabel set_aspect violinplot set_axis_off spines text hatch plt axis plt.bar() plt.axis import figure pyplot highlight_text pypalettes plt.subplots() xlabel ylabel title legend colorbar savefig tight_layout grid set_xlim set_ylim plot scatter hist boxplot imshow cmap alpha bins tick_params annotate quiver contour barh stackplot subplots_adjust axhline axvline semilogx semilogy loglog polar streamplot hexbin pcolor tricontour errorbar clabel set_aspect violinplot set_axis_off spines text hatch plt axis plt.bar() plt.axis import figure pyplot highlight_text pypalettes plt.subplots() xlabel ylabel title legend colorbar savefig tight_layout grid set_xlim set_ylim plot scatter hist boxplot imshow cmap alpha bins tick_params annotate quiver contour barh stackplot subplots_adjust axhline axvline semilogx semilogy loglog polar streamplot hexbin pcolor tricontour errorbar clabel set_aspect violinplot set_axis_off spines text hatch plt axis plt.bar() plt.axis import figure pyplot highlight_text pypalettes plt.subplots() xlabel ylabel title legend colorbar savefig tight_layout grid set_xlim set_ylim plot scatter hist boxplot imshow cmap alpha bins tick_params annotate quiver contour barh stackplot subplots_adjust axhline axvline semilogx semilogy loglog polar streamplot hexbin pcolor tricontour errorbar clabel set_aspect violinplot set_axis_off spines text hatch plt axis plt.bar() plt.axis import figure pyplot highlight_text pypalettes plt.subplots() xlabel ylabel title legend colorbar savefig tight_layout grid set_xlim set_ylim plot scatter hist boxplot imshow cmap alpha bins tick_params annotate quiver contour barh stackplot subplots_adjust axhline axvline semilogx semilogy loglog polar streamplot hexbin pcolor tricontour errorbar clabel set_aspect violinplot set_axis_off spines text hatch plt axis plt.bar() plt.axis import figure pyplot highlight_text pypalettes plt.subplots() xlabel ylabel title legend colorbar savefig tight_layout grid set_xlim set_ylim plot scatter hist boxplot imshow cmap alpha bins tick_params annotate quiver contour barh stackplot subplots_adjust axhline axvline semilogx semilogy loglog polar streamplot hexbin pcolor tricontour errorbar clabel set_aspect violinplot set_axis_off spines text hatch plt axis plt.bar() plt.axis import figure pyplot highlight_text pypalettes plt.subplots() xlabel ylabel title legend colorbar savefig tight_layout grid set_xlim set_ylim plot scatter hist boxplot imshow cmap alpha bins tick_params annotate quiver contour barh stackplot subplots_adjust axhline axvline semilogx semilogy loglog polar streamplot hexbin pcolor tricontour errorbar clabel set_aspect violinplot set_axis_off spines text hatch plt axis plt.bar() plt.axis import figure pyplot highlight_text pypalettes plt.subplots() xlabel ylabel title legend colorbar savefig tight_layout grid set_xlim set_ylim plot scatter hist boxplot imshow cmap alpha bins tick_params annotate quiver contour barh stackplot subplots_adjust axhline axvline semilogx semilogy loglog polar streamplot hexbin pcolor tricontour errorbar clabel set_aspect violinplot set_axis_off spines text hatch plt axis plt.bar() plt.axis import figure pyplot highlight_text pypalettes plt.subplots() xlabel ylabel title legend colorbar savefig tight_layout grid set_xlim set_ylim plot scatter hist boxplot imshow cmap alpha bins tick_params annotate quiver contour barh stackplot subplots_adjust axhline axvline semilogx semilogy loglog polar streamplot hexbin pcolor tricontour errorbar clabel set_aspect violinplot set_axis_off spines text hatch plt axis plt.bar() plt.axis import figure pyplot highlight_text pypalettes plt.subplots() xlabel ylabel title legend colorbar savefig tight_layout grid set_xlim set_ylim plot scatter hist boxplot imshow cmap alpha bins tick_params annotate quiver contour barh stackplot subplots_adjust axhline axvline semilogx semilogy loglog polar streamplot hexbin pcolor tricontour errorbar clabel set_aspect violinplot set_axis_off spines text hatch plt axis plt.bar() plt.axis import figure pyplot highlight_text pypalettes plt.subplots() xlabel ylabel title legend colorbar savefig tight_layout grid set_xlim set_ylim plot scatter hist boxplot imshow cmap alpha bins tick_params annotate quiver contour barh stackplot subplots_adjust axhline axvline semilogx semilogy loglog polar streamplot hexbin pcolor tricontour errorbar clabel set_aspect violinplot set_axis_off spines text hatch plt axis plt.bar() plt.axis import figure pyplot highlight_text pypalettes plt.subplots() xlabel ylabel title legend colorbar savefig tight_layout grid set_xlim set_ylim plot scatter hist boxplot imshow cmap alpha bins tick_params annotate quiver contour barh stackplot subplots_adjust axhline axvline semilogx semilogy loglog polar streamplot hexbin pcolor tricontour errorbar clabel set_aspect violinplot set_axis_off spines text hatch plt axis plt.bar() plt.axis import figure pyplot highlight_text pypalettes plt.subplots() xlabel ylabel title legend colorbar savefig tight_layout grid set_xlim set_ylim plot scatter hist boxplot imshow cmap alpha bins tick_params annotate quiver contour barh stackplot subplots_adjust axhline axvline semilogx semilogy loglog polar streamplot hexbin pcolor tricontour errorbar clabel set_aspect violinplot set_axis_off spines text hatch plt axis plt.bar() plt.axis import figure pyplot highlight_text pypalettes plt.subplots() xlabel ylabel title legend colorbar savefig tight_layout grid set_xlim set_ylim plot scatter hist boxplot imshow cmap alpha bins tick_params annotate quiver contour barh stackplot subplots_adjust axhline axvline semilogx semilogy loglog polar streamplot hexbin pcolor tricontour errorbar clabel set_aspect violinplot set_axis_off spines text hatch plt axis plt.bar() plt.axis import figure pyplot highlight_text pypalettes plt.subplots() xlabel ylabel title legend colorbar savefig tight_layout grid set_xlim set_ylim plot scatter hist boxplot imshow cmap alpha bins tick_params annotate quiver contour barh stackplot subplots_adjust axhline axvline semilogx semilogy loglog polar streamplot hexbin pcolor tricontour errorbar clabel set_aspect violinplot set_axis_off spines text hatch plt axis plt.bar() plt.axis import figure pyplot highlight_text pypalettes plt.subplots() xlabel ylabel title legend colorbar savefig tight_layout grid set_xlim set_ylim plot scatter hist boxplot imshow cmap alpha bins tick_params annotate quiver contour barh stackplot subplots_adjust axhline axvline semilogx semilogy loglog polar streamplot hexbin pcolor tricontour errorbar clabel set_aspect violinplot set_axis_off spines text hatch plt axis plt.bar() plt.axis import figure pyplot highlight_text pypalettes plt.subplots() xlabel ylabel title legend colorbar savefig tight_layout grid set_xlim set_ylim plot scatter hist boxplot imshow cmap alpha bins tick_params annotate quiver contour barh stackplot subplots_adjust axhline axvline semilogx semilogy loglog polar streamplot hexbin pcolor tricontour errorbar clabel set_aspect violinplot set_axis_off spines text hatch plt axis plt.bar() plt.axis import figure pyplot highlight_text pypalettes plt.subplots() xlabel ylabel title legend colorbar savefig tight_layout grid set_xlim set_ylim plot scatter hist boxplot imshow cmap alpha bins tick_params annotate quiver contour barh stackplot subplots_adjust axhline axvline semilogx semilogy loglog polar streamplot hexbin pcolor tricontour errorbar clabel set_aspect violinplot set_axis_off spines text hatch plt axis plt.bar() plt.axis import figure pyplot highlight_text pypalettes plt.subplots() xlabel ylabel title legend colorbar savefig tight_layout grid set_xlim set_ylim plot scatter hist boxplot imshow cmap alpha bins tick_params annotate quiver contour barh stackplot subplots_adjust axhline axvline semilogx semilogy loglog polar streamplot hexbin pcolor tricontour errorbar clabel set_aspect violinplot set_axis_off spines text hatch plt axis plt.bar() plt.axis import figure pyplot highlight_text pypalettes plt.subplots() xlabel ylabel title legend colorbar savefig tight_layout grid set_xlim set_ylim plot scatter hist boxplot imshow cmap alpha bins tick_params annotate quiver contour barh stackplot subplots_adjust axhline axvline semilogx semilogy loglog polar streamplot hexbin pcolor tricontour errorbar clabel set_aspect violinplot set_axis_off spines text hatch plt axis plt.bar() plt.axis import figure pyplot highlight_text pypalettes plt.subplots() xlabel ylabel title legend colorbar savefig tight_layout grid set_xlim set_ylim plot scatter hist boxplot imshow cmap alpha bins tick_params annotate quiver contour barh stackplot subplots_adjust axhline axvline semilogx semilogy loglog polar streamplot hexbin pcolor tricontour errorbar clabel set_aspect violinplot set_axis_off spines text hatch plt axis plt.bar() plt.axis import figure pyplot highlight_text pypalettes plt.subplots() xlabel ylabel title legend colorbar savefig tight_layout grid set_xlim set_ylim plot scatter hist boxplot imshow cmap alpha bins tick_params annotate quiver contour barh stackplot subplots_adjust axhline axvline semilogx semilogy loglog polar streamplot hexbin pcolor tricontour errorbar clabel set_aspect violinplot set_axis_off spines text hatch plt axis plt.bar() plt.axis import figure pyplot highlight_text pypalettes plt.subplots() xlabel ylabel title legend colorbar savefig tight_layout grid set_xlim set_ylim plot scatter hist boxplot imshow cmap alpha bins tick_params annotate quiver contour barh stackplot subplots_adjust axhline axvline semilogx semilogy loglog polar streamplot hexbin pcolor tricontour errorbar clabel set_aspect violinplot set_axis_off spines text hatch plt axis plt.bar() plt.axis import figure pyplot highlight_text pypalettes plt.subplots() xlabel ylabel title legend colorbar savefig tight_layout grid set_xlim set_ylim plot scatter hist boxplot imshow cmap alpha bins tick_params annotate quiver contour barh stackplot subplots_adjust axhline axvline semilogx semilogy loglog polar streamplot hexbin pcolor tricontour errorbar clabel set_aspect violinplot set_axis_off spines text hatch plt axis plt.bar() plt.axis import figure pyplot highlight_text pypalettes plt.subplots() xlabel ylabel title legend colorbar savefig tight_layout grid set_xlim set_ylim plot scatter hist boxplot imshow cmap alpha bins tick_params annotate quiver contour barh stackplot subplots_adjust axhline axvline semilogx semilogy loglog polar streamplot hexbin pcolor tricontour errorbar clabel set_aspect violinplot set_axis_off spines text hatch plt axis plt.bar() plt.axis import figure pyplot highlight_text pypalettes plt.subplots() xlabel ylabel title legend colorbar savefig tight_layout grid set_xlim set_ylim plot scatter hist boxplot imshow cmap alpha bins tick_params annotate quiver contour barh stackplot subplots_adjust axhline axvline semilogx semilogy loglog polar streamplot hexbin pcolor tricontour errorbar clabel set_aspect violinplot set_axis_off spines text hatch plt axis plt.bar() plt.axis import figure pyplot highlight_text pypalettes plt.subplots() xlabel ylabel title legend colorbar savefig tight_layout grid set_xlim set_ylim plot scatter hist boxplot imshow cmap alpha bins tick_params annotate quiver contour barh stackplot subplots_adjust axhline axvline semilogx semilogy loglog polar streamplot hexbin pcolor tricontour errorbar clabel set_aspect violinplot set_axis_off spines text hatch plt axis plt.bar() plt.axis import figure pyplot highlight_text pypalettes plt.subplots() xlabel ylabel title legend colorbar savefig tight_layout grid set_xlim set_ylim plot scatter hist boxplot imshow cmap alpha bins tick_params annotate quiver contour barh stackplot subplots_adjust axhline axvline semilogx semilogy loglog polar streamplot hexbin pcolor tricontour errorbar clabel set_aspect violinplot set_axis_off spines text hatch plt axis plt.bar() plt.axis import figure pyplot highlight_text pypalettes plt.subplots() xlabel ylabel title legend colorbar savefig tight_layout grid set_xlim set_ylim plot scatter hist boxplot imshow cmap alpha bins tick_params annotate quiver contour barh stackplot subplots_adjust axhline axvline semilogx semilogy loglog polar streamplot hexbin pcolor tricontour errorbar clabel set_aspect violinplot set_axis_off spines text hatch plt axis plt.bar() plt.axis import figure pyplot highlight_text pypalettes plt.subplots() xlabel ylabel title legend colorbar savefig tight_layout grid set_xlim set_ylim plot scatter hist boxplot imshow cmap alpha bins tick_params annotate quiver contour barh stackplot subplots_adjust axhline axvline semilogx semilogy loglog polar streamplot hexbin pcolor tricontour errorbar clabel set_aspect violinplot set_axis_off spines text hatch plt axis plt.bar() plt.axis import figure pyplot highlight_text pypalettes plt.subplots() xlabel ylabel title legend colorbar savefig tight_layout grid set_xlim set_ylim plot scatter hist boxplot imshow cmap alpha bins tick_params annotate quiver contour barh stackplot subplots_adjust axhline axvline semilogx semilogy loglog polar streamplot hexbin pcolor tricontour errorbar clabel set_aspect violinplot set_axis_off spines text hatch plt axis plt.bar() plt.axis import figure pyplot highlight_text pypalettes plt.subplots() xlabel ylabel title legend colorbar savefig tight_layout grid set_xlim set_ylim plot scatter hist boxplot imshow cmap alpha bins tick_params annotate quiver contour barh stackplot subplots_adjust axhline axvline semilogx semilogy loglog polar streamplot hexbin pcolor tricontour errorbar clabel set_aspect violinplot set_axis_off spines text hatch plt axis plt.bar() plt.axis import figure pyplot highlight_text pypalettes plt.subplots() xlabel ylabel title legend colorbar savefig tight_layout grid set_xlim set_ylim plot scatter hist boxplot imshow cmap alpha bins tick_params annotate quiver contour barh stackplot subplots_adjust axhline axvline semilogx semilogy loglog polar streamplot hexbin pcolor tricontour errorbar clabel set_aspect violinplot set_axis_off spines text hatch plt axis plt.bar() plt.axis import figure pyplot highlight_text pypalettes plt.subplots() xlabel ylabel title legend colorbar savefig tight_layout grid set_xlim set_ylim plot scatter hist boxplot imshow cmap alpha bins tick_params annotate quiver contour barh stackplot subplots_adjust axhline axvline semilogx semilogy loglog polar streamplot hexbin pcolor tricontour errorbar clabel set_aspect violinplot set_axis_off spines text hatch plt axis plt.bar() plt.axis import figure pyplot highlight_text pypalettes plt.subplots() xlabel ylabel title legend colorbar savefig tight_layout grid set_xlim set_ylim plot scatter hist boxplot imshow cmap alpha bins tick_params annotate quiver contour barh stackplot subplots_adjust axhline axvline semilogx semilogy loglog polar streamplot hexbin pcolor tricontour errorbar clabel set_aspect violinplot set_axis_off spines text hatch plt axis plt.bar() plt.axis import figure pyplot highlight_text pypalettes plt.subplots() xlabel ylabel title legend colorbar savefig tight_layout grid set_xlim set_ylim plot scatter hist boxplot imshow cmap alpha bins tick_params annotate quiver contour barh stackplot subplots_adjust axhline axvline semilogx semilogy loglog polar streamplot hexbin pcolor tricontour errorbar clabel set_aspect violinplot set_axis_off spines text hatch plt axis plt.bar() plt.axis import figure pyplot highlight_text pypalettes plt.subplots() xlabel ylabel title legend colorbar savefig tight_layout grid set_xlim set_ylim plot scatter hist boxplot imshow cmap alpha bins tick_params annotate quiver contour barh stackplot subplots_adjust axhline axvline semilogx semilogy loglog polar streamplot hexbin pcolor tricontour errorbar clabel set_aspect violinplot set_axis_off spines text hatch plt axis plt.bar() plt.axis import figure pyplot highlight_text pypalettes plt.subplots() xlabel ylabel title legend colorbar savefig tight_layout grid set_xlim set_ylim plot scatter hist boxplot imshow cmap alpha bins tick_params annotate quiver contour barh stackplot subplots_adjust axhline axvline semilogx semilogy loglog polar streamplot hexbin pcolor tricontour errorbar clabel set_aspect violinplot set_axis_off spines text hatch plt axis plt.bar() plt.axis import figure pyplot highlight_text pypalettes plt.subplots() xlabel ylabel title legend colorbar savefig tight_layout grid set_xlim set_ylim plot scatter hist boxplot imshow cmap alpha bins tick_params annotate quiver contour barh stackplot subplots_adjust axhline axvline semilogx semilogy loglog polar streamplot hexbin pcolor tricontour errorbar clabel set_aspect violinplot set_axis_off spines text hatch plt axis plt.bar() plt.axis import figure pyplot highlight_text pypalettes plt.subplots() xlabel ylabel title legend colorbar savefig tight_layout grid set_xlim set_ylim plot scatter hist boxplot imshow cmap alpha bins tick_params annotate quiver contour barh stackplot subplots_adjust axhline axvline semilogx semilogy loglog polar streamplot hexbin pcolor tricontour errorbar clabel set_aspect violinplot set_axis_off spines text hatch plt axis plt.bar() plt.axis import figure pyplot highlight_text pypalettes plt.subplots() xlabel ylabel title legend colorbar savefig tight_layout grid set_xlim set_ylim plot scatter hist boxplot imshow cmap alpha bins tick_params annotate quiver contour barh stackplot subplots_adjust axhline axvline semilogx semilogy loglog polar streamplot hexbin pcolor tricontour errorbar clabel set_aspect violinplot set_axis_off spines text hatch plt axis plt.bar() plt.axis import figure pyplot highlight_text pypalettes plt.subplots() xlabel ylabel title legend colorbar savefig tight_layout grid set_xlim set_ylim plot scatter hist boxplot imshow cmap alpha bins tick_params annotate quiver contour barh stackplot subplots_adjust axhline axvline semilogx semilogy loglog polar streamplot hexbin pcolor tricontour errorbar clabel set_aspect violinplot set_axis_off spines text hatch plt axis plt.bar() plt.axis import figure pyplot highlight_text pypalettes plt.subplots() xlabel ylabel title legend colorbar savefig tight_layout grid set_xlim set_ylim plot scatter hist boxplot imshow cmap alpha bins tick_params annotate quiver contour barh stackplot subplots_adjust axhline axvline semilogx semilogy loglog polar streamplot hexbin pcolor tricontour errorbar clabel set_aspect violinplot set_axis_off spines text hatch plt axis plt.bar() plt.axis import figure pyplot highlight_text pypalettes plt.subplots() xlabel ylabel title legend colorbar savefig tight_layout grid set_xlim set_ylim plot scatter hist boxplot imshow cmap alpha bins tick_params annotate quiver contour barh stackplot subplots_adjust axhline axvline semilogx semilogy loglog polar streamplot hexbin pcolor tricontour errorbar clabel set_aspect violinplot set_axis_off spines text hatch plt axis plt.bar() plt.axis import figure pyplot highlight_text pypalettes plt.subplots() xlabel ylabel title legend colorbar savefig tight_layout grid set_xlim set_ylim plot scatter hist boxplot imshow cmap alpha bins tick_params annotate quiver contour barh stackplot subplots_adjust axhline axvline semilogx semilogy loglog polar streamplot hexbin pcolor tricontour errorbar clabel set_aspect violinplot set_axis_off spines text hatch plt axis plt.bar() plt.axis import figure pyplot highlight_text pypalettes plt.subplots() xlabel ylabel title legend colorbar savefig tight_layout grid set_xlim set_ylim plot scatter hist boxplot imshow cmap alpha bins tick_params annotate quiver contour barh stackplot subplots_adjust axhline axvline semilogx semilogy loglog polar streamplot hexbin pcolor tricontour errorbar clabel set_aspect violinplot set_axis_off spines text hatch plt axis plt.bar() plt.axis import figure pyplot highlight_text pypalettes plt.subplots() xlabel ylabel title legend colorbar savefig tight_layout grid set_xlim set_ylim plot scatter hist boxplot imshow cmap alpha bins tick_params annotate quiver contour barh stackplot subplots_adjust axhline axvline semilogx semilogy loglog polar streamplot hexbin pcolor tricontour errorbar clabel set_aspect violinplot set_axis_off spines text hatch plt axis plt.bar() plt.axis import figure pyplot highlight_text pypalettes plt.subplots() xlabel ylabel title legend colorbar savefig tight_layout grid set_xlim set_ylim plot scatter hist boxplot imshow cmap alpha bins tick_params annotate quiver contour barh stackplot subplots_adjust axhline axvline semilogx semilogy loglog polar streamplot hexbin pcolor tricontour errorbar clabel set_aspect violinplot set_axis_off spines text hatch plt axis plt.bar() plt.axis import figure pyplot highlight_text pypalettes plt.subplots() xlabel ylabel title legend colorbar savefig tight_layout grid set_xlim set_ylim plot scatter hist boxplot imshow cmap alpha bins tick_params annotate quiver contour barh stackplot subplots_adjust axhline axvline semilogx semilogy loglog polar streamplot hexbin pcolor tricontour errorbar clabel set_aspect violinplot set_axis_off spines text hatch plt axis plt.bar() plt.axis import figure pyplot highlight_text pypalettes plt.subplots() xlabel ylabel title legend colorbar savefig tight_layout grid set_xlim set_ylim plot scatter hist boxplot imshow cmap alpha bins tick_params annotate quiver contour barh stackplot subplots_adjust axhline axvline semilogx semilogy loglog polar streamplot hexbin pcolor tricontour errorbar clabel set_aspect violinplot set_axis_off spines text hatch plt axis plt.bar() plt.axis import figure pyplot highlight_text pypalettes plt.subplots() xlabel ylabel title legend colorbar savefig tight_layout grid set_xlim set_ylim plot scatter hist boxplot imshow cmap alpha bins tick_params annotate quiver contour barh stackplot subplots_adjust axhline axvline semilogx semilogy loglog polar streamplot hexbin pcolor tricontour errorbar clabel set_aspect violinplot set_axis_off spines text hatch plt axis plt.bar() plt.axis import figure pyplot highlight_text pypalettes plt.subplots() xlabel ylabel title legend colorbar savefig tight_layout grid set_xlim set_ylim plot scatter hist boxplot imshow cmap alpha bins tick_params annotate quiver contour barh stackplot subplots_adjust axhline axvline semilogx semilogy loglog polar streamplot hexbin pcolor tricontour errorbar clabel set_aspect violinplot set_axis_off spines text hatch plt axis plt.bar() plt.axis import figure pyplot highlight_text pypalettes plt.subplots() xlabel ylabel title legend colorbar savefig tight_layout grid set_xlim set_ylim plot scatter hist boxplot imshow cmap alpha bins tick_params annotate quiver contour barh stackplot subplots_adjust axhline axvline semilogx semilogy loglog polar streamplot hexbin pcolor tricontour errorbar clabel set_aspect violinplot set_axis_off spines text hatch plt axis plt.bar() plt.axis import figure pyplot highlight_text pypalettes plt.subplots() xlabel ylabel title legend colorbar savefig tight_layout grid set_xlim set_ylim plot scatter hist boxplot imshow cmap alpha bins tick_params annotate quiver contour barh stackplot subplots_adjust axhline axvline semilogx semilogy loglog polar streamplot hexbin pcolor tricontour errorbar clabel set_aspect violinplot set_axis_off spines text hatch plt axis plt.bar() plt.axis import figure pyplot highlight_text pypalettes plt.subplots() xlabel ylabel title legend colorbar savefig tight_layout grid set_xlim set_ylim plot scatter hist boxplot imshow cmap alpha bins tick_params annotate quiver contour barh stackplot subplots_adjust axhline axvline semilogx semilogy loglog polar streamplot hexbin pcolor tricontour errorbar clabel set_aspect violinplot set_axis_off spines text hatch plt axis plt.bar() plt.axis import figure pyplot highlight_text pypalettes plt.subplots() xlabel ylabel title legend colorbar savefig tight_layout grid set_xlim set_ylim plot scatter hist boxplot imshow cmap alpha bins tick_params annotate quiver contour barh stackplot subplots_adjust axhline axvline semilogx semilogy loglog polar streamplot hexbin pcolor tricontour errorbar clabel set_aspect violinplot set_axis_off spines text hatch plt axis plt.bar() plt.axis import figure pyplot highlight_text pypalettes plt.subplots() xlabel ylabel title legend colorbar savefig tight_layout grid set_xlim set_ylim plot scatter hist boxplot imshow cmap alpha bins tick_params annotate quiver contour barh stackplot subplots_adjust axhline axvline semilogx semilogy loglog polar streamplot hexbin pcolor tricontour errorbar clabel set_aspect violinplot set_axis_off spines text hatch plt axis plt.bar() plt.axis import figure pyplot highlight_text pypalettes plt.subplots() xlabel ylabel title legend colorbar savefig tight_layout grid set_xlim set_ylim plot scatter hist boxplot imshow cmap alpha bins tick_params annotate quiver contour barh stackplot subplots_adjust axhline axvline semilogx semilogy loglog polar streamplot hexbin pcolor tricontour errorbar clabel set_aspect violinplot set_axis_off spines text hatch plt axis plt.bar() plt.axis import figure pyplot highlight_text pypalettes plt.subplots() xlabel ylabel title legend colorbar savefig tight_layout grid set_xlim set_ylim plot scatter hist boxplot imshow cmap alpha bins tick_params annotate quiver contour barh stackplot subplots_adjust axhline axvline semilogx semilogy loglog polar streamplot hexbin pcolor tricontour errorbar clabel set_aspect violinplot set_axis_off spines text hatch plt axis plt.bar() plt.axis import figure pyplot highlight_text pypalettes plt.subplots() xlabel ylabel title legend colorbar savefig tight_layout grid set_xlim set_ylim plot scatter hist boxplot imshow cmap alpha bins tick_params annotate quiver contour barh stackplot subplots_adjust axhline axvline semilogx semilogy loglog polar streamplot hexbin pcolor tricontour errorbar clabel set_aspect violinplot set_axis_off spines text hatch plt axis plt.bar() plt.axis import figure pyplot highlight_text pypalettes plt.subplots() xlabel ylabel title legend colorbar savefig tight_layout grid set_xlim set_ylim plot scatter hist boxplot imshow cmap alpha bins tick_params annotate quiver contour barh stackplot subplots_adjust axhline axvline semilogx semilogy loglog polar streamplot hexbin pcolor tricontour errorbar clabel set_aspect violinplot set_axis_off spines text hatch plt axis plt.bar() plt.axis import figure pyplot highlight_text pypalettes plt.subplots() xlabel ylabel title legend colorbar savefig tight_layout grid set_xlim set_ylim plot scatter hist boxplot imshow cmap alpha bins tick_params annotate quiver contour barh stackplot subplots_adjust axhline axvline semilogx semilogy loglog polar streamplot hexbin pcolor tricontour errorbar clabel set_aspect violinplot set_axis_off spines text hatch plt axis plt.bar() plt.axis import figure pyplot highlight_text pypalettes plt.subplots() xlabel ylabel title legend colorbar savefig tight_layout grid set_xlim set_ylim plot scatter hist boxplot imshow cmap alpha bins tick_params annotate quiver contour barh stackplot subplots_adjust axhline axvline semilogx semilogy loglog polar streamplot hexbin pcolor tricontour errorbar clabel set_aspect violinplot set_axis_off spines text hatch plt axis plt.bar() plt.axis import figure pyplot highlight_text pypalettes plt.subplots() xlabel ylabel title legend colorbar savefig tight_layout grid set_xlim set_ylim plot scatter hist boxplot imshow cmap alpha bins tick_params annotate quiver contour barh stackplot subplots_adjust axhline axvline semilogx semilogy loglog polar streamplot hexbin pcolor tricontour errorbar clabel set_aspect violinplot set_axis_off spines text hatch plt axis plt.bar() plt.axis import figure pyplot highlight_text pypalettes plt.subplots() xlabel ylabel title legend colorbar savefig tight_layout grid set_xlim set_ylim plot scatter hist boxplot imshow cmap alpha bins tick_params annotate quiver contour barh stackplot subplots_adjust axhline axvline semilogx semilogy loglog polar streamplot hexbin pcolor tricontour errorbar clabel set_aspect violinplot set_axis_off spines text hatch plt axis plt.bar() plt.axis import figure pyplot highlight_text pypalettes plt.subplots() xlabel ylabel title legend colorbar savefig tight_layout grid set_xlim set_ylim plot scatter hist boxplot imshow cmap alpha bins tick_params annotate quiver contour barh stackplot subplots_adjust axhline axvline semilogx semilogy loglog polar streamplot hexbin pcolor tricontour errorbar clabel set_aspect violinplot set_axis_off spines text hatch plt axis plt.bar() plt.axis import figure pyplot highlight_text pypalettes plt.subplots() xlabel ylabel title legend colorbar savefig tight_layout grid set_xlim set_ylim plot scatter hist boxplot imshow cmap alpha bins tick_params annotate quiver contour barh stackplot subplots_adjust axhline axvline semilogx semilogy loglog polar streamplot hexbin pcolor tricontour errorbar clabel set_aspect violinplot set_axis_off spines text hatch plt axis plt.bar() plt.axis import figure pyplot highlight_text pypalettes plt.subplots() xlabel ylabel title legend colorbar savefig tight_layout grid set_xlim set_ylim plot scatter hist boxplot imshow cmap alpha bins tick_params annotate quiver contour barh stackplot subplots_adjust axhline axvline semilogx semilogy loglog polar streamplot hexbin pcolor tricontour errorbar clabel set_aspect violinplot set_axis_off spines text hatch plt axis plt.bar() plt.axis import figure pyplot highlight_text pypalettes plt.subplots() xlabel ylabel title legend colorbar savefig tight_layout grid set_xlim set_ylim plot scatter hist boxplot imshow cmap alpha bins tick_params annotate quiver contour barh stackplot subplots_adjust axhline axvline semilogx semilogy loglog polar streamplot hexbin pcolor tricontour errorbar clabel set_aspect violinplot set_axis_off spines text hatch plt axis plt.bar() plt.axis import figure pyplot highlight_text pypalettes plt.subplots() xlabel ylabel title legend colorbar savefig tight_layout grid set_xlim set_ylim plot scatter hist boxplot imshow cmap alpha bins tick_params annotate quiver contour barh stackplot subplots_adjust axhline axvline semilogx semilogy loglog polar streamplot hexbin pcolor tricontour errorbar clabel set_aspect violinplot set_axis_off spines text hatch plt axis plt.bar() plt.axis import figure pyplot highlight_text pypalettes plt.subplots() xlabel ylabel title legend colorbar savefig tight_layout grid set_xlim set_ylim plot scatter hist boxplot imshow cmap alpha bins tick_params annotate quiver contour barh stackplot subplots_adjust axhline axvline semilogx semilogy loglog polar streamplot hexbin pcolor tricontour errorbar clabel set_aspect violinplot set_axis_off spines text hatch plt axis plt.bar() plt.axis import figure pyplot highlight_text pypalettes plt.subplots() xlabel ylabel title legend colorbar savefig tight_layout grid set_xlim set_ylim plot scatter hist boxplot imshow cmap alpha bins tick_params annotate quiver contour barh stackplot subplots_adjust axhline axvline semilogx semilogy loglog polar streamplot hexbin pcolor tricontour errorbar clabel set_aspect violinplot set_axis_off spines text hatch plt axis plt.bar() plt.axis import figure pyplot highlight_text pypalettes plt.subplots() xlabel ylabel title legend colorbar savefig tight_layout grid set_xlim set_ylim plot scatter hist boxplot imshow cmap alpha bins tick_params annotate quiver contour barh stackplot subplots_adjust axhline axvline semilogx semilogy loglog polar streamplot hexbin pcolor tricontour errorbar clabel set_aspect violinplot set_axis_off spines text hatch plt axis plt.bar() plt.axis import figure pyplot highlight_text pypalettes plt.subplots() xlabel ylabel title legend colorbar savefig tight_layout grid set_xlim set_ylim plot scatter hist boxplot imshow cmap alpha bins tick_params annotate quiver contour barh stackplot subplots_adjust axhline axvline semilogx semilogy loglog polar streamplot hexbin pcolor tricontour errorbar clabel set_aspect violinplot set_axis_off spines text hatch plt axis plt.bar() plt.axis import figure pyplot highlight_text pypalettes plt.subplots() xlabel ylabel title legend colorbar savefig tight_layout grid set_xlim set_ylim plot scatter hist boxplot imshow cmap alpha bins tick_params annotate quiver contour barh stackplot subplots_adjust axhline axvline semilogx semilogy loglog polar streamplot hexbin pcolor tricontour errorbar clabel set_aspect violinplot set_axis_off spines text hatch plt axis plt.bar() plt.axis import figure pyplot highlight_text pypalettes plt.subplots() xlabel ylabel title legend colorbar savefig tight_layout grid set_xlim set_ylim plot scatter hist boxplot imshow cmap alpha bins tick_params annotate quiver contour barh stackplot subplots_adjust axhline axvline semilogx semilogy loglog polar streamplot hexbin pcolor tricontour errorbar clabel set_aspect violinplot set_axis_off spines text hatch plt axis plt.bar() plt.axis import figure pyplot highlight_text pypalettes plt.subplots() xlabel ylabel title legend colorbar savefig tight_layout grid set_xlim set_ylim plot scatter hist boxplot imshow cmap alpha bins tick_params annotate quiver contour barh stackplot subplots_adjust axhline axvline semilogx semilogy loglog polar streamplot hexbin pcolor tricontour errorbar clabel set_aspect violinplot set_axis_off spines text hatch plt axis plt.bar() plt.axis import figure pyplot highlight_text pypalettes plt.subplots() xlabel ylabel title legend colorbar savefig tight_layout grid set_xlim set_ylim plot scatter hist boxplot imshow cmap alpha bins tick_params annotate quiver contour barh stackplot subplots_adjust axhline axvline semilogx semilogy loglog polar streamplot hexbin pcolor tricontour errorbar clabel set_aspect violinplot set_axis_off spines text hatch plt axis plt.bar() plt.axis import figure pyplot highlight_text pypalettes plt.subplots() xlabel ylabel title legend colorbar savefig tight_layout grid set_xlim set_ylim plot scatter hist boxplot imshow cmap alpha bins tick_params annotate quiver contour barh stackplot subplots_adjust axhline axvline semilogx semilogy loglog polar streamplot hexbin pcolor tricontour errorbar clabel set_aspect violinplot set_axis_off spines text hatch plt axis plt.bar() plt.axis import figure pyplot highlight_text pypalettes plt.subplots() xlabel ylabel title legend colorbar savefig tight_layout grid set_xlim set_ylim plot scatter hist boxplot imshow cmap alpha bins tick_params annotate quiver contour barh stackplot subplots_adjust axhline axvline semilogx semilogy loglog polar streamplot hexbin pcolor tricontour errorbar clabel set_aspect violinplot set_axis_off spines text hatch plt axis plt.bar() plt.axis import figure pyplot highlight_text pypalettes plt.subplots() xlabel ylabel title legend colorbar savefig tight_layout grid set_xlim set_ylim plot scatter hist boxplot imshow cmap alpha bins tick_params annotate quiver contour barh stackplot subplots_adjust axhline axvline semilogx semilogy loglog polar streamplot hexbin pcolor tricontour errorbar clabel set_aspect violinplot set_axis_off spines text hatch plt axis plt.bar() plt.axis import figure pyplot highlight_text pypalettes plt.subplots() xlabel ylabel title legend colorbar savefig tight_layout grid set_xlim set_ylim plot scatter hist boxplot imshow cmap alpha bins tick_params annotate quiver contour barh stackplot subplots_adjust axhline axvline semilogx semilogy loglog polar streamplot hexbin pcolor tricontour errorbar clabel set_aspect violinplot set_axis_off spines text hatch plt axis plt.bar() plt.axis import figure pyplot highlight_text pypalettes plt.subplots() xlabel ylabel title legend colorbar savefig tight_layout grid set_xlim set_ylim plot scatter hist boxplot imshow cmap alpha bins tick_params annotate quiver contour barh stackplot subplots_adjust axhline axvline semilogx semilogy loglog polar streamplot hexbin pcolor tricontour errorbar clabel set_aspect violinplot set_axis_off spines text hatch plt axis plt.bar() plt.axis import figure pyplot highlight_text pypalettes plt.subplots() xlabel ylabel title legend colorbar savefig tight_layout grid set_xlim set_ylim plot scatter hist boxplot imshow cmap alpha bins tick_params annotate quiver contour barh stackplot subplots_adjust axhline axvline semilogx semilogy loglog polar streamplot hexbin pcolor tricontour errorbar clabel set_aspect violinplot set_axis_off spines text hatch plt axis plt.bar() plt.axis import figure pyplot highlight_text pypalettes plt.subplots() xlabel ylabel title legend colorbar savefig tight_layout grid set_xlim set_ylim plot scatter hist boxplot imshow cmap alpha bins tick_params annotate quiver contour barh stackplot subplots_adjust axhline axvline semilogx semilogy loglog polar streamplot hexbin pcolor tricontour errorbar clabel set_aspect violinplot set_axis_off spines text hatch plt axis plt.bar() plt.axis import figure pyplot highlight_text pypalettes plt.subplots() xlabel ylabel title legend colorbar savefig tight_layout grid set_xlim set_ylim plot scatter hist boxplot imshow cmap alpha bins tick_params annotate quiver contour barh stackplot subplots_adjust axhline axvline semilogx semilogy loglog polar streamplot hexbin pcolor tricontour errorbar clabel set_aspect violinplot set_axis_off spines text hatch plt axis plt.bar() plt.axis import figure pyplot highlight_text pypalettes plt.subplots() xlabel ylabel title legend colorbar savefig tight_layout grid set_xlim set_ylim plot scatter hist boxplot imshow cmap alpha bins tick_params annotate quiver contour barh stackplot subplots_adjust axhline axvline semilogx semilogy loglog polar streamplot hexbin pcolor tricontour errorbar clabel set_aspect violinplot set_axis_off spines text hatch plt axis plt.bar() plt.axis import figure pyplot highlight_text pypalettes plt.subplots() xlabel ylabel title legend colorbar savefig tight_layout grid set_xlim set_ylim plot scatter hist boxplot imshow cmap alpha bins tick_params annotate quiver contour barh stackplot subplots_adjust axhline axvline semilogx semilogy loglog polar streamplot hexbin pcolor tricontour errorbar clabel set_aspect violinplot set_axis_off spines text hatch plt axis plt.bar() plt.axis import figure pyplot highlight_text pypalettes plt.subplots() xlabel ylabel title legend colorbar savefig tight_layout grid set_xlim set_ylim plot scatter hist boxplot imshow cmap alpha bins tick_params annotate quiver contour barh stackplot subplots_adjust axhline axvline semilogx semilogy loglog polar streamplot hexbin pcolor tricontour errorbar clabel set_aspect violinplot set_axis_off spines text hatch plt axis plt.bar() plt.axis import figure pyplot highlight_text pypalettes plt.subplots() xlabel ylabel title legend colorbar savefig tight_layout grid set_xlim set_ylim plot scatter hist boxplot imshow cmap alpha bins tick_params annotate quiver contour barh stackplot subplots_adjust axhline axvline semilogx semilogy loglog polar streamplot hexbin pcolor tricontour errorbar clabel set_aspect violinplot set_axis_off spines text hatch plt axis plt.bar() plt.axis import figure pyplot highlight_text pypalettes plt.subplots() xlabel ylabel title legend colorbar savefig tight_layout grid set_xlim set_ylim plot scatter hist boxplot imshow cmap alpha bins tick_params annotate quiver contour barh stackplot subplots_adjust axhline axvline semilogx semilogy loglog polar streamplot hexbin pcolor tricontour errorbar clabel set_aspect violinplot set_axis_off spines text hatch plt axis plt.bar() plt.axis import figure pyplot highlight_text pypalettes plt.subplots() xlabel ylabel title legend colorbar savefig tight_layout grid set_xlim set_ylim plot scatter hist boxplot imshow cmap alpha bins tick_params annotate quiver contour barh stackplot subplots_adjust axhline axvline semilogx semilogy loglog polar streamplot hexbin pcolor tricontour errorbar clabel set_aspect violinplot set_axis_off spines text hatch plt axis plt.bar() plt.axis import figure pyplot highlight_text pypalettes plt.subplots() xlabel ylabel title legend colorbar savefig tight_layout grid set_xlim set_ylim plot scatter hist boxplot imshow cmap alpha bins tick_params annotate quiver contour barh stackplot subplots_adjust axhline axvline semilogx semilogy loglog polar streamplot hexbin pcolor tricontour errorbar clabel set_aspect violinplot set_axis_off spines text hatch plt axis plt.bar() plt.axis import figure pyplot highlight_text pypalettes plt.subplots() xlabel ylabel title legend colorbar savefig tight_layout grid set_xlim set_ylim plot scatter hist boxplot imshow cmap alpha bins tick_params annotate quiver contour barh stackplot subplots_adjust axhline axvline semilogx semilogy loglog polar streamplot hexbin pcolor tricontour errorbar clabel set_aspect violinplot set_axis_off spines text hatch plt axis plt.bar() plt.axis import figure pyplot highlight_text pypalettes plt.subplots() xlabel ylabel title legend colorbar savefig tight_layout grid set_xlim set_ylim plot scatter hist boxplot imshow cmap alpha bins tick_params annotate quiver contour barh stackplot subplots_adjust axhline axvline semilogx semilogy loglog polar streamplot hexbin pcolor tricontour errorbar clabel set_aspect violinplot set_axis_off spines text hatch plt axis plt.bar() plt.axis import figure pyplot highlight_text pypalettes plt.subplots() xlabel ylabel title legend colorbar savefig tight_layout grid set_xlim set_ylim plot scatter hist boxplot imshow cmap alpha bins tick_params annotate quiver contour barh stackplot subplots_adjust axhline axvline semilogx semilogy loglog polar streamplot hexbin pcolor tricontour errorbar clabel set_aspect violinplot set_axis_off spines text hatch plt axis plt.bar() plt.axis import figure pyplot highlight_text pypalettes plt.subplots() xlabel ylabel title legend colorbar savefig tight_layout grid set_xlim set_ylim plot scatter hist boxplot imshow cmap alpha bins tick_params annotate quiver contour barh stackplot subplots_adjust axhline axvline semilogx semilogy loglog polar streamplot hexbin pcolor tricontour errorbar clabel set_aspect violinplot set_axis_off spines text hatch plt axis plt.bar() plt.axis import figure pyplot highlight_text pypalettes plt.subplots() xlabel ylabel title legend colorbar savefig tight_layout grid set_xlim set_ylim plot scatter hist boxplot imshow cmap alpha bins tick_params annotate quiver contour barh stackplot subplots_adjust axhline axvline semilogx semilogy loglog polar streamplot hexbin pcolor tricontour errorbar clabel set_aspect violinplot set_axis_off spines text hatch plt axis plt.bar() plt.axis import figure pyplot highlight_text pypalettes plt.subplots() xlabel ylabel title legend colorbar savefig tight_layout grid set_xlim set_ylim plot scatter hist boxplot imshow cmap alpha bins tick_params annotate quiver contour barh stackplot subplots_adjust axhline axvline semilogx semilogy loglog polar streamplot hexbin pcolor tricontour errorbar clabel set_aspect violinplot set_axis_off spines text hatch plt axis plt.bar() plt.axis import figure pyplot highlight_text pypalettes plt.subplots() xlabel ylabel title legend colorbar savefig tight_layout grid set_xlim set_ylim plot scatter hist boxplot imshow cmap alpha bins tick_params annotate quiver contour barh stackplot subplots_adjust axhline axvline semilogx semilogy loglog polar streamplot hexbin pcolor tricontour errorbar clabel set_aspect violinplot set_axis_off spines text hatch plt axis plt.bar() plt.axis import figure pyplot highlight_text pypalettes plt.subplots() xlabel ylabel title legend colorbar savefig tight_layout grid set_xlim set_ylim plot scatter hist boxplot imshow cmap alpha bins tick_params annotate quiver contour barh stackplot subplots_adjust axhline axvline semilogx semilogy loglog polar streamplot hexbin pcolor tricontour errorbar clabel set_aspect violinplot set_axis_off spines text hatch plt axis plt.bar() plt.axis import figure pyplot highlight_text pypalettes plt.subplots() xlabel ylabel title legend colorbar savefig tight_layout grid set_xlim set_ylim plot scatter hist boxplot imshow cmap alpha bins tick_params annotate quiver contour barh stackplot subplots_adjust axhline axvline semilogx semilogy loglog polar streamplot hexbin pcolor tricontour errorbar clabel set_aspect violinplot set_axis_off spines text hatch plt axis plt.bar() plt.axis import figure pyplot highlight_text pypalettes plt.subplots() xlabel ylabel title legend colorbar savefig tight_layout grid set_xlim set_ylim plot scatter hist boxplot imshow cmap alpha bins tick_params annotate quiver contour barh stackplot subplots_adjust axhline axvline semilogx semilogy loglog polar streamplot hexbin pcolor tricontour errorbar clabel set_aspect violinplot set_axis_off spines text hatch plt axis plt.bar() plt.axis import figure pyplot highlight_text pypalettes plt.subplots() xlabel ylabel title legend colorbar savefig tight_layout grid set_xlim set_ylim plot scatter hist boxplot imshow cmap alpha bins tick_params annotate quiver contour barh stackplot subplots_adjust axhline axvline semilogx semilogy loglog polar streamplot hexbin pcolor tricontour errorbar clabel set_aspect violinplot set_axis_off spines text hatch plt axis plt.bar() plt.axis import figure pyplot highlight_text pypalettes plt.subplots() xlabel ylabel title legend colorbar savefig tight_layout grid set_xlim set_ylim plot scatter hist boxplot imshow cmap alpha bins tick_params annotate quiver contour barh stackplot subplots_adjust axhline axvline semilogx semilogy loglog polar streamplot hexbin pcolor tricontour errorbar clabel set_aspect violinplot set_axis_off spines text hatch plt axis plt.bar() plt.axis import figure pyplot highlight_text pypalettes plt.subplots() xlabel ylabel title legend colorbar savefig tight_layout grid set_xlim set_ylim plot scatter hist boxplot imshow cmap alpha bins tick_params annotate quiver contour barh stackplot subplots_adjust axhline axvline semilogx semilogy loglog polar streamplot hexbin pcolor tricontour errorbar clabel set_aspect violinplot set_axis_off spines text hatch plt axis plt.bar() plt.axis import figure pyplot highlight_text pypalettes plt.subplots() xlabel ylabel title legend colorbar savefig tight_layout grid set_xlim set_ylim plot scatter hist boxplot imshow cmap alpha bins tick_params annotate quiver contour barh stackplot subplots_adjust axhline axvline semilogx semilogy loglog polar streamplot hexbin pcolor tricontour errorbar clabel set_aspect violinplot set_axis_off spines text hatch plt axis plt.bar() plt.axis import figure pyplot highlight_text pypalettes plt.subplots() xlabel ylabel title legend colorbar savefig tight_layout grid set_xlim set_ylim plot scatter hist boxplot imshow cmap alpha bins tick_params annotate quiver contour barh stackplot subplots_adjust axhline axvline semilogx semilogy loglog polar streamplot hexbin pcolor tricontour errorbar clabel set_aspect violinplot set_axis_off spines text hatch plt axis plt.bar() plt.axis import figure pyplot highlight_text pypalettes plt.subplots() xlabel ylabel title legend colorbar savefig tight_layout grid set_xlim set_ylim plot scatter hist boxplot imshow cmap alpha bins tick_params annotate quiver contour barh stackplot subplots_adjust axhline axvline semilogx semilogy loglog polar streamplot hexbin pcolor tricontour errorbar clabel set_aspect violinplot set_axis_off spines text hatch plt axis plt.bar() plt.axis import figure pyplot highlight_text pypalettes plt.subplots() xlabel ylabel title legend colorbar savefig tight_layout grid set_xlim set_ylim plot scatter hist boxplot imshow cmap alpha bins tick_params annotate quiver contour barh stackplot subplots_adjust axhline axvline semilogx semilogy loglog polar streamplot hexbin pcolor tricontour errorbar clabel set_aspect violinplot set_axis_off spines text hatch plt axis plt.bar() plt.axis import figure pyplot highlight_text pypalettes plt.subplots() xlabel ylabel title legend colorbar savefig tight_layout grid set_xlim set_ylim plot scatter hist boxplot imshow cmap alpha bins tick_params annotate quiver contour barh stackplot subplots_adjust axhline axvline semilogx semilogy loglog polar streamplot hexbin pcolor tricontour errorbar clabel set_aspect violinplot set_axis_off spines text hatch plt axis plt.bar() plt.axis import figure pyplot highlight_text pypalettes plt.subplots() xlabel ylabel title legend colorbar savefig tight_layout grid set_xlim set_ylim plot scatter hist boxplot imshow cmap alpha bins tick_params annotate quiver contour barh stackplot subplots_adjust axhline axvline semilogx semilogy loglog polar streamplot hexbin pcolor tricontour errorbar clabel set_aspect violinplot set_axis_off spines text hatch plt axis plt.bar() plt.axis import figure pyplot highlight_text pypalettes plt.subplots() xlabel ylabel title legend colorbar savefig tight_layout grid set_xlim set_ylim plot scatter hist boxplot imshow cmap alpha bins tick_params annotate quiver contour barh stackplot subplots_adjust axhline axvline semilogx semilogy loglog polar streamplot hexbin pcolor tricontour errorbar clabel set_aspect violinplot set_axis_off spines text hatch plt axis plt.bar() plt.axis import figure pyplot highlight_text pypalettes plt.subplots() xlabel ylabel title legend colorbar savefig tight_layout grid set_xlim set_ylim plot scatter hist boxplot imshow cmap alpha bins tick_params annotate quiver contour barh stackplot subplots_adjust axhline axvline semilogx semilogy loglog polar streamplot hexbin pcolor tricontour errorbar clabel set_aspect violinplot set_axis_off spines text hatch plt axis plt.bar() plt.axis import figure pyplot highlight_text pypalettes plt.subplots() xlabel ylabel title legend colorbar savefig tight_layout grid set_xlim set_ylim plot scatter hist boxplot imshow cmap alpha bins tick_params annotate quiver contour barh stackplot subplots_adjust axhline axvline semilogx semilogy loglog polar streamplot hexbin pcolor tricontour errorbar clabel set_aspect violinplot set_axis_off spines text hatch plt axis plt.bar() plt.axis import figure pyplot highlight_text pypalettes plt.subplots() xlabel ylabel title legend colorbar savefig tight_layout grid set_xlim set_ylim plot scatter hist boxplot imshow cmap alpha bins tick_params annotate quiver contour barh stackplot subplots_adjust axhline axvline semilogx semilogy loglog polar streamplot hexbin pcolor tricontour errorbar clabel set_aspect violinplot set_axis_off spines text hatch plt axis plt.bar() plt.axis import figure pyplot highlight_text pypalettes plt.subplots() xlabel ylabel title legend colorbar savefig tight_layout grid set_xlim set_ylim plot scatter hist boxplot imshow cmap alpha bins tick_params annotate quiver contour barh stackplot subplots_adjust axhline axvline semilogx semilogy loglog polar streamplot hexbin pcolor tricontour errorbar clabel set_aspect violinplot set_axis_off spines text hatch plt axis plt.bar() plt.axis import figure pyplot highlight_text pypalettes plt.subplots() xlabel ylabel title legend colorbar savefig tight_layout grid set_xlim set_ylim plot scatter hist boxplot imshow cmap alpha bins tick_params annotate quiver contour barh stackplot subplots_adjust axhline axvline semilogx semilogy loglog polar streamplot hexbin pcolor tricontour errorbar clabel set_aspect violinplot set_axis_off spines text hatch plt axis plt.bar() plt.axis import figure pyplot highlight_text pypalettes plt.subplots() xlabel ylabel title legend colorbar savefig tight_layout grid set_xlim set_ylim plot scatter hist boxplot imshow cmap alpha bins tick_params annotate quiver contour barh stackplot subplots_adjust axhline axvline semilogx semilogy loglog polar streamplot hexbin pcolor tricontour errorbar clabel set_aspect violinplot set_axis_off spines text hatch plt axis plt.bar() plt.axis import figure pyplot highlight_text pypalettes plt.subplots() xlabel ylabel title legend colorbar savefig tight_layout grid set_xlim set_ylim plot scatter hist boxplot imshow cmap alpha bins tick_params annotate quiver contour barh stackplot subplots_adjust axhline axvline semilogx semilogy loglog polar streamplot hexbin pcolor tricontour errorbar clabel set_aspect violinplot set_axis_off spines text hatch plt axis plt.bar() plt.axis import figure pyplot highlight_text pypalettes plt.subplots() xlabel ylabel title legend colorbar savefig tight_layout grid set_xlim set_ylim plot scatter hist boxplot imshow cmap alpha bins tick_params annotate quiver contour barh stackplot subplots_adjust axhline axvline semilogx semilogy loglog polar streamplot hexbin pcolor tricontour errorbar clabel set_aspect violinplot set_axis_off spines text hatch plt axis plt.bar() plt.axis import figure pyplot highlight_text pypalettes plt.subplots() xlabel ylabel title legend colorbar savefig tight_layout grid set_xlim set_ylim plot scatter hist boxplot imshow cmap alpha bins tick_params annotate quiver contour barh stackplot subplots_adjust axhline axvline semilogx semilogy loglog polar streamplot hexbin pcolor tricontour errorbar clabel set_aspect violinplot set_axis_off spines text hatch plt axis plt.bar() plt.axis import figure pyplot highlight_text pypalettes plt.subplots() xlabel ylabel title legend colorbar savefig tight_layout grid set_xlim set_ylim plot scatter hist boxplot imshow cmap alpha bins tick_params annotate quiver contour barh stackplot subplots_adjust axhline axvline semilogx semilogy loglog polar streamplot hexbin pcolor tricontour errorbar clabel set_aspect violinplot set_axis_off spines text hatch plt axis plt.bar() plt.axis import figure pyplot highlight_text pypalettes plt.subplots() xlabel ylabel title legend colorbar savefig tight_layout grid set_xlim set_ylim plot scatter hist boxplot imshow cmap alpha bins tick_params annotate quiver contour barh stackplot subplots_adjust axhline axvline semilogx semilogy loglog polar streamplot hexbin pcolor tricontour errorbar clabel set_aspect violinplot set_axis_off spines text hatch plt axis plt.bar() plt.axis import figure pyplot highlight_text pypalettes plt.subplots() xlabel ylabel title legend colorbar savefig tight_layout grid set_xlim set_ylim plot scatter hist boxplot imshow cmap alpha bins tick_params annotate quiver contour barh stackplot subplots_adjust axhline axvline semilogx semilogy loglog polar streamplot hexbin pcolor tricontour errorbar clabel set_aspect violinplot set_axis_off spines text hatch plt axis plt.bar() plt.axis import figure pyplot highlight_text pypalettes plt.subplots() xlabel ylabel title legend colorbar savefig tight_layout grid set_xlim set_ylim plot scatter hist boxplot imshow cmap alpha bins tick_params annotate quiver contour barh stackplot subplots_adjust axhline axvline semilogx semilogy loglog polar streamplot hexbin pcolor tricontour errorbar clabel set_aspect violinplot set_axis_off spines text hatch plt axis plt.bar() plt.axis import figure pyplot highlight_text pypalettes plt.subplots() xlabel ylabel title legend colorbar savefig tight_layout grid set_xlim set_ylim plot scatter hist boxplot imshow cmap alpha bins tick_params annotate quiver contour barh stackplot subplots_adjust axhline axvline semilogx semilogy loglog polar streamplot hexbin pcolor tricontour errorbar clabel set_aspect violinplot set_axis_off spines text hatch plt axis plt.bar() plt.axis import figure pyplot highlight_text pypalettes plt.subplots() xlabel ylabel title legend colorbar savefig tight_layout grid set_xlim set_ylim plot scatter hist boxplot imshow cmap alpha bins tick_params annotate quiver contour barh stackplot subplots_adjust axhline axvline semilogx semilogy loglog polar streamplot hexbin pcolor tricontour errorbar clabel set_aspect violinplot set_axis_off spines text hatch plt axis plt.bar() plt.axis import figure pyplot highlight_text pypalettes plt.subplots() xlabel ylabel title legend colorbar savefig tight_layout grid set_xlim set_ylim plot scatter hist boxplot imshow cmap alpha bins tick_params annotate quiver contour barh stackplot subplots_adjust axhline axvline semilogx semilogy loglog polar streamplot hexbin pcolor tricontour errorbar clabel set_aspect violinplot set_axis_off spines text hatch plt axis plt.bar() plt.axis import figure pyplot highlight_text pypalettes plt.subplots() xlabel ylabel title legend colorbar savefig tight_layout grid set_xlim set_ylim plot scatter hist boxplot imshow cmap alpha bins tick_params annotate quiver contour barh stackplot subplots_adjust axhline axvline semilogx semilogy loglog polar streamplot hexbin pcolor tricontour errorbar clabel set_aspect violinplot set_axis_off spines text hatch plt axis plt.bar() plt.axis import figure pyplot highlight_text pypalettes plt.subplots() xlabel ylabel title legend colorbar savefig tight_layout grid set_xlim set_ylim plot scatter hist boxplot imshow cmap alpha bins tick_params annotate quiver contour barh stackplot subplots_adjust axhline axvline semilogx semilogy loglog polar streamplot hexbin pcolor tricontour errorbar clabel set_aspect violinplot set_axis_off spines text hatch plt axis plt.bar() plt.axis import figure pyplot highlight_text pypalettes plt.subplots() xlabel ylabel title legend colorbar savefig tight_layout grid set_xlim set_ylim plot scatter hist boxplot imshow cmap alpha bins tick_params annotate quiver contour barh stackplot subplots_adjust axhline axvline semilogx semilogy loglog polar streamplot hexbin pcolor tricontour errorbar clabel set_aspect violinplot set_axis_off spines text hatch plt axis plt.bar() plt.axis import figure pyplot highlight_text pypalettes plt.subplots() xlabel ylabel title legend colorbar savefig tight_layout grid set_xlim set_ylim plot scatter hist boxplot imshow cmap alpha bins tick_params annotate quiver contour barh stackplot subplots_adjust axhline axvline semilogx semilogy loglog polar streamplot hexbin pcolor tricontour errorbar clabel set_aspect violinplot set_axis_off spines text hatch plt axis plt.bar() plt.axis import figure pyplot highlight_text pypalettes plt.subplots() xlabel ylabel title legend colorbar savefig tight_layout grid set_xlim set_ylim plot scatter hist boxplot imshow cmap alpha bins tick_params annotate quiver contour barh stackplot subplots_adjust axhline axvline semilogx semilogy loglog polar streamplot hexbin pcolor tricontour errorbar clabel set_aspect violinplot set_axis_off spines text hatch plt axis plt.bar() plt.axis import figure pyplot highlight_text pypalettes plt.subplots() xlabel ylabel title legend colorbar savefig tight_layout grid set_xlim set_ylim plot scatter hist boxplot imshow cmap alpha bins tick_params annotate quiver contour barh stackplot subplots_adjust axhline axvline semilogx semilogy loglog polar streamplot hexbin pcolor tricontour errorbar clabel set_aspect violinplot set_axis_off spines text hatch plt axis plt.bar() plt.axis import figure pyplot highlight_text pypalettes plt.subplots() xlabel ylabel title legend colorbar savefig tight_layout grid set_xlim set_ylim plot scatter hist boxplot imshow cmap alpha bins tick_params annotate quiver contour barh stackplot subplots_adjust axhline axvline semilogx semilogy loglog polar streamplot hexbin pcolor tricontour errorbar clabel set_aspect violinplot set_axis_off spines text hatch plt axis plt.bar() plt.axis import figure pyplot highlight_text pypalettes plt.subplots() xlabel ylabel title legend colorbar savefig tight_layout grid set_xlim set_ylim plot scatter hist boxplot imshow cmap alpha bins tick_params annotate quiver contour barh stackplot subplots_adjust axhline axvline semilogx semilogy loglog polar streamplot hexbin pcolor tricontour errorbar clabel set_aspect violinplot set_axis_off spines text hatch plt axis plt.bar() plt.axis import figure pyplot highlight_text pypalettes plt.subplots() xlabel ylabel title legend colorbar savefig tight_layout grid set_xlim set_ylim plot scatter hist boxplot imshow cmap alpha bins tick_params annotate quiver contour barh stackplot subplots_adjust axhline axvline semilogx semilogy loglog polar streamplot hexbin pcolor tricontour errorbar clabel set_aspect violinplot set_axis_off spines text hatch plt axis plt.bar() plt.axis import figure pyplot highlight_text pypalettes plt.subplots() xlabel ylabel title legend colorbar savefig tight_layout grid set_xlim set_ylim plot scatter hist boxplot imshow cmap alpha bins tick_params annotate quiver contour barh stackplot subplots_adjust axhline axvline semilogx semilogy loglog polar streamplot hexbin pcolor tricontour errorbar clabel set_aspect violinplot set_axis_off spines text hatch plt axis plt.bar() plt.axis import figure pyplot highlight_text pypalettes plt.subplots() xlabel ylabel title legend colorbar savefig tight_layout grid set_xlim set_ylim plot scatter hist boxplot imshow cmap alpha bins tick_params annotate quiver contour barh stackplot subplots_adjust axhline axvline semilogx semilogy loglog polar streamplot hexbin pcolor tricontour errorbar clabel set_aspect violinplot set_axis_off spines text hatch plt axis plt.bar() plt.axis import figure pyplot highlight_text pypalettes plt.subplots() xlabel ylabel title legend colorbar savefig tight_layout grid set_xlim set_ylim plot scatter hist boxplot imshow cmap alpha bins tick_params annotate quiver contour barh stackplot subplots_adjust axhline axvline semilogx semilogy loglog polar streamplot hexbin pcolor tricontour errorbar clabel set_aspect violinplot set_axis_off spines text hatch plt axis plt.bar() plt.axis import figure pyplot highlight_text pypalettes plt.subplots() xlabel ylabel title legend colorbar savefig tight_layout grid set_xlim set_ylim plot scatter hist boxplot imshow cmap alpha bins tick_params annotate quiver contour barh stackplot subplots_adjust axhline axvline semilogx semilogy loglog polar streamplot hexbin pcolor tricontour errorbar clabel set_aspect violinplot set_axis_off spines text hatch plt axis plt.bar() plt.axis import figure pyplot highlight_text pypalettes plt.subplots() xlabel ylabel title legend colorbar savefig tight_layout grid set_xlim set_ylim plot scatter hist boxplot imshow cmap alpha bins tick_params annotate quiver contour barh stackplot subplots_adjust axhline axvline semilogx semilogy loglog polar streamplot hexbin pcolor tricontour errorbar clabel set_aspect violinplot set_axis_off spines text hatch plt axis plt.bar() plt.axis import figure pyplot highlight_text pypalettes plt.subplots() xlabel ylabel title legend colorbar savefig tight_layout grid set_xlim set_ylim plot scatter hist boxplot imshow cmap alpha bins tick_params annotate quiver contour barh stackplot subplots_adjust axhline axvline semilogx semilogy loglog polar streamplot hexbin pcolor tricontour errorbar clabel set_aspect violinplot set_axis_off spines text hatch plt axis plt.bar() plt.axis import figure pyplot highlight_text pypalettes plt.subplots() xlabel ylabel title legend colorbar savefig tight_layout grid set_xlim set_ylim plot scatter hist boxplot imshow cmap alpha bins tick_params annotate quiver contour barh stackplot subplots_adjust axhline axvline semilogx semilogy loglog polar streamplot hexbin pcolor tricontour errorbar clabel set_aspect violinplot set_axis_off spines text hatch plt axis plt.bar() plt.axis import figure pyplot highlight_text pypalettes plt.subplots() xlabel ylabel title legend colorbar savefig tight_layout grid set_xlim set_ylim plot scatter hist boxplot imshow cmap alpha bins tick_params annotate quiver contour barh stackplot subplots_adjust axhline axvline semilogx semilogy loglog polar streamplot hexbin pcolor tricontour errorbar clabel set_aspect violinplot set_axis_off spines text hatch plt axis plt.bar() plt.axis import figure pyplot highlight_text pypalettes plt.subplots() xlabel ylabel title legend colorbar savefig tight_layout grid set_xlim set_ylim plot scatter hist boxplot imshow cmap alpha bins tick_params annotate quiver contour barh stackplot subplots_adjust axhline axvline semilogx semilogy loglog polar streamplot hexbin pcolor tricontour errorbar clabel set_aspect violinplot set_axis_off spines text hatch plt axis plt.bar() plt.axis import figure pyplot highlight_text pypalettes plt.subplots() xlabel ylabel title legend colorbar savefig tight_layout grid set_xlim set_ylim plot scatter hist boxplot imshow cmap alpha bins tick_params annotate quiver contour barh stackplot subplots_adjust axhline axvline semilogx semilogy loglog polar streamplot hexbin pcolor tricontour errorbar clabel set_aspect violinplot set_axis_off spines text hatch plt axis plt.bar() plt.axis import figure pyplot highlight_text pypalettes plt.subplots() xlabel ylabel title legend colorbar savefig tight_layout grid set_xlim set_ylim plot scatter hist boxplot imshow cmap alpha bins tick_params annotate quiver contour barh stackplot subplots_adjust axhline axvline semilogx semilogy loglog polar streamplot hexbin pcolor tricontour errorbar clabel set_aspect violinplot set_axis_off spines text hatch plt axis plt.bar() plt.axis import figure pyplot highlight_text pypalettes plt.subplots() xlabel ylabel title legend colorbar savefig tight_layout grid set_xlim set_ylim plot scatter hist boxplot imshow cmap alpha bins tick_params annotate quiver contour barh stackplot subplots_adjust axhline axvline semilogx semilogy loglog polar streamplot hexbin pcolor tricontour errorbar clabel set_aspect violinplot set_axis_off spines text hatch plt axis plt.bar() plt.axis import figure pyplot highlight_text pypalettes plt.subplots() xlabel ylabel title legend colorbar savefig tight_layout grid set_xlim set_ylim plot scatter hist boxplot imshow cmap alpha bins tick_params annotate quiver contour barh stackplot subplots_adjust axhline axvline semilogx semilogy loglog polar streamplot hexbin pcolor tricontour errorbar clabel set_aspect violinplot set_axis_off spines text hatch plt axis plt.bar() plt.axis import figure pyplot highlight_text pypalettes plt.subplots() xlabel ylabel title legend colorbar savefig tight_layout grid set_xlim set_ylim plot scatter hist boxplot imshow cmap alpha bins tick_params annotate quiver contour barh stackplot subplots_adjust axhline axvline semilogx semilogy loglog polar streamplot hexbin pcolor tricontour errorbar clabel set_aspect violinplot set_axis_off spines text hatch plt axis plt.bar() plt.axis import figure pyplot highlight_text pypalettes plt.subplots() xlabel ylabel title legend colorbar savefig tight_layout grid set_xlim set_ylim plot scatter hist boxplot imshow cmap alpha bins tick_params annotate quiver contour barh stackplot subplots_adjust axhline axvline semilogx semilogy loglog polar streamplot hexbin pcolor tricontour errorbar clabel set_aspect violinplot set_axis_off spines text hatch plt axis plt.bar() plt.axis import figure pyplot highlight_text pypalettes plt.subplots() xlabel ylabel title legend colorbar savefig tight_layout grid set_xlim set_ylim plot scatter hist boxplot imshow cmap alpha bins tick_params annotate quiver contour barh stackplot subplots_adjust axhline axvline semilogx semilogy loglog polar streamplot hexbin pcolor tricontour errorbar clabel set_aspect violinplot set_axis_off spines text hatch plt axis plt.bar() plt.axis import figure pyplot highlight_text pypalettes plt.subplots() xlabel ylabel title legend colorbar savefig tight_layout grid set_xlim set_ylim plot scatter hist boxplot imshow cmap alpha bins tick_params annotate quiver contour barh stackplot subplots_adjust axhline axvline semilogx semilogy loglog polar streamplot hexbin pcolor tricontour errorbar clabel set_aspect violinplot set_axis_off spines text hatch plt axis plt.bar() plt.axis import figure pyplot highlight_text pypalettes plt.subplots() xlabel ylabel title legend colorbar savefig tight_layout grid set_xlim set_ylim plot scatter hist boxplot imshow cmap alpha bins tick_params annotate quiver contour barh stackplot subplots_adjust axhline axvline semilogx semilogy loglog polar streamplot hexbin pcolor tricontour errorbar clabel set_aspect violinplot set_axis_off spines text hatch plt axis plt.bar() plt.axis import figure pyplot highlight_text pypalettes plt.subplots() xlabel ylabel title legend colorbar savefig tight_layout grid set_xlim set_ylim plot scatter hist boxplot imshow cmap alpha bins tick_params annotate quiver contour barh stackplot subplots_adjust axhline axvline semilogx semilogy loglog polar streamplot hexbin pcolor tricontour errorbar clabel set_aspect violinplot set_axis_off spines text hatch plt axis plt.bar() plt.axis import figure pyplot highlight_text pypalettes plt.subplots() xlabel ylabel title legend colorbar savefig tight_layout grid set_xlim set_ylim plot scatter hist boxplot imshow cmap alpha bins tick_params annotate quiver contour barh stackplot subplots_adjust axhline axvline semilogx semilogy loglog polar streamplot hexbin pcolor tricontour errorbar clabel set_aspect violinplot set_axis_off spines text hatch plt axis plt.bar() plt.axis import figure pyplot highlight_text pypalettes plt.subplots() xlabel ylabel title legend colorbar savefig tight_layout grid set_xlim set_ylim plot scatter hist boxplot imshow cmap alpha bins tick_params annotate quiver contour barh stackplot subplots_adjust axhline axvline semilogx semilogy loglog polar streamplot hexbin pcolor tricontour errorbar clabel set_aspect violinplot set_axis_off spines text hatch plt axis plt.bar() plt.axis import figure pyplot highlight_text pypalettes plt.subplots() xlabel ylabel title legend colorbar savefig tight_layout grid set_xlim set_ylim plot scatter hist boxplot imshow cmap alpha bins tick_params annotate quiver contour barh stackplot subplots_adjust axhline axvline semilogx semilogy loglog polar streamplot hexbin pcolor tricontour errorbar clabel set_aspect violinplot set_axis_off spines text hatch plt axis plt.bar() plt.axis import figure pyplot highlight_text pypalettes plt.subplots() xlabel ylabel title legend colorbar savefig tight_layout grid set_xlim set_ylim plot scatter hist boxplot imshow cmap alpha bins tick_params annotate quiver contour barh stackplot subplots_adjust axhline axvline semilogx semilogy loglog polar streamplot hexbin pcolor tricontour errorbar clabel set_aspect violinplot set_axis_off spines text hatch plt axis plt.bar() plt.axis import figure pyplot highlight_text pypalettes plt.subplots() xlabel ylabel title legend colorbar savefig tight_layout grid set_xlim set_ylim plot scatter hist boxplot imshow cmap alpha bins tick_params annotate quiver contour barh stackplot subplots_adjust axhline axvline semilogx semilogy loglog polar streamplot hexbin pcolor tricontour errorbar clabel set_aspect violinplot set_axis_off spines text hatch plt axis plt.bar() plt.axis import figure pyplot highlight_text pypalettes plt.subplots() xlabel ylabel title legend colorbar savefig tight_layout grid set_xlim set_ylim plot scatter hist boxplot imshow cmap alpha bins tick_params annotate quiver contour barh stackplot subplots_adjust axhline axvline semilogx semilogy loglog polar streamplot hexbin pcolor tricontour errorbar clabel set_aspect violinplot set_axis_off spines text hatch plt axis plt.bar() plt.axis import figure pyplot highlight_text pypalettes plt.subplots() xlabel ylabel title legend colorbar savefig tight_layout grid set_xlim set_ylim plot scatter hist boxplot imshow cmap alpha bins tick_params annotate quiver contour barh stackplot subplots_adjust axhline axvline semilogx semilogy loglog polar streamplot hexbin pcolor tricontour errorbar clabel set_aspect violinplot set_axis_off spines text hatch plt axis plt.bar() plt.axis import figure pyplot highlight_text pypalettes plt.subplots() xlabel ylabel title legend colorbar savefig tight_layout grid set_xlim set_ylim plot scatter hist boxplot imshow cmap alpha bins tick_params annotate quiver contour barh stackplot subplots_adjust axhline axvline semilogx semilogy loglog polar streamplot hexbin pcolor tricontour errorbar clabel set_aspect violinplot set_axis_off spines text hatch plt axis plt.bar() plt.axis import figure pyplot highlight_text pypalettes plt.subplots() xlabel ylabel title legend colorbar savefig tight_layout grid set_xlim set_ylim plot scatter hist boxplot imshow cmap alpha bins tick_params annotate quiver contour barh stackplot subplots_adjust axhline axvline semilogx semilogy loglog polar streamplot hexbin pcolor tricontour errorbar clabel set_aspect violinplot set_axis_off spines text hatch plt axis plt.bar() plt.axis import figure pyplot highlight_text pypalettes plt.subplots() xlabel ylabel title legend colorbar savefig tight_layout grid set_xlim set_ylim plot scatter hist boxplot imshow cmap alpha bins tick_params annotate quiver contour barh stackplot subplots_adjust axhline axvline semilogx semilogy loglog polar streamplot hexbin pcolor tricontour errorbar clabel set_aspect violinplot set_axis_off spines text hatch plt axis plt.bar() plt.axis import figure pyplot highlight_text pypalettes plt.subplots() xlabel ylabel title legend colorbar savefig tight_layout grid set_xlim set_ylim plot scatter hist boxplot imshow cmap alpha bins tick_params annotate quiver contour barh stackplot subplots_adjust axhline axvline semilogx semilogy loglog polar streamplot hexbin pcolor tricontour errorbar clabel set_aspect violinplot set_axis_off spines text hatch plt axis plt.bar() plt.axis import figure pyplot highlight_text pypalettes plt.subplots() xlabel ylabel title legend colorbar savefig tight_layout grid set_xlim set_ylim plot scatter hist boxplot imshow cmap alpha bins tick_params annotate quiver contour barh stackplot subplots_adjust axhline axvline semilogx semilogy loglog polar streamplot hexbin pcolor tricontour errorbar clabel set_aspect violinplot set_axis_off spines text hatch plt axis plt.bar() plt.axis import figure pyplot highlight_text pypalettes plt.subplots() xlabel ylabel title legend colorbar savefig tight_layout grid set_xlim set_ylim plot scatter hist boxplot imshow cmap alpha bins tick_params annotate quiver contour barh stackplot subplots_adjust axhline axvline semilogx semilogy loglog polar streamplot hexbin pcolor tricontour errorbar clabel set_aspect violinplot set_axis_off spines text hatch plt axis plt.bar() plt.axis import figure pyplot highlight_text pypalettes plt.subplots() xlabel ylabel title legend colorbar savefig tight_layout grid set_xlim set_ylim plot scatter hist boxplot imshow cmap alpha bins tick_params annotate quiver contour barh stackplot subplots_adjust axhline axvline semilogx semilogy loglog polar streamplot hexbin pcolor tricontour errorbar clabel set_aspect violinplot set_axis_off spines text hatch plt axis plt.bar() plt.axis import figure pyplot highlight_text pypalettes plt.subplots() xlabel ylabel title legend colorbar savefig tight_layout grid set_xlim set_ylim plot scatter hist boxplot imshow cmap alpha bins tick_params annotate quiver contour barh stackplot subplots_adjust axhline axvline semilogx semilogy loglog polar streamplot hexbin pcolor tricontour errorbar clabel set_aspect violinplot set_axis_off spines text hatch plt axis plt.bar() plt.axis import figure pyplot highlight_text pypalettes plt.subplots() xlabel ylabel title legend colorbar savefig tight_layout grid set_xlim set_ylim plot scatter hist boxplot imshow cmap alpha bins tick_params annotate quiver contour barh stackplot subplots_adjust axhline axvline semilogx semilogy loglog polar streamplot hexbin pcolor tricontour errorbar clabel set_aspect violinplot set_axis_off spines text hatch plt axis plt.bar() plt.axis import figure pyplot highlight_text pypalettes plt.subplots() xlabel ylabel title legend colorbar savefig tight_layout grid set_xlim set_ylim plot scatter hist boxplot imshow cmap alpha bins tick_params annotate quiver contour barh stackplot subplots_adjust axhline axvline semilogx semilogy loglog polar streamplot hexbin pcolor tricontour errorbar clabel set_aspect violinplot set_axis_off spines text hatch plt axis plt.bar() plt.axis import figure pyplot highlight_text pypalettes plt.subplots() xlabel ylabel title legend colorbar savefig tight_layout grid set_xlim set_ylim plot scatter hist boxplot imshow cmap alpha bins tick_params annotate quiver contour barh stackplot subplots_adjust axhline axvline semilogx semilogy loglog polar streamplot hexbin pcolor tricontour errorbar clabel set_aspect violinplot set_axis_off spines text hatch plt axis plt.bar() plt.axis import figure pyplot highlight_text pypalettes plt.subplots() xlabel ylabel title legend colorbar savefig tight_layout grid set_xlim set_ylim plot scatter hist boxplot imshow cmap alpha bins tick_params annotate quiver contour barh stackplot subplots_adjust axhline axvline semilogx semilogy loglog polar streamplot hexbin pcolor tricontour errorbar clabel set_aspect violinplot set_axis_off spines text hatch plt axis plt.bar() plt.axis import figure pyplot highlight_text pypalettes plt.subplots() xlabel ylabel title legend colorbar savefig tight_layout grid set_xlim set_ylim plot scatter hist boxplot imshow cmap alpha bins tick_params annotate quiver contour barh stackplot subplots_adjust axhline axvline semilogx semilogy loglog polar streamplot hexbin pcolor tricontour errorbar clabel set_aspect violinplot set_axis_off spines text hatch plt axis plt.bar() plt.axis import figure pyplot highlight_text pypalettes plt.subplots() xlabel ylabel title legend colorbar savefig tight_layout grid set_xlim set_ylim plot scatter hist boxplot imshow cmap alpha bins tick_params annotate quiver contour barh stackplot subplots_adjust axhline axvline semilogx semilogy loglog polar streamplot hexbin pcolor tricontour errorbar clabel set_aspect violinplot set_axis_off spines text hatch plt axis plt.bar() plt.axis import figure pyplot highlight_text pypalettes plt.subplots() xlabel ylabel title legend colorbar savefig tight_layout grid set_xlim set_ylim plot scatter hist boxplot imshow cmap alpha bins tick_params annotate quiver contour barh stackplot subplots_adjust axhline axvline semilogx semilogy loglog polar streamplot hexbin pcolor tricontour errorbar clabel set_aspect violinplot set_axis_off spines text hatch plt axis plt.bar() plt.axis import figure pyplot highlight_text pypalettes plt.subplots() xlabel ylabel title legend colorbar savefig tight_layout grid set_xlim set_ylim plot scatter hist boxplot imshow cmap alpha bins tick_params annotate quiver contour barh stackplot subplots_adjust axhline axvline semilogx semilogy loglog polar streamplot hexbin pcolor tricontour errorbar clabel set_aspect violinplot set_axis_off spines text hatch plt axis plt.bar() plt.axis import figure pyplot highlight_text pypalettes plt.subplots() xlabel ylabel title legend colorbar savefig tight_layout grid set_xlim set_ylim plot scatter hist boxplot imshow cmap alpha bins tick_params annotate quiver contour barh stackplot subplots_adjust axhline axvline semilogx semilogy loglog polar streamplot hexbin pcolor tricontour errorbar clabel set_aspect violinplot set_axis_off spines text hatch plt axis plt.bar() plt.axis import figure pyplot highlight_text pypalettes plt.subplots() xlabel ylabel title legend colorbar savefig tight_layout grid set_xlim set_ylim plot scatter hist boxplot imshow cmap alpha bins tick_params annotate quiver contour barh stackplot subplots_adjust axhline axvline semilogx semilogy loglog polar streamplot hexbin pcolor tricontour errorbar clabel set_aspect violinplot set_axis_off spines text hatch plt axis plt.bar() plt.axis import figure pyplot highlight_text pypalettes plt.subplots() xlabel ylabel title legend colorbar savefig tight_layout grid set_xlim set_ylim plot scatter hist boxplot imshow cmap alpha bins tick_params annotate quiver contour barh stackplot subplots_adjust axhline axvline semilogx semilogy loglog polar streamplot hexbin pcolor tricontour errorbar clabel set_aspect violinplot set_axis_off spines text hatch plt axis plt.bar() plt.axis import figure pyplot highlight_text pypalettes plt.subplots() xlabel ylabel title legend colorbar savefig tight_layout grid set_xlim set_ylim plot scatter hist boxplot imshow cmap alpha bins tick_params annotate quiver contour barh stackplot subplots_adjust axhline axvline semilogx semilogy loglog polar streamplot hexbin pcolor tricontour errorbar clabel set_aspect violinplot set_axis_off spines text hatch plt axis plt.bar() plt.axis import figure pyplot highlight_text pypalettes plt.subplots() xlabel ylabel title legend colorbar savefig tight_layout grid set_xlim set_ylim plot scatter hist boxplot imshow cmap alpha bins tick_params annotate quiver contour barh stackplot subplots_adjust axhline axvline semilogx semilogy loglog polar streamplot hexbin pcolor tricontour errorbar clabel set_aspect violinplot set_axis_off spines text hatch plt axis plt.bar() plt.axis import figure pyplot highlight_text pypalettes plt.subplots() xlabel ylabel title legend colorbar savefig tight_layout grid set_xlim set_ylim plot scatter hist boxplot imshow cmap alpha bins tick_params annotate quiver contour barh stackplot subplots_adjust axhline axvline semilogx semilogy loglog polar streamplot hexbin pcolor tricontour errorbar clabel set_aspect violinplot set_axis_off spines text hatch plt axis plt.bar() plt.axis import figure pyplot highlight_text pypalettes plt.subplots() xlabel ylabel title legend colorbar savefig tight_layout grid set_xlim set_ylim plot scatter hist boxplot imshow cmap alpha bins tick_params annotate quiver contour barh stackplot subplots_adjust axhline axvline semilogx semilogy loglog polar streamplot hexbin pcolor tricontour errorbar clabel set_aspect violinplot set_axis_off spines text hatch plt axis plt.bar() plt.axis import figure pyplot highlight_text pypalettes plt.subplots() xlabel ylabel title legend colorbar savefig tight_layout grid set_xlim set_ylim plot scatter hist boxplot imshow cmap alpha bins tick_params annotate quiver contour barh stackplot subplots_adjust axhline axvline semilogx semilogy loglog polar streamplot hexbin pcolor tricontour errorbar clabel set_aspect violinplot set_axis_off spines text hatch plt axis plt.bar() plt.axis import figure pyplot highlight_text pypalettes plt.subplots() xlabel ylabel title legend colorbar savefig tight_layout grid set_xlim set_ylim plot scatter hist boxplot imshow cmap alpha bins tick_params annotate quiver contour barh stackplot subplots_adjust axhline axvline semilogx semilogy loglog polar streamplot hexbin pcolor tricontour errorbar clabel set_aspect violinplot set_axis_off spines text hatch plt axis plt.bar() plt.axis import figure pyplot highlight_text pypalettes plt.subplots() xlabel ylabel title legend colorbar savefig tight_layout grid set_xlim set_ylim plot scatter hist boxplot imshow cmap alpha bins tick_params annotate quiver contour barh stackplot subplots_adjust axhline axvline semilogx semilogy loglog polar streamplot hexbin pcolor tricontour errorbar clabel set_aspect violinplot set_axis_off spines text hatch plt axis plt.bar() plt.axis import figure pyplot highlight_text pypalettes plt.subplots() xlabel ylabel title legend colorbar savefig tight_layout grid set_xlim set_ylim plot scatter hist boxplot imshow cmap alpha bins tick_params annotate quiver contour barh stackplot subplots_adjust axhline axvline semilogx semilogy loglog polar streamplot hexbin pcolor tricontour errorbar clabel set_aspect violinplot set_axis_off spines text hatch plt axis plt.bar() plt.axis import figure pyplot highlight_text pypalettes plt.subplots() xlabel ylabel title legend colorbar savefig tight_layout grid set_xlim set_ylim plot scatter hist boxplot imshow cmap alpha bins tick_params annotate quiver contour barh stackplot subplots_adjust axhline axvline semilogx semilogy loglog polar streamplot hexbin pcolor tricontour errorbar clabel set_aspect violinplot set_axis_off spines text hatch plt axis plt.bar() plt.axis import figure pyplot highlight_text pypalettes plt.subplots() xlabel ylabel title legend colorbar savefig tight_layout grid set_xlim set_ylim plot scatter hist boxplot imshow cmap alpha bins tick_params annotate quiver contour barh stackplot subplots_adjust axhline axvline semilogx semilogy loglog polar streamplot hexbin pcolor tricontour errorbar clabel set_aspect violinplot set_axis_off spines text hatch plt axis plt.bar() plt.axis import figure pyplot highlight_text pypalettes plt.subplots() xlabel ylabel title legend colorbar savefig tight_layout grid set_xlim set_ylim plot scatter hist boxplot imshow cmap alpha bins tick_params annotate quiver contour barh stackplot subplots_adjust axhline axvline semilogx semilogy loglog polar streamplot hexbin pcolor tricontour errorbar clabel set_aspect violinplot set_axis_off spines text hatch plt axis plt.bar() plt.axis import figure pyplot highlight_text pypalettes plt.subplots() xlabel ylabel title legend colorbar savefig tight_layout grid set_xlim set_ylim plot scatter hist boxplot imshow cmap alpha bins tick_params annotate quiver contour barh stackplot subplots_adjust axhline axvline semilogx semilogy loglog polar streamplot hexbin pcolor tricontour errorbar clabel set_aspect violinplot set_axis_off spines text hatch plt axis plt.bar() plt.axis import figure pyplot highlight_text pypalettes plt.subplots() xlabel ylabel title legend colorbar savefig tight_layout grid set_xlim set_ylim plot scatter hist boxplot imshow cmap alpha bins tick_params annotate quiver contour barh stackplot subplots_adjust axhline axvline semilogx semilogy loglog polar streamplot hexbin pcolor tricontour errorbar clabel set_aspect violinplot set_axis_off spines text hatch plt axis plt.bar() plt.axis import figure pyplot highlight_text pypalettes plt.subplots() xlabel ylabel title legend colorbar savefig tight_layout grid set_xlim set_ylim plot scatter hist boxplot imshow cmap alpha bins tick_params annotate quiver contour barh stackplot subplots_adjust axhline axvline semilogx semilogy loglog polar streamplot hexbin pcolor tricontour errorbar clabel set_aspect violinplot set_axis_off spines text hatch plt axis plt.bar() plt.axis import figure pyplot highlight_text pypalettes plt.subplots() xlabel ylabel title legend colorbar savefig tight_layout grid set_xlim set_ylim plot scatter hist boxplot imshow cmap alpha bins tick_params annotate quiver contour barh stackplot subplots_adjust axhline axvline semilogx semilogy loglog polar streamplot hexbin pcolor tricontour errorbar clabel set_aspect violinplot set_axis_off spines text hatch plt axis plt.bar() plt.axis import figure pyplot highlight_text pypalettes plt.subplots() xlabel ylabel title legend colorbar savefig tight_layout grid set_xlim set_ylim plot scatter hist boxplot imshow cmap alpha bins tick_params annotate quiver contour barh stackplot subplots_adjust axhline axvline semilogx semilogy loglog polar streamplot hexbin pcolor tricontour errorbar clabel set_aspect violinplot set_axis_off spines text hatch plt axis plt.bar() plt.axis import figure pyplot highlight_text pypalettes plt.subplots() xlabel ylabel title legend colorbar savefig tight_layout grid set_xlim set_ylim plot scatter hist boxplot imshow cmap alpha bins tick_params annotate quiver contour barh stackplot subplots_adjust axhline axvline semilogx semilogy loglog polar streamplot hexbin pcolor tricontour errorbar clabel set_aspect violinplot set_axis_off spines text hatch plt axis plt.bar() plt.axis import figure pyplot highlight_text pypalettes plt.subplots() xlabel ylabel title legend colorbar savefig tight_layout grid set_xlim set_ylim plot scatter hist boxplot imshow cmap alpha bins tick_params annotate quiver contour barh stackplot subplots_adjust axhline axvline semilogx semilogy loglog polar streamplot hexbin pcolor tricontour errorbar clabel set_aspect violinplot set_axis_off spines text hatch plt axis plt.bar() plt.axis import figure pyplot highlight_text pypalettes plt.subplots() xlabel ylabel title legend colorbar savefig tight_layout grid set_xlim set_ylim plot scatter hist boxplot imshow cmap alpha bins tick_params annotate quiver contour barh stackplot subplots_adjust axhline axvline semilogx semilogy loglog polar streamplot hexbin pcolor tricontour errorbar clabel set_aspect violinplot set_axis_off spines text hatch plt axis plt.bar() plt.axis import figure pyplot highlight_text pypalettes plt.subplots() xlabel ylabel title legend colorbar savefig tight_layout grid set_xlim set_ylim plot scatter hist boxplot imshow cmap alpha bins tick_params annotate quiver contour barh stackplot subplots_adjust axhline axvline semilogx semilogy loglog polar streamplot hexbin pcolor tricontour errorbar clabel set_aspect violinplot set_axis_off spines text hatch plt axis plt.bar() plt.axis import figure pyplot highlight_text pypalettes plt.subplots() xlabel ylabel title legend colorbar savefig tight_layout grid set_xlim set_ylim plot scatter hist boxplot imshow cmap alpha bins tick_params annotate quiver contour barh stackplot subplots_adjust axhline axvline semilogx semilogy loglog polar streamplot hexbin pcolor tricontour errorbar clabel set_aspect violinplot set_axis_off spines text hatch plt axis plt.bar() plt.axis import figure pyplot highlight_text pypalettes plt.subplots() xlabel ylabel title legend colorbar savefig tight_layout grid set_xlim set_ylim plot scatter hist boxplot imshow cmap alpha bins tick_params annotate quiver contour barh stackplot subplots_adjust axhline axvline semilogx semilogy loglog polar streamplot hexbin pcolor tricontour errorbar clabel set_aspect violinplot set_axis_off spines text hatch plt axis plt.bar() plt.axis import figure pyplot highlight_text pypalettes plt.subplots() xlabel ylabel title legend colorbar savefig tight_layout grid set_xlim set_ylim plot scatter hist boxplot imshow cmap alpha bins tick_params annotate quiver contour barh stackplot subplots_adjust axhline axvline semilogx semilogy loglog polar streamplot hexbin pcolor tricontour errorbar clabel set_aspect violinplot set_axis_off spines text hatch plt axis plt.bar() plt.axis import figure pyplot highlight_text pypalettes plt.subplots() xlabel ylabel title legend colorbar savefig tight_layout grid set_xlim set_ylim plot scatter hist boxplot imshow cmap alpha bins tick_params annotate quiver contour barh stackplot subplots_adjust axhline axvline semilogx semilogy loglog polar streamplot hexbin pcolor tricontour errorbar clabel set_aspect violinplot set_axis_off spines text hatch plt axis plt.bar() plt.axis import figure pyplot highlight_text pypalettes plt.subplots() xlabel ylabel title legend colorbar savefig tight_layout grid set_xlim set_ylim plot scatter hist boxplot imshow cmap alpha bins tick_params annotate quiver contour barh stackplot subplots_adjust axhline axvline semilogx semilogy loglog polar streamplot hexbin pcolor tricontour errorbar clabel set_aspect violinplot set_axis_off spines text hatch plt axis plt.bar() plt.axis import figure pyplot highlight_text pypalettes plt.subplots() xlabel ylabel title legend colorbar savefig tight_layout grid set_xlim set_ylim plot scatter hist boxplot imshow cmap alpha bins tick_params annotate quiver contour barh stackplot subplots_adjust axhline axvline semilogx semilogy loglog polar streamplot hexbin pcolor tricontour errorbar clabel set_aspect violinplot set_axis_off spines text hatch plt axis plt.bar() plt.axis import figure pyplot highlight_text pypalettes plt.subplots() xlabel ylabel title legend colorbar savefig tight_layout grid set_xlim set_ylim plot scatter hist boxplot imshow cmap alpha bins tick_params annotate quiver contour barh stackplot subplots_adjust axhline axvline semilogx semilogy loglog polar streamplot hexbin pcolor tricontour errorbar clabel set_aspect violinplot set_axis_off spines text hatch plt axis plt.bar() plt.axis import figure pyplot highlight_text pypalettes plt.subplots() xlabel ylabel title legend colorbar savefig tight_layout grid set_xlim set_ylim plot scatter hist boxplot imshow cmap alpha bins tick_params annotate quiver contour barh stackplot subplots_adjust axhline axvline semilogx semilogy loglog polar streamplot hexbin pcolor tricontour errorbar clabel set_aspect violinplot set_axis_off spines text hatch plt axis plt.bar() plt.axis import figure pyplot highlight_text pypalettes plt.subplots() xlabel ylabel title legend colorbar savefig tight_layout grid set_xlim set_ylim plot scatter hist boxplot imshow cmap alpha bins tick_params annotate quiver contour barh stackplot subplots_adjust axhline axvline semilogx semilogy loglog polar streamplot hexbin pcolor tricontour errorbar clabel set_aspect violinplot set_axis_off spines text hatch plt axis plt.bar() plt.axis import figure pyplot highlight_text pypalettes plt.subplots() xlabel ylabel title legend colorbar savefig tight_layout grid set_xlim set_ylim plot scatter hist boxplot imshow cmap alpha bins tick_params annotate quiver contour barh stackplot subplots_adjust axhline axvline semilogx semilogy loglog polar streamplot hexbin pcolor tricontour errorbar clabel set_aspect violinplot set_axis_off spines text hatch plt axis plt.bar() plt.axis import figure pyplot highlight_text pypalettes plt.subplots() xlabel ylabel title legend colorbar savefig tight_layout grid set_xlim set_ylim plot scatter hist boxplot imshow cmap alpha bins tick_params annotate quiver contour barh stackplot subplots_adjust axhline axvline semilogx semilogy loglog polar streamplot hexbin pcolor tricontour errorbar clabel set_aspect violinplot set_axis_off spines text hatch plt axis plt.bar() plt.axis import figure pyplot highlight_text pypalettes plt.subplots() xlabel ylabel title legend colorbar savefig tight_layout grid set_xlim set_ylim plot scatter hist boxplot imshow cmap alpha bins tick_params annotate quiver contour barh stackplot subplots_adjust axhline axvline semilogx semilogy loglog polar streamplot hexbin pcolor tricontour errorbar clabel set_aspect violinplot set_axis_off spines text hatch plt axis plt.bar() plt.axis import figure pyplot highlight_text pypalettes plt.subplots() xlabel ylabel title legend colorbar savefig tight_layout grid set_xlim set_ylim plot scatter hist boxplot imshow cmap alpha bins tick_params annotate quiver contour barh stackplot subplots_adjust axhline axvline semilogx semilogy loglog polar streamplot hexbin pcolor tricontour errorbar clabel set_aspect violinplot set_axis_off spines text hatch plt axis plt.bar() plt.axis import figure pyplot highlight_text pypalettes plt.subplots() xlabel ylabel title legend colorbar savefig tight_layout grid set_xlim set_ylim plot scatter hist boxplot imshow cmap alpha bins tick_params annotate quiver contour barh stackplot subplots_adjust axhline axvline semilogx semilogy loglog polar streamplot hexbin pcolor tricontour errorbar clabel set_aspect violinplot set_axis_off spines text hatch plt axis plt.bar() plt.axis import figure pyplot highlight_text pypalettes plt.subplots() xlabel ylabel title legend colorbar savefig tight_layout grid set_xlim set_ylim plot scatter hist boxplot imshow cmap alpha bins tick_params annotate quiver contour barh stackplot subplots_adjust axhline axvline semilogx semilogy loglog polar streamplot hexbin pcolor tricontour errorbar clabel set_aspect violinplot set_axis_off spines text hatch plt axis plt.bar() plt.axis import figure pyplot highlight_text pypalettes plt.subplots() xlabel ylabel title legend colorbar savefig tight_layout grid set_xlim set_ylim plot scatter hist boxplot imshow cmap alpha bins tick_params annotate quiver contour barh stackplot subplots_adjust axhline axvline semilogx semilogy loglog polar streamplot hexbin pcolor tricontour errorbar clabel set_aspect violinplot set_axis_off spines text hatch plt axis plt.bar() plt.axis import figure pyplot highlight_text pypalettes plt.subplots() xlabel ylabel title legend colorbar savefig tight_layout grid set_xlim set_ylim plot scatter hist boxplot imshow cmap alpha bins tick_params annotate quiver contour barh stackplot subplots_adjust axhline axvline semilogx semilogy loglog polar streamplot hexbin pcolor tricontour errorbar clabel set_aspect violinplot set_axis_off spines text hatch plt axis plt.bar() plt.axis import figure pyplot highlight_text pypalettes plt.subplots() xlabel ylabel title legend colorbar savefig tight_layout grid set_xlim set_ylim plot scatter hist boxplot imshow cmap alpha bins tick_params annotate quiver contour barh stackplot subplots_adjust axhline axvline semilogx semilogy loglog polar streamplot hexbin pcolor tricontour errorbar clabel set_aspect violinplot set_axis_off spines text hatch plt axis plt.bar() plt.axis import figure pyplot highlight_text pypalettes plt.subplots() xlabel ylabel title legend colorbar savefig tight_layout grid set_xlim set_ylim plot scatter hist boxplot imshow cmap alpha bins tick_params annotate quiver contour barh stackplot subplots_adjust axhline axvline semilogx semilogy loglog polar streamplot hexbin pcolor tricontour errorbar clabel set_aspect violinplot set_axis_off spines text hatch plt axis plt.bar() plt.axis import figure pyplot highlight_text pypalettes plt.subplots() xlabel ylabel title legend colorbar savefig tight_layout grid set_xlim set_ylim plot scatter hist boxplot imshow cmap alpha bins tick_params annotate quiver contour barh stackplot subplots_adjust axhline axvline semilogx semilogy loglog polar streamplot hexbin pcolor tricontour errorbar clabel set_aspect violinplot set_axis_off spines text hatch plt axis plt.bar() plt.axis import figure pyplot highlight_text pypalettes plt.subplots() xlabel ylabel title legend colorbar savefig tight_layout grid set_xlim set_ylim plot scatter hist boxplot imshow cmap alpha bins tick_params annotate quiver contour barh stackplot subplots_adjust axhline axvline semilogx semilogy loglog polar streamplot hexbin pcolor tricontour errorbar clabel set_aspect violinplot set_axis_off spines text hatch plt axis plt.bar() plt.axis import figure pyplot highlight_text pypalettes plt.subplots() xlabel ylabel title legend colorbar savefig tight_layout grid set_xlim set_ylim plot scatter hist boxplot imshow cmap alpha bins tick_params annotate quiver contour barh stackplot subplots_adjust axhline axvline semilogx semilogy loglog polar streamplot hexbin pcolor tricontour errorbar clabel set_aspect violinplot set_axis_off spines text hatch plt axis plt.bar() plt.axis import figure pyplot highlight_text pypalettes plt.subplots() xlabel ylabel title legend colorbar savefig tight_layout grid set_xlim set_ylim plot scatter hist boxplot imshow cmap alpha bins tick_params annotate quiver contour barh stackplot subplots_adjust axhline axvline semilogx semilogy loglog polar streamplot hexbin pcolor tricontour errorbar clabel set_aspect violinplot set_axis_off spines text hatch plt axis plt.bar() plt.axis import figure pyplot highlight_text pypalettes plt.subplots() xlabel ylabel title legend colorbar savefig tight_layout grid set_xlim set_ylim plot scatter hist boxplot imshow cmap alpha bins tick_params annotate quiver contour barh stackplot subplots_adjust axhline axvline semilogx semilogy loglog polar streamplot hexbin pcolor tricontour errorbar clabel set_aspect violinplot set_axis_off spines text hatch plt axis plt.bar() plt.axis import figure pyplot highlight_text pypalettes plt.subplots() xlabel ylabel title legend colorbar savefig tight_layout grid set_xlim set_ylim plot scatter hist boxplot imshow cmap alpha bins tick_params annotate quiver contour barh stackplot subplots_adjust axhline axvline semilogx semilogy loglog polar streamplot hexbin pcolor tricontour errorbar clabel set_aspect violinplot set_axis_off spines text hatch plt axis plt.bar() plt.axis import figure pyplot highlight_text pypalettes plt.subplots() xlabel ylabel title legend colorbar savefig tight_layout grid set_xlim set_ylim plot scatter hist boxplot imshow cmap alpha bins tick_params annotate quiver contour barh stackplot subplots_adjust axhline axvline semilogx semilogy loglog polar streamplot hexbin pcolor tricontour errorbar clabel set_aspect violinplot set_axis_off spines text hatch plt axis plt.bar() plt.axis import figure pyplot highlight_text pypalettes plt.subplots() xlabel ylabel title legend colorbar savefig tight_layout grid set_xlim set_ylim plot scatter hist boxplot imshow cmap alpha bins tick_params annotate quiver contour barh stackplot subplots_adjust axhline axvline semilogx semilogy loglog polar streamplot hexbin pcolor tricontour errorbar clabel set_aspect violinplot set_axis_off spines text hatch plt axis plt.bar() plt.axis import figure pyplot highlight_text pypalettes plt.subplots() xlabel ylabel title legend colorbar savefig tight_layout grid set_xlim set_ylim plot scatter hist boxplot imshow cmap alpha bins tick_params annotate quiver contour barh stackplot subplots_adjust axhline axvline semilogx semilogy loglog polar streamplot hexbin pcolor tricontour errorbar clabel set_aspect violinplot set_axis_off spines text hatch plt axis plt.bar() plt.axis import figure pyplot highlight_text pypalettes plt.subplots() xlabel ylabel title legend colorbar savefig tight_layout grid set_xlim set_ylim plot scatter hist boxplot imshow cmap alpha bins tick_params annotate quiver contour barh stackplot subplots_adjust axhline axvline semilogx semilogy loglog polar streamplot hexbin pcolor tricontour errorbar clabel set_aspect violinplot set_axis_off spines text hatch plt axis plt.bar() plt.axis import figure pyplot highlight_text pypalettes plt.subplots() xlabel ylabel title legend colorbar savefig tight_layout grid set_xlim set_ylim plot scatter hist boxplot imshow cmap alpha bins tick_params annotate quiver contour barh stackplot subplots_adjust axhline axvline semilogx semilogy loglog polar streamplot hexbin pcolor tricontour errorbar clabel set_aspect violinplot set_axis_off spines text hatch plt axis plt.bar() plt.axis import figure pyplot highlight_text pypalettes plt.subplots() xlabel ylabel title legend colorbar savefig tight_layout grid set_xlim set_ylim plot scatter hist boxplot imshow cmap alpha bins tick_params annotate quiver contour barh stackplot subplots_adjust axhline axvline semilogx semilogy loglog polar streamplot hexbin pcolor tricontour errorbar clabel set_aspect violinplot set_axis_off spines text hatch plt axis plt.bar() plt.axis import figure pyplot highlight_text pypalettes plt.subplots() xlabel ylabel title legend colorbar savefig tight_layout grid set_xlim set_ylim plot scatter hist boxplot imshow cmap alpha bins tick_params annotate quiver contour barh stackplot subplots_adjust axhline axvline semilogx semilogy loglog polar streamplot hexbin pcolor tricontour errorbar clabel set_aspect violinplot set_axis_off spines text hatch plt axis plt.bar() plt.axis import figure pyplot highlight_text pypalettes plt.subplots() xlabel ylabel title legend colorbar savefig tight_layout grid set_xlim set_ylim plot scatter hist boxplot imshow cmap alpha bins tick_params annotate quiver contour barh stackplot subplots_adjust axhline axvline semilogx semilogy loglog polar streamplot hexbin pcolor tricontour errorbar clabel set_aspect violinplot set_axis_off spines text hatch plt axis plt.bar() plt.axis import figure pyplot highlight_text pypalettes plt.subplots() xlabel ylabel title legend colorbar savefig tight_layout grid set_xlim set_ylim plot scatter hist boxplot imshow cmap alpha bins tick_params annotate quiver contour barh stackplot subplots_adjust axhline axvline semilogx semilogy loglog polar streamplot hexbin pcolor tricontour errorbar clabel set_aspect violinplot set_axis_off spines text hatch plt axis plt.bar() plt.axis import figure pyplot highlight_text pypalettes plt.subplots() xlabel ylabel title legend colorbar savefig tight_layout grid set_xlim set_ylim plot scatter hist boxplot imshow cmap alpha bins tick_params annotate quiver contour barh stackplot subplots_adjust axhline axvline semilogx semilogy loglog polar streamplot hexbin pcolor tricontour errorbar clabel set_aspect violinplot set_axis_off spines text hatch plt axis plt.bar() plt.axis import figure pyplot highlight_text pypalettes plt.subplots() xlabel ylabel title legend colorbar savefig tight_layout grid set_xlim set_ylim plot scatter hist boxplot imshow cmap alpha bins tick_params annotate quiver contour barh stackplot subplots_adjust axhline axvline semilogx semilogy loglog polar streamplot hexbin pcolor tricontour errorbar clabel set_aspect violinplot set_axis_off spines text hatch plt axis plt.bar() plt.axis import figure pyplot highlight_text pypalettes plt.subplots() xlabel ylabel title legend colorbar savefig tight_layout grid set_xlim set_ylim plot scatter hist boxplot imshow cmap alpha bins tick_params annotate quiver contour barh stackplot subplots_adjust axhline axvline semilogx semilogy loglog polar streamplot hexbin pcolor tricontour errorbar clabel set_aspect violinplot set_axis_off spines text hatch plt axis plt.bar() plt.axis import figure pyplot highlight_text pypalettes plt.subplots() xlabel ylabel title legend colorbar savefig tight_layout grid set_xlim set_ylim plot scatter hist boxplot imshow cmap alpha bins tick_params annotate quiver contour barh stackplot subplots_adjust axhline axvline semilogx semilogy loglog polar streamplot hexbin pcolor tricontour errorbar clabel set_aspect violinplot set_axis_off spines text hatch plt axis plt.bar() plt.axis import figure pyplot highlight_text pypalettes plt.subplots() xlabel ylabel title legend colorbar savefig tight_layout grid set_xlim set_ylim plot scatter hist boxplot imshow cmap alpha bins tick_params annotate quiver contour barh stackplot subplots_adjust axhline axvline semilogx semilogy loglog polar streamplot hexbin pcolor tricontour errorbar clabel set_aspect violinplot set_axis_off spines text hatch plt axis plt.bar() plt.axis import figure pyplot highlight_text pypalettes plt.subplots() xlabel ylabel title legend colorbar savefig tight_layout grid set_xlim set_ylim plot scatter hist boxplot imshow cmap alpha bins tick_params annotate quiver contour barh stackplot subplots_adjust axhline axvline semilogx semilogy loglog polar streamplot hexbin pcolor tricontour errorbar clabel set_aspect violinplot set_axis_off spines text hatch plt axis plt.bar() plt.axis import figure pyplot highlight_text pypalettes plt.subplots() xlabel ylabel title legend colorbar savefig tight_layout grid set_xlim set_ylim plot scatter hist boxplot imshow cmap alpha bins tick_params annotate quiver contour barh stackplot subplots_adjust axhline axvline semilogx semilogy loglog polar streamplot hexbin pcolor tricontour errorbar clabel set_aspect violinplot set_axis_off spines text hatch plt axis plt.bar() plt.axis import figure pyplot highlight_text pypalettes plt.subplots() xlabel ylabel title legend colorbar savefig tight_layout grid set_xlim set_ylim plot scatter hist boxplot imshow cmap alpha bins tick_params annotate quiver contour barh stackplot subplots_adjust axhline axvline semilogx semilogy loglog polar streamplot hexbin pcolor tricontour errorbar clabel set_aspect violinplot set_axis_off spines text hatch plt axis plt.bar() plt.axis import figure pyplot highlight_text pypalettes plt.subplots() xlabel ylabel title legend colorbar savefig tight_layout grid set_xlim set_ylim plot scatter hist boxplot imshow cmap alpha bins tick_params annotate quiver contour barh stackplot subplots_adjust axhline axvline semilogx semilogy loglog polar streamplot hexbin pcolor tricontour errorbar clabel set_aspect violinplot set_axis_off spines text hatch plt axis plt.bar() plt.axis import figure pyplot highlight_text pypalettes plt.subplots() xlabel ylabel title legend colorbar savefig tight_layout grid set_xlim set_ylim plot scatter hist boxplot imshow cmap alpha bins tick_params annotate quiver contour barh stackplot subplots_adjust axhline axvline semilogx semilogy loglog polar streamplot hexbin pcolor tricontour errorbar clabel set_aspect violinplot set_axis_off spines text hatch plt axis plt.bar() plt.axis import figure pyplot highlight_text pypalettes plt.subplots() xlabel ylabel title legend colorbar savefig tight_layout grid set_xlim set_ylim plot scatter hist boxplot imshow cmap alpha bins tick_params annotate quiver contour barh stackplot subplots_adjust axhline axvline semilogx semilogy loglog polar streamplot hexbin pcolor tricontour errorbar clabel set_aspect violinplot set_axis_off spines text hatch plt axis plt.bar() plt.axis import figure pyplot highlight_text pypalettes plt.subplots() xlabel ylabel title legend colorbar savefig tight_layout grid set_xlim set_ylim plot scatter hist boxplot imshow cmap alpha bins tick_params annotate quiver contour barh stackplot subplots_adjust axhline axvline semilogx semilogy loglog polar streamplot hexbin pcolor tricontour errorbar clabel set_aspect violinplot set_axis_off spines text hatch plt axis plt.bar() plt.axis import figure pyplot highlight_text pypalettes plt.subplots() xlabel ylabel title legend colorbar savefig tight_layout grid set_xlim set_ylim plot scatter hist boxplot imshow cmap alpha bins tick_params annotate quiver contour barh stackplot subplots_adjust axhline axvline semilogx semilogy loglog polar streamplot hexbin pcolor tricontour errorbar clabel set_aspect violinplot set_axis_off spines text hatch plt axis plt.bar() plt.axis import figure pyplot highlight_text pypalettes plt.subplots() xlabel ylabel title legend colorbar savefig tight_layout grid set_xlim set_ylim plot scatter hist boxplot imshow cmap alpha bins tick_params annotate quiver contour barh stackplot subplots_adjust axhline axvline semilogx semilogy loglog polar streamplot hexbin pcolor tricontour errorbar clabel set_aspect violinplot set_axis_off spines text hatch plt axis plt.bar() plt.axis import figure pyplot highlight_text pypalettes plt.subplots() xlabel ylabel title legend colorbar savefig tight_layout grid set_xlim set_ylim plot scatter hist boxplot imshow cmap alpha bins tick_params annotate quiver contour barh stackplot subplots_adjust axhline axvline semilogx semilogy loglog polar streamplot hexbin pcolor tricontour errorbar clabel set_aspect violinplot set_axis_off spines text hatch plt axis plt.bar() plt.axis import figure pyplot highlight_text pypalettes plt.subplots() xlabel ylabel title legend colorbar savefig tight_layout grid set_xlim set_ylim plot scatter hist boxplot imshow cmap alpha bins tick_params annotate quiver contour barh stackplot subplots_adjust axhline axvline semilogx semilogy loglog polar streamplot hexbin pcolor tricontour errorbar clabel set_aspect violinplot set_axis_off spines text hatch plt axis plt.bar() plt.axis import figure pyplot highlight_text pypalettes plt.subplots() xlabel ylabel title legend colorbar savefig tight_layout grid set_xlim set_ylim plot scatter hist boxplot imshow cmap alpha bins tick_params annotate quiver contour barh stackplot subplots_adjust axhline axvline semilogx semilogy loglog polar streamplot hexbin pcolor tricontour errorbar clabel set_aspect violinplot set_axis_off spines text hatch plt axis plt.bar() plt.axis import figure pyplot highlight_text pypalettes plt.subplots() xlabel ylabel title legend colorbar savefig tight_layout grid set_xlim set_ylim plot scatter hist boxplot imshow cmap alpha bins tick_params annotate quiver contour barh stackplot subplots_adjust axhline axvline semilogx semilogy loglog polar streamplot hexbin pcolor tricontour errorbar clabel set_aspect violinplot set_axis_off spines text hatch plt axis plt.bar() plt.axis import figure pyplot highlight_text pypalettes plt.subplots() xlabel ylabel title legend colorbar savefig tight_layout grid set_xlim set_ylim plot scatter hist boxplot imshow cmap alpha bins tick_params annotate quiver contour barh stackplot subplots_adjust axhline axvline semilogx semilogy loglog polar streamplot hexbin pcolor tricontour errorbar clabel set_aspect violinplot set_axis_off spines text hatch plt axis plt.bar() plt.axis import figure pyplot highlight_text pypalettes plt.subplots() xlabel ylabel title legend colorbar savefig tight_layout grid set_xlim set_ylim plot scatter hist boxplot imshow cmap alpha bins tick_params annotate quiver contour barh stackplot subplots_adjust axhline axvline semilogx semilogy loglog polar streamplot hexbin pcolor tricontour errorbar clabel set_aspect violinplot set_axis_off spines text hatch plt axis plt.bar() plt.axis import figure pyplot highlight_text pypalettes plt.subplots() xlabel ylabel title legend colorbar savefig tight_layout grid set_xlim set_ylim plot scatter hist boxplot imshow cmap alpha bins tick_params annotate quiver contour barh stackplot subplots_adjust axhline axvline semilogx semilogy loglog polar streamplot hexbin pcolor tricontour errorbar clabel set_aspect violinplot set_axis_off spines text hatch plt axis plt.bar() plt.axis import figure pyplot highlight_text pypalettes plt.subplots() xlabel ylabel title legend colorbar savefig tight_layout grid set_xlim set_ylim plot scatter hist boxplot imshow cmap alpha bins tick_params annotate quiver contour barh stackplot subplots_adjust axhline axvline semilogx semilogy loglog polar streamplot hexbin pcolor tricontour errorbar clabel set_aspect violinplot set_axis_off spines text hatch plt axis plt.bar() plt.axis import figure pyplot highlight_text pypalettes plt.subplots() xlabel ylabel title legend colorbar savefig tight_layout grid set_xlim set_ylim plot scatter hist boxplot imshow cmap alpha bins tick_params annotate quiver contour barh stackplot subplots_adjust axhline axvline semilogx semilogy loglog polar streamplot hexbin pcolor tricontour errorbar clabel set_aspect violinplot set_axis_off spines text hatch plt axis plt.bar() plt.axis import figure pyplot highlight_text pypalettes plt.subplots() xlabel ylabel title legend colorbar savefig tight_layout grid set_xlim set_ylim plot scatter hist boxplot imshow cmap alpha bins tick_params annotate quiver contour barh stackplot subplots_adjust axhline axvline semilogx semilogy loglog polar streamplot hexbin pcolor tricontour errorbar clabel set_aspect violinplot set_axis_off spines text hatch plt axis plt.bar() plt.axis import figure pyplot highlight_text pypalettes plt.subplots() xlabel ylabel title legend colorbar savefig tight_layout grid set_xlim set_ylim plot scatter hist boxplot imshow cmap alpha bins tick_params annotate quiver contour barh stackplot subplots_adjust axhline axvline semilogx semilogy loglog polar streamplot hexbin pcolor tricontour errorbar clabel set_aspect violinplot set_axis_off spines text hatch plt axis plt.bar() plt.axis import figure pyplot highlight_text pypalettes plt.subplots() xlabel ylabel title legend colorbar savefig tight_layout grid set_xlim set_ylim plot scatter hist boxplot imshow cmap alpha bins tick_params annotate quiver contour barh stackplot subplots_adjust axhline axvline semilogx semilogy loglog polar streamplot hexbin pcolor tricontour errorbar clabel set_aspect violinplot set_axis_off spines text hatch plt axis plt.bar() plt.axis import figure pyplot highlight_text pypalettes plt.subplots() xlabel ylabel title legend colorbar savefig tight_layout grid set_xlim set_ylim plot scatter hist boxplot imshow cmap alpha bins tick_params annotate quiver contour barh stackplot subplots_adjust axhline axvline semilogx semilogy loglog polar streamplot hexbin pcolor tricontour errorbar clabel set_aspect violinplot set_axis_off spines text hatch plt axis plt.bar() plt.axis import figure pyplot highlight_text pypalettes plt.subplots() xlabel ylabel title legend colorbar savefig tight_layout grid set_xlim set_ylim plot scatter hist boxplot imshow cmap alpha bins tick_params annotate quiver contour barh stackplot subplots_adjust axhline axvline semilogx semilogy loglog polar streamplot hexbin pcolor tricontour errorbar clabel set_aspect violinplot set_axis_off spines text hatch plt axis plt.bar() plt.axis import figure pyplot highlight_text pypalettes plt.subplots() xlabel ylabel title legend colorbar savefig tight_layout grid set_xlim set_ylim plot scatter hist boxplot imshow cmap alpha bins tick_params annotate quiver contour barh stackplot subplots_adjust axhline axvline semilogx semilogy loglog polar streamplot hexbin pcolor tricontour errorbar clabel set_aspect violinplot set_axis_off spines text hatch plt axis plt.bar() plt.axis import figure pyplot highlight_text pypalettes plt.subplots() xlabel ylabel title legend colorbar savefig tight_layout grid set_xlim set_ylim plot scatter hist boxplot imshow cmap alpha bins tick_params annotate quiver contour barh stackplot subplots_adjust axhline axvline semilogx semilogy loglog polar streamplot hexbin pcolor tricontour errorbar clabel set_aspect violinplot set_axis_off spines text hatch plt axis plt.bar() plt.axis import figure pyplot highlight_text pypalettes plt.subplots() xlabel ylabel title legend colorbar savefig tight_layout grid set_xlim set_ylim plot scatter hist boxplot imshow cmap alpha bins tick_params annotate quiver contour barh stackplot subplots_adjust axhline axvline semilogx semilogy loglog polar streamplot hexbin pcolor tricontour errorbar clabel set_aspect violinplot set_axis_off spines text hatch plt axis plt.bar() plt.axis import figure pyplot highlight_text pypalettes plt.subplots() xlabel ylabel title legend colorbar savefig tight_layout grid set_xlim set_ylim plot scatter hist boxplot imshow cmap alpha bins tick_params annotate quiver contour barh stackplot subplots_adjust axhline axvline semilogx semilogy loglog polar streamplot hexbin pcolor tricontour errorbar clabel set_aspect violinplot set_axis_off spines text hatch plt axis plt.bar() plt.axis import figure pyplot highlight_text pypalettes plt.subplots() xlabel ylabel title legend colorbar savefig tight_layout grid set_xlim set_ylim plot scatter hist boxplot imshow cmap alpha bins tick_params annotate quiver contour barh stackplot subplots_adjust axhline axvline semilogx semilogy loglog polar streamplot hexbin pcolor tricontour errorbar clabel set_aspect violinplot set_axis_off spines text hatch plt axis plt.bar() plt.axis import figure pyplot highlight_text pypalettes plt.subplots() xlabel ylabel title legend colorbar savefig tight_layout grid set_xlim set_ylim plot scatter hist boxplot imshow cmap alpha bins tick_params annotate quiver contour barh stackplot subplots_adjust axhline axvline semilogx semilogy loglog polar streamplot hexbin pcolor tricontour errorbar clabel set_aspect violinplot set_axis_off spines text hatch plt axis plt.bar() plt.axis import figure pyplot highlight_text pypalettes plt.subplots() xlabel ylabel title legend colorbar savefig tight_layout grid set_xlim set_ylim plot scatter hist boxplot imshow cmap alpha bins tick_params annotate quiver contour barh stackplot subplots_adjust axhline axvline semilogx semilogy loglog polar streamplot hexbin pcolor tricontour errorbar clabel set_aspect violinplot set_axis_off spines text hatch plt axis plt.bar() plt.axis import figure pyplot highlight_text pypalettes plt.subplots() xlabel ylabel title legend colorbar savefig tight_layout grid set_xlim set_ylim plot scatter hist boxplot imshow cmap alpha bins tick_params annotate quiver contour barh stackplot subplots_adjust axhline axvline semilogx semilogy loglog polar streamplot hexbin pcolor tricontour errorbar clabel set_aspect violinplot set_axis_off spines text hatch plt axis plt.bar() plt.axis import figure pyplot highlight_text pypalettes plt.subplots() xlabel ylabel title legend colorbar savefig tight_layout grid set_xlim set_ylim plot scatter hist boxplot imshow cmap alpha bins tick_params annotate quiver contour barh stackplot subplots_adjust axhline axvline semilogx semilogy loglog polar streamplot hexbin pcolor tricontour errorbar clabel set_aspect violinplot set_axis_off spines text hatch plt axis plt.bar() plt.axis import figure pyplot highlight_text pypalettes plt.subplots() xlabel ylabel title legend colorbar savefig tight_layout grid set_xlim set_ylim plot scatter hist boxplot imshow cmap alpha bins tick_params annotate quiver contour barh stackplot subplots_adjust axhline axvline semilogx semilogy loglog polar streamplot hexbin pcolor tricontour errorbar clabel set_aspect violinplot set_axis_off spines text hatch plt axis plt.bar() plt.axis import figure pyplot highlight_text pypalettes plt.subplots() xlabel ylabel title legend colorbar savefig tight_layout grid set_xlim set_ylim plot scatter hist boxplot imshow cmap alpha bins tick_params annotate quiver contour barh stackplot subplots_adjust axhline axvline semilogx semilogy loglog polar streamplot hexbin pcolor tricontour errorbar clabel set_aspect violinplot set_axis_off spines text hatch plt axis plt.bar() plt.axis import figure pyplot highlight_text pypalettes plt.subplots() xlabel ylabel title legend colorbar savefig tight_layout grid set_xlim set_ylim plot scatter hist boxplot imshow cmap alpha bins tick_params annotate quiver contour barh stackplot subplots_adjust axhline axvline semilogx semilogy loglog polar streamplot hexbin pcolor tricontour errorbar clabel set_aspect violinplot set_axis_off spines text hatch plt axis plt.bar() plt.axis import figure pyplot highlight_text pypalettes plt.subplots() xlabel ylabel title legend colorbar savefig tight_layout grid set_xlim set_ylim plot scatter hist boxplot imshow cmap alpha bins tick_params annotate quiver contour barh stackplot subplots_adjust axhline axvline semilogx semilogy loglog polar streamplot hexbin pcolor tricontour errorbar clabel set_aspect violinplot set_axis_off spines text hatch plt axis plt.bar() plt.axis import figure pyplot highlight_text pypalettes plt.subplots() xlabel ylabel title legend colorbar savefig tight_layout grid set_xlim set_ylim plot scatter hist boxplot imshow cmap alpha bins tick_params annotate quiver contour barh stackplot subplots_adjust axhline axvline semilogx semilogy loglog polar streamplot hexbin pcolor tricontour errorbar clabel set_aspect violinplot set_axis_off spines text hatch plt axis plt.bar() plt.axis import figure pyplot highlight_text pypalettes plt.subplots() xlabel ylabel title legend colorbar savefig tight_layout grid set_xlim set_ylim plot scatter hist boxplot imshow cmap alpha bins tick_params annotate quiver contour barh stackplot subplots_adjust axhline axvline semilogx semilogy loglog polar streamplot hexbin pcolor tricontour errorbar clabel set_aspect violinplot set_axis_off spines text hatch plt axis plt.bar() plt.axis import figure pyplot highlight_text pypalettes plt.subplots() xlabel ylabel title legend colorbar savefig tight_layout grid set_xlim set_ylim plot scatter hist boxplot imshow cmap alpha bins tick_params annotate quiver contour barh stackplot subplots_adjust axhline axvline semilogx semilogy loglog polar streamplot hexbin pcolor tricontour errorbar clabel set_aspect violinplot set_axis_off spines text hatch plt axis plt.bar() plt.axis import figure pyplot highlight_text pypalettes plt.subplots() xlabel ylabel title legend colorbar savefig tight_layout grid set_xlim set_ylim plot scatter hist boxplot imshow cmap alpha bins tick_params annotate quiver contour barh stackplot subplots_adjust axhline axvline semilogx semilogy loglog polar streamplot hexbin pcolor tricontour errorbar clabel set_aspect violinplot set_axis_off spines text hatch plt axis plt.bar() plt.axis import figure pyplot highlight_text pypalettes plt.subplots() xlabel ylabel title legend colorbar savefig tight_layout grid set_xlim set_ylim plot scatter hist boxplot imshow cmap alpha bins tick_params annotate quiver contour barh stackplot subplots_adjust axhline axvline semilogx semilogy loglog polar streamplot hexbin pcolor tricontour errorbar clabel set_aspect violinplot set_axis_off spines text hatch plt axis plt.bar() plt.axis import figure pyplot highlight_text pypalettes plt.subplots() xlabel ylabel title legend colorbar savefig tight_layout grid set_xlim set_ylim plot scatter hist boxplot imshow cmap alpha bins tick_params annotate quiver contour barh stackplot subplots_adjust axhline axvline semilogx semilogy loglog polar streamplot hexbin pcolor tricontour errorbar clabel set_aspect violinplot set_axis_off spines text hatch plt axis plt.bar() plt.axis import figure pyplot highlight_text pypalettes plt.subplots() xlabel ylabel title legend colorbar savefig tight_layout grid set_xlim set_ylim plot scatter hist boxplot imshow cmap alpha bins tick_params annotate quiver contour barh stackplot subplots_adjust axhline axvline semilogx semilogy loglog polar streamplot hexbin pcolor tricontour errorbar clabel set_aspect violinplot set_axis_off spines text hatch plt axis plt.bar() plt.axis import figure pyplot highlight_text pypalettes plt.subplots() xlabel ylabel title legend colorbar savefig tight_layout grid set_xlim set_ylim plot scatter hist boxplot imshow cmap alpha bins tick_params annotate quiver contour barh stackplot subplots_adjust axhline axvline semilogx semilogy loglog polar streamplot hexbin pcolor tricontour errorbar clabel set_aspect violinplot set_axis_off spines text hatch plt axis plt.bar() plt.axis import figure pyplot highlight_text pypalettes plt.subplots() xlabel ylabel title legend colorbar savefig tight_layout grid set_xlim set_ylim plot scatter hist boxplot imshow cmap alpha bins tick_params annotate quiver contour barh stackplot subplots_adjust axhline axvline semilogx semilogy loglog polar streamplot hexbin pcolor tricontour errorbar clabel set_aspect violinplot set_axis_off spines text hatch plt axis plt.bar() plt.axis import figure pyplot highlight_text pypalettes plt.subplots() xlabel ylabel title legend colorbar savefig tight_layout grid set_xlim set_ylim plot scatter hist boxplot imshow cmap alpha bins tick_params annotate quiver contour barh stackplot subplots_adjust axhline axvline semilogx semilogy loglog polar streamplot hexbin pcolor tricontour errorbar clabel set_aspect violinplot set_axis_off spines text hatch plt axis plt.bar() plt.axis import figure pyplot highlight_text pypalettes plt.subplots() xlabel ylabel title legend colorbar savefig tight_layout grid set_xlim set_ylim plot scatter hist boxplot imshow cmap alpha bins tick_params annotate quiver contour barh stackplot subplots_adjust axhline axvline semilogx semilogy loglog polar streamplot hexbin pcolor tricontour errorbar clabel set_aspect violinplot set_axis_off spines text hatch plt axis plt.bar() plt.axis import figure pyplot highlight_text pypalettes plt.subplots() xlabel ylabel title legend colorbar savefig tight_layout grid set_xlim set_ylim plot scatter hist boxplot imshow cmap alpha bins tick_params annotate quiver contour barh stackplot subplots_adjust axhline axvline semilogx semilogy loglog polar streamplot hexbin pcolor tricontour errorbar clabel set_aspect violinplot set_axis_off spines text hatch plt axis plt.bar() plt.axis import figure pyplot highlight_text pypalettes plt.subplots() xlabel ylabel title legend colorbar savefig tight_layout grid set_xlim set_ylim plot scatter hist boxplot imshow cmap alpha bins tick_params annotate quiver contour barh stackplot subplots_adjust axhline axvline semilogx semilogy loglog polar streamplot hexbin pcolor tricontour errorbar clabel set_aspect violinplot set_axis_off spines text hatch plt axis plt.bar() plt.axis import figure pyplot highlight_text pypalettes plt.subplots() xlabel ylabel title legend colorbar savefig tight_layout grid set_xlim set_ylim plot scatter hist boxplot imshow cmap alpha bins tick_params annotate quiver contour barh stackplot subplots_adjust axhline axvline semilogx semilogy loglog polar streamplot hexbin pcolor tricontour errorbar clabel set_aspect violinplot set_axis_off spines text hatch plt axis plt.bar() plt.axis import figure pyplot highlight_text pypalettes plt.subplots() xlabel ylabel title legend colorbar savefig tight_layout grid set_xlim set_ylim plot scatter hist boxplot imshow cmap alpha bins tick_params annotate quiver contour barh stackplot subplots_adjust axhline axvline semilogx semilogy loglog polar streamplot hexbin pcolor tricontour errorbar clabel set_aspect violinplot set_axis_off spines text hatch plt axis plt.bar() plt.axis import figure pyplot highlight_text pypalettes plt.subplots() xlabel ylabel title legend colorbar savefig tight_layout grid set_xlim set_ylim plot scatter hist boxplot imshow cmap alpha bins tick_params annotate quiver contour barh stackplot subplots_adjust axhline axvline semilogx semilogy loglog polar streamplot hexbin pcolor tricontour errorbar clabel set_aspect violinplot set_axis_off spines text hatch plt axis plt.bar() plt.axis import figure pyplot highlight_text pypalettes plt.subplots() xlabel ylabel title legend colorbar savefig tight_layout grid set_xlim set_ylim plot scatter hist boxplot imshow cmap alpha bins tick_params annotate quiver contour barh stackplot subplots_adjust axhline axvline semilogx semilogy loglog polar streamplot hexbin pcolor tricontour errorbar clabel set_aspect violinplot set_axis_off spines text hatch plt axis plt.bar() plt.axis import figure pyplot highlight_text pypalettes plt.subplots() xlabel ylabel title legend colorbar savefig tight_layout grid set_xlim set_ylim plot scatter hist boxplot imshow cmap alpha bins tick_params annotate quiver contour barh stackplot subplots_adjust axhline axvline semilogx semilogy loglog polar streamplot hexbin pcolor tricontour errorbar clabel set_aspect violinplot set_axis_off spines text hatch plt axis plt.bar() plt.axis import figure pyplot highlight_text pypalettes plt.subplots() xlabel ylabel title legend colorbar savefig tight_layout grid set_xlim set_ylim plot scatter hist boxplot imshow cmap alpha bins tick_params annotate quiver contour barh stackplot subplots_adjust axhline axvline semilogx semilogy loglog polar streamplot hexbin pcolor tricontour errorbar clabel set_aspect violinplot set_axis_off spines text hatch plt axis plt.bar() plt.axis import figure pyplot highlight_text pypalettes plt.subplots() xlabel ylabel title legend colorbar savefig tight_layout grid set_xlim set_ylim plot scatter hist boxplot imshow cmap alpha bins tick_params annotate quiver contour barh stackplot subplots_adjust axhline axvline semilogx semilogy loglog polar streamplot hexbin pcolor tricontour errorbar clabel set_aspect violinplot set_axis_off spines text hatch plt axis plt.bar() plt.axis import figure pyplot highlight_text pypalettes plt.subplots() xlabel ylabel title legend colorbar savefig tight_layout grid set_xlim set_ylim plot scatter hist boxplot imshow cmap alpha bins tick_params annotate quiver contour barh stackplot subplots_adjust axhline axvline semilogx semilogy loglog polar streamplot hexbin pcolor tricontour errorbar clabel set_aspect violinplot set_axis_off spines text hatch plt axis plt.bar() plt.axis import figure pyplot highlight_text pypalettes plt.subplots() xlabel ylabel title legend colorbar savefig tight_layout grid set_xlim set_ylim plot scatter hist boxplot imshow cmap alpha bins tick_params annotate quiver contour barh stackplot subplots_adjust axhline axvline semilogx semilogy loglog polar streamplot hexbin pcolor tricontour errorbar clabel set_aspect violinplot set_axis_off spines text hatch plt axis plt.bar() plt.axis import figure pyplot highlight_text pypalettes plt.subplots() xlabel ylabel title legend colorbar savefig tight_layout grid set_xlim set_ylim plot scatter hist boxplot imshow cmap alpha bins tick_params annotate quiver contour barh stackplot subplots_adjust axhline axvline semilogx semilogy loglog polar streamplot hexbin pcolor tricontour errorbar clabel set_aspect violinplot set_axis_off spines text hatch plt axis plt.bar() plt.axis import figure pyplot highlight_text pypalettes plt.subplots() xlabel ylabel title legend colorbar savefig tight_layout grid set_xlim set_ylim plot scatter hist boxplot imshow cmap alpha bins tick_params annotate quiver contour barh stackplot subplots_adjust axhline axvline semilogx semilogy loglog polar streamplot hexbin pcolor tricontour errorbar clabel set_aspect violinplot set_axis_off spines text hatch plt axis plt.bar() plt.axis import figure pyplot highlight_text pypalettes plt.subplots() xlabel ylabel title legend colorbar savefig tight_layout grid set_xlim set_ylim plot scatter hist boxplot imshow cmap alpha bins tick_params annotate quiver contour barh stackplot subplots_adjust axhline axvline semilogx semilogy loglog polar streamplot hexbin pcolor tricontour errorbar clabel set_aspect violinplot set_axis_off spines text hatch plt axis plt.bar() plt.axis import figure pyplot highlight_text pypalettes plt.subplots() xlabel ylabel title legend colorbar savefig tight_layout grid set_xlim set_ylim plot scatter hist boxplot imshow cmap alpha bins tick_params annotate quiver contour barh stackplot subplots_adjust axhline axvline semilogx semilogy loglog polar streamplot hexbin pcolor tricontour errorbar clabel set_aspect violinplot set_axis_off spines text hatch plt axis plt.bar() plt.axis import figure pyplot highlight_text pypalettes plt.subplots() xlabel ylabel title legend colorbar savefig tight_layout grid set_xlim set_ylim plot scatter hist boxplot imshow cmap alpha bins tick_params annotate quiver contour barh stackplot subplots_adjust axhline axvline semilogx semilogy loglog polar streamplot hexbin pcolor tricontour errorbar clabel set_aspect violinplot set_axis_off spines text hatch plt axis plt.bar() plt.axis import figure pyplot highlight_text pypalettes plt.subplots() xlabel ylabel title legend colorbar savefig tight_layout grid set_xlim set_ylim plot scatter hist boxplot imshow cmap alpha bins tick_params annotate quiver contour barh stackplot subplots_adjust axhline axvline semilogx semilogy loglog polar streamplot hexbin pcolor tricontour errorbar clabel set_aspect violinplot set_axis_off spines text hatch plt axis plt.bar() plt.axis import figure pyplot highlight_text pypalettes plt.subplots() xlabel ylabel title legend colorbar savefig tight_layout grid set_xlim set_ylim plot scatter hist boxplot imshow cmap alpha bins tick_params annotate quiver contour barh stackplot subplots_adjust axhline axvline semilogx semilogy loglog polar streamplot hexbin pcolor tricontour errorbar clabel set_aspect violinplot set_axis_off spines text hatch plt axis plt.bar() plt.axis import figure pyplot highlight_text pypalettes plt.subplots() xlabel ylabel title legend colorbar savefig tight_layout grid set_xlim set_ylim plot scatter hist boxplot imshow cmap alpha bins tick_params annotate quiver contour barh stackplot subplots_adjust axhline axvline semilogx semilogy loglog polar streamplot hexbin pcolor tricontour errorbar clabel set_aspect violinplot set_axis_off spines text hatch plt axis plt.bar() plt.axis import figure pyplot highlight_text pypalettes plt.subplots() xlabel ylabel title legend colorbar savefig tight_layout grid set_xlim set_ylim plot scatter hist boxplot imshow cmap alpha bins tick_params annotate quiver contour barh stackplot subplots_adjust axhline axvline semilogx semilogy loglog polar streamplot hexbin pcolor tricontour errorbar clabel set_aspect violinplot set_axis_off spines text hatch plt axis plt.bar() plt.axis import figure pyplot highlight_text pypalettes plt.subplots() xlabel ylabel title legend colorbar savefig tight_layout grid set_xlim set_ylim plot scatter hist boxplot imshow cmap alpha bins tick_params annotate quiver contour barh stackplot subplots_adjust axhline axvline semilogx semilogy loglog polar streamplot hexbin pcolor tricontour errorbar clabel set_aspect violinplot set_axis_off spines text hatch plt axis plt.bar() plt.axis import figure pyplot highlight_text pypalettes plt.subplots() xlabel ylabel title legend colorbar savefig tight_layout grid set_xlim set_ylim plot scatter hist boxplot imshow cmap alpha bins tick_params annotate quiver contour barh stackplot subplots_adjust axhline axvline semilogx semilogy loglog polar streamplot hexbin pcolor tricontour errorbar clabel set_aspect violinplot set_axis_off spines text hatch plt axis plt.bar() plt.axis import figure pyplot highlight_text pypalettes plt.subplots() xlabel ylabel title legend colorbar savefig tight_layout grid set_xlim set_ylim plot scatter hist boxplot imshow cmap alpha bins tick_params annotate quiver contour barh stackplot subplots_adjust axhline axvline semilogx semilogy loglog polar streamplot hexbin pcolor tricontour errorbar clabel set_aspect violinplot set_axis_off spines text hatch plt axis plt.bar() plt.axis import figure pyplot highlight_text pypalettes plt.subplots() xlabel ylabel title legend colorbar savefig tight_layout grid set_xlim set_ylim plot scatter hist boxplot imshow cmap alpha bins tick_params annotate quiver contour barh stackplot subplots_adjust axhline axvline semilogx semilogy loglog polar streamplot hexbin pcolor tricontour errorbar clabel set_aspect violinplot set_axis_off spines text hatch plt axis plt.bar() plt.axis import figure pyplot highlight_text pypalettes plt.subplots() xlabel ylabel title legend colorbar savefig tight_layout grid set_xlim set_ylim plot scatter hist boxplot imshow cmap alpha bins tick_params annotate quiver contour barh stackplot subplots_adjust axhline axvline semilogx semilogy loglog polar streamplot hexbin pcolor tricontour errorbar clabel set_aspect violinplot set_axis_off spines text hatch plt axis plt.bar() plt.axis import figure pyplot highlight_text pypalettes plt.subplots() xlabel ylabel title legend colorbar savefig tight_layout grid set_xlim set_ylim plot scatter hist boxplot imshow cmap alpha bins tick_params annotate quiver contour barh stackplot subplots_adjust axhline axvline semilogx semilogy loglog polar streamplot hexbin pcolor tricontour errorbar clabel set_aspect violinplot set_axis_off spines text hatch plt axis plt.bar() plt.axis import figure pyplot highlight_text pypalettes plt.subplots() xlabel ylabel title legend colorbar savefig tight_layout grid set_xlim set_ylim plot scatter hist boxplot imshow cmap alpha bins tick_params annotate quiver contour barh stackplot subplots_adjust axhline axvline semilogx semilogy loglog polar streamplot hexbin pcolor tricontour errorbar clabel set_aspect violinplot set_axis_off spines text hatch plt axis plt.bar() plt.axis import figure pyplot highlight_text pypalettes plt.subplots() xlabel ylabel title legend colorbar savefig tight_layout grid set_xlim set_ylim plot scatter hist boxplot imshow cmap alpha bins tick_params annotate quiver contour barh stackplot subplots_adjust axhline axvline semilogx semilogy loglog polar streamplot hexbin pcolor tricontour errorbar clabel set_aspect violinplot set_axis_off spines text hatch plt axis plt.bar() plt.axis import figure pyplot highlight_text pypalettes plt.subplots() xlabel ylabel title legend colorbar savefig tight_layout grid set_xlim set_ylim plot scatter hist boxplot imshow cmap alpha bins tick_params annotate quiver contour barh stackplot subplots_adjust axhline axvline semilogx semilogy loglog polar streamplot hexbin pcolor tricontour errorbar clabel set_aspect violinplot set_axis_off spines text hatch plt axis plt.bar() plt.axis import figure pyplot highlight_text pypalettes plt.subplots() xlabel ylabel title legend colorbar savefig tight_layout grid set_xlim set_ylim plot scatter hist boxplot imshow cmap alpha bins tick_params annotate quiver contour barh stackplot subplots_adjust axhline axvline semilogx semilogy loglog polar streamplot hexbin pcolor tricontour errorbar clabel set_aspect violinplot set_axis_off spines text hatch plt axis plt.bar() plt.axis import figure pyplot highlight_text pypalettes plt.subplots() xlabel ylabel title legend colorbar savefig tight_layout grid set_xlim set_ylim plot scatter hist boxplot imshow cmap alpha bins tick_params annotate quiver contour barh stackplot subplots_adjust axhline axvline semilogx semilogy loglog polar streamplot hexbin pcolor tricontour errorbar clabel set_aspect violinplot set_axis_off spines text hatch plt axis plt.bar() plt.axis import figure pyplot highlight_text pypalettes plt.subplots() xlabel ylabel title legend colorbar savefig tight_layout grid set_xlim set_ylim plot scatter hist boxplot imshow cmap alpha bins tick_params annotate quiver contour barh stackplot subplots_adjust axhline axvline semilogx semilogy loglog polar streamplot hexbin pcolor tricontour errorbar clabel set_aspect violinplot set_axis_off spines text hatch plt axis plt.bar() plt.axis import figure pyplot highlight_text pypalettes plt.subplots() xlabel ylabel title legend colorbar savefig tight_layout grid set_xlim set_ylim plot scatter hist boxplot imshow cmap alpha bins tick_params annotate quiver contour barh stackplot subplots_adjust axhline axvline semilogx semilogy loglog polar streamplot hexbin pcolor tricontour errorbar clabel set_aspect violinplot set_axis_off spines text hatch plt axis plt.bar() plt.axis import figure pyplot highlight_text pypalettes plt.subplots() xlabel ylabel title legend colorbar savefig tight_layout grid set_xlim set_ylim plot scatter hist boxplot imshow cmap alpha bins tick_params annotate quiver contour barh stackplot subplots_adjust axhline axvline semilogx semilogy loglog polar streamplot hexbin pcolor tricontour errorbar clabel set_aspect violinplot set_axis_off spines text hatch plt axis plt.bar() plt.axis import figure pyplot highlight_text pypalettes plt.subplots() xlabel ylabel title legend colorbar savefig tight_layout grid set_xlim set_ylim plot scatter hist boxplot imshow cmap alpha bins tick_params annotate quiver contour barh stackplot subplots_adjust axhline axvline semilogx semilogy loglog polar streamplot hexbin pcolor tricontour errorbar clabel set_aspect violinplot set_axis_off spines text hatch plt axis plt.bar() plt.axis import figure pyplot highlight_text pypalettes plt.subplots() xlabel ylabel title legend colorbar savefig tight_layout grid set_xlim set_ylim plot scatter hist boxplot imshow cmap alpha bins tick_params annotate quiver contour barh stackplot subplots_adjust axhline axvline semilogx semilogy loglog polar streamplot hexbin pcolor tricontour errorbar clabel set_aspect violinplot set_axis_off spines text hatch plt axis plt.bar() plt.axis import figure pyplot highlight_text pypalettes plt.subplots() xlabel ylabel title legend colorbar savefig tight_layout grid set_xlim set_ylim plot scatter hist boxplot imshow cmap alpha bins tick_params annotate quiver contour barh stackplot subplots_adjust axhline axvline semilogx semilogy loglog polar streamplot hexbin pcolor tricontour errorbar clabel set_aspect violinplot set_axis_off spines text hatch plt axis plt.bar() plt.axis import figure pyplot highlight_text pypalettes plt.subplots() xlabel ylabel title legend colorbar savefig tight_layout grid set_xlim set_ylim plot scatter hist boxplot imshow cmap alpha bins tick_params annotate quiver contour barh stackplot subplots_adjust axhline axvline semilogx semilogy loglog polar streamplot hexbin pcolor tricontour errorbar clabel set_aspect violinplot set_axis_off spines text hatch plt axis plt.bar() plt.axis import figure pyplot highlight_text pypalettes plt.subplots() xlabel ylabel title legend colorbar savefig tight_layout grid set_xlim set_ylim plot scatter hist boxplot imshow cmap alpha bins tick_params annotate quiver contour barh stackplot subplots_adjust axhline axvline semilogx semilogy loglog polar streamplot hexbin pcolor tricontour errorbar clabel set_aspect violinplot set_axis_off spines text hatch plt axis plt.bar() plt.axis import figure pyplot highlight_text pypalettes plt.subplots() xlabel ylabel title legend colorbar savefig tight_layout grid set_xlim set_ylim plot scatter hist boxplot imshow cmap alpha bins tick_params annotate quiver contour barh stackplot subplots_adjust axhline axvline semilogx semilogy loglog polar streamplot hexbin pcolor tricontour errorbar clabel set_aspect violinplot set_axis_off spines text hatch plt axis plt.bar() plt.axis import figure pyplot highlight_text pypalettes plt.subplots() xlabel ylabel title legend colorbar savefig tight_layout grid set_xlim set_ylim plot scatter hist boxplot imshow cmap alpha bins tick_params annotate quiver contour barh stackplot subplots_adjust axhline axvline semilogx semilogy loglog polar streamplot hexbin pcolor tricontour errorbar clabel set_aspect violinplot set_axis_off spines text hatch plt axis plt.bar() plt.axis import figure pyplot highlight_text pypalettes plt.subplots() xlabel ylabel title legend colorbar savefig tight_layout grid set_xlim set_ylim plot scatter hist boxplot imshow cmap alpha bins tick_params annotate quiver contour barh stackplot subplots_adjust axhline axvline semilogx semilogy loglog polar streamplot hexbin pcolor tricontour errorbar clabel set_aspect violinplot set_axis_off spines text hatch plt axis plt.bar() plt.axis import figure pyplot highlight_text pypalettes plt.subplots() xlabel ylabel title legend colorbar savefig tight_layout grid set_xlim set_ylim plot scatter hist boxplot imshow cmap alpha bins tick_params annotate quiver contour barh stackplot subplots_adjust axhline axvline semilogx semilogy loglog polar streamplot hexbin pcolor tricontour errorbar clabel set_aspect violinplot set_axis_off spines text hatch plt axis plt.bar() plt.axis import figure pyplot highlight_text pypalettes plt.subplots() xlabel ylabel title legend colorbar savefig tight_layout grid set_xlim set_ylim plot scatter hist boxplot imshow cmap alpha bins tick_params annotate quiver contour barh stackplot subplots_adjust axhline axvline semilogx semilogy loglog polar streamplot hexbin pcolor tricontour errorbar clabel set_aspect violinplot set_axis_off spines text hatch plt axis plt.bar() plt.axis import figure pyplot highlight_text pypalettes plt.subplots() xlabel ylabel title legend colorbar savefig tight_layout grid set_xlim set_ylim plot scatter hist boxplot imshow cmap alpha bins tick_params annotate quiver contour barh stackplot subplots_adjust axhline axvline semilogx semilogy loglog polar streamplot hexbin pcolor tricontour errorbar clabel set_aspect violinplot set_axis_off spines text hatch plt axis plt.bar() plt.axis import figure pyplot highlight_text pypalettes plt.subplots() xlabel ylabel title legend colorbar savefig tight_layout grid set_xlim set_ylim plot scatter hist boxplot imshow cmap alpha bins tick_params annotate quiver contour barh stackplot subplots_adjust axhline axvline semilogx semilogy loglog polar streamplot hexbin pcolor tricontour errorbar clabel set_aspect violinplot set_axis_off spines text hatch plt axis plt.bar() plt.axis import figure pyplot highlight_text pypalettes plt.subplots() xlabel ylabel title legend colorbar savefig tight_layout grid set_xlim set_ylim plot scatter hist boxplot imshow cmap alpha bins tick_params annotate quiver contour barh stackplot subplots_adjust axhline axvline semilogx semilogy loglog polar streamplot hexbin pcolor tricontour errorbar clabel set_aspect violinplot set_axis_off spines text hatch plt axis plt.bar() plt.axis import figure pyplot highlight_text pypalettes plt.subplots() xlabel ylabel title legend colorbar savefig tight_layout grid set_xlim set_ylim plot scatter hist boxplot imshow cmap alpha bins tick_params annotate quiver contour barh stackplot subplots_adjust axhline axvline semilogx semilogy loglog polar streamplot hexbin pcolor tricontour errorbar clabel set_aspect violinplot set_axis_off spines text hatch plt axis plt.bar() plt.axis import figure pyplot highlight_text pypalettes plt.subplots() xlabel ylabel title legend colorbar savefig tight_layout grid set_xlim set_ylim plot scatter hist boxplot imshow cmap alpha bins tick_params annotate quiver contour barh stackplot subplots_adjust axhline axvline semilogx semilogy loglog polar streamplot hexbin pcolor tricontour errorbar clabel set_aspect violinplot set_axis_off spines text hatch plt axis plt.bar() plt.axis import figure pyplot highlight_text pypalettes plt.subplots() xlabel ylabel title legend colorbar savefig tight_layout grid set_xlim set_ylim plot scatter hist boxplot imshow cmap alpha bins tick_params annotate quiver contour barh stackplot subplots_adjust axhline axvline semilogx semilogy loglog polar streamplot hexbin pcolor tricontour errorbar clabel set_aspect violinplot set_axis_off spines text hatch plt axis plt.bar() plt.axis import figure pyplot highlight_text pypalettes plt.subplots() xlabel ylabel title legend colorbar savefig tight_layout grid set_xlim set_ylim plot scatter hist boxplot imshow cmap alpha bins tick_params annotate quiver contour barh stackplot subplots_adjust axhline axvline semilogx semilogy loglog polar streamplot hexbin pcolor tricontour errorbar clabel set_aspect violinplot set_axis_off spines text hatch plt axis plt.bar() plt.axis import figure pyplot highlight_text pypalettes plt.subplots() xlabel ylabel title legend colorbar savefig tight_layout grid set_xlim set_ylim plot scatter hist boxplot imshow cmap alpha bins tick_params annotate quiver contour barh stackplot subplots_adjust axhline axvline semilogx semilogy loglog polar streamplot hexbin pcolor tricontour errorbar clabel set_aspect violinplot set_axis_off spines text hatch plt axis plt.bar() plt.axis import figure pyplot highlight_text pypalettes plt.subplots() xlabel ylabel title legend colorbar savefig tight_layout grid set_xlim set_ylim plot scatter hist boxplot imshow cmap alpha bins tick_params annotate quiver contour barh stackplot subplots_adjust axhline axvline semilogx semilogy loglog polar streamplot hexbin pcolor tricontour errorbar clabel set_aspect violinplot set_axis_off spines text hatch plt axis plt.bar() plt.axis import figure pyplot highlight_text pypalettes plt.subplots() xlabel ylabel title legend colorbar savefig tight_layout grid set_xlim set_ylim plot scatter hist boxplot imshow cmap alpha bins tick_params annotate quiver contour barh stackplot subplots_adjust axhline axvline semilogx semilogy loglog polar streamplot hexbin pcolor tricontour errorbar clabel set_aspect violinplot set_axis_off spines text hatch plt axis plt.bar() plt.axis import figure pyplot highlight_text pypalettes plt.subplots() xlabel ylabel title legend colorbar savefig tight_layout grid set_xlim set_ylim plot scatter hist boxplot imshow cmap alpha bins tick_params annotate quiver contour barh stackplot subplots_adjust axhline axvline semilogx semilogy loglog polar streamplot hexbin pcolor tricontour errorbar clabel set_aspect violinplot set_axis_off spines text hatch plt axis plt.bar() plt.axis import figure pyplot highlight_text pypalettes plt.subplots() xlabel ylabel title legend colorbar savefig tight_layout grid set_xlim set_ylim plot scatter hist boxplot imshow cmap alpha bins tick_params annotate quiver contour barh stackplot subplots_adjust axhline axvline semilogx semilogy loglog polar streamplot hexbin pcolor tricontour errorbar clabel set_aspect violinplot set_axis_off spines text hatch plt axis plt.bar() plt.axis import figure pyplot highlight_text pypalettes plt.subplots() xlabel ylabel title legend colorbar savefig tight_layout grid set_xlim set_ylim plot scatter hist boxplot imshow cmap alpha bins tick_params annotate quiver contour barh stackplot subplots_adjust axhline axvline semilogx semilogy loglog polar streamplot hexbin pcolor tricontour errorbar clabel set_aspect violinplot set_axis_off spines text hatch plt axis plt.bar() plt.axis import figure pyplot highlight_text pypalettes plt.subplots() xlabel ylabel title legend colorbar savefig tight_layout grid set_xlim set_ylim plot scatter hist boxplot imshow cmap alpha bins tick_params annotate quiver contour barh stackplot subplots_adjust axhline axvline semilogx semilogy loglog polar streamplot hexbin pcolor tricontour errorbar clabel set_aspect violinplot set_axis_off spines text hatch plt axis plt.bar() plt.axis import figure pyplot highlight_text pypalettes plt.subplots() xlabel ylabel title legend colorbar savefig tight_layout grid set_xlim set_ylim plot scatter hist boxplot imshow cmap alpha bins tick_params annotate quiver contour barh stackplot subplots_adjust axhline axvline semilogx semilogy loglog polar streamplot hexbin pcolor tricontour errorbar clabel set_aspect violinplot set_axis_off spines text hatch plt axis plt.bar() plt.axis import figure pyplot highlight_text pypalettes plt.subplots() xlabel ylabel title legend colorbar savefig tight_layout grid set_xlim set_ylim plot scatter hist boxplot imshow cmap alpha bins tick_params annotate quiver contour barh stackplot subplots_adjust axhline axvline semilogx semilogy loglog polar streamplot hexbin pcolor tricontour errorbar clabel set_aspect violinplot set_axis_off spines text hatch plt axis plt.bar() plt.axis import figure pyplot highlight_text pypalettes plt.subplots() xlabel ylabel title legend colorbar savefig tight_layout grid set_xlim set_ylim plot scatter hist boxplot imshow cmap alpha bins tick_params annotate quiver contour barh stackplot subplots_adjust axhline axvline semilogx semilogy loglog polar streamplot hexbin pcolor tricontour errorbar clabel set_aspect violinplot set_axis_off spines text hatch plt axis plt.bar() plt.axis import figure pyplot highlight_text pypalettes plt.subplots() xlabel ylabel title legend colorbar savefig tight_layout grid set_xlim set_ylim plot scatter hist boxplot imshow cmap alpha bins tick_params annotate quiver contour barh stackplot subplots_adjust axhline axvline semilogx semilogy loglog polar streamplot hexbin pcolor tricontour errorbar clabel set_aspect violinplot set_axis_off spines text hatch plt axis plt.bar() plt.axis import figure pyplot highlight_text pypalettes plt.subplots() xlabel ylabel title legend colorbar savefig tight_layout grid set_xlim set_ylim plot scatter hist boxplot imshow cmap alpha bins tick_params annotate quiver contour barh stackplot subplots_adjust axhline axvline semilogx semilogy loglog polar streamplot hexbin pcolor tricontour errorbar clabel set_aspect violinplot set_axis_off spines text hatch plt axis plt.bar() plt.axis import figure pyplot highlight_text pypalettes plt.subplots() xlabel ylabel title legend colorbar savefig tight_layout grid set_xlim set_ylim plot scatter hist boxplot imshow cmap alpha bins tick_params annotate quiver contour barh stackplot subplots_adjust axhline axvline semilogx semilogy loglog polar streamplot hexbin pcolor tricontour errorbar clabel set_aspect violinplot set_axis_off spines text hatch plt axis plt.bar() plt.axis import figure pyplot highlight_text pypalettes plt.subplots() xlabel ylabel title legend colorbar savefig tight_layout grid set_xlim set_ylim plot scatter hist boxplot imshow cmap alpha bins tick_params annotate quiver contour barh stackplot subplots_adjust axhline axvline semilogx semilogy loglog polar streamplot hexbin pcolor tricontour errorbar clabel set_aspect violinplot set_axis_off spines text hatch plt axis plt.bar() plt.axis import figure pyplot highlight_text pypalettes plt.subplots() xlabel ylabel title legend colorbar savefig tight_layout grid set_xlim set_ylim plot scatter hist boxplot imshow cmap alpha bins tick_params annotate quiver contour barh stackplot subplots_adjust axhline axvline semilogx semilogy loglog polar streamplot hexbin pcolor tricontour errorbar clabel set_aspect violinplot set_axis_off spines text hatch plt axis plt.bar() plt.axis import figure pyplot highlight_text pypalettes plt.subplots() xlabel ylabel title legend colorbar savefig tight_layout grid set_xlim set_ylim plot scatter hist boxplot imshow cmap alpha bins tick_params annotate quiver contour barh stackplot subplots_adjust axhline axvline semilogx semilogy loglog polar streamplot hexbin pcolor tricontour errorbar clabel set_aspect violinplot set_axis_off spines text hatch plt axis plt.bar() plt.axis import figure pyplot highlight_text pypalettes plt.subplots() xlabel ylabel title legend colorbar savefig tight_layout grid set_xlim set_ylim plot scatter hist boxplot imshow cmap alpha bins tick_params annotate quiver contour barh stackplot subplots_adjust axhline axvline semilogx semilogy loglog polar streamplot hexbin pcolor tricontour errorbar clabel set_aspect violinplot set_axis_off spines text hatch plt axis plt.bar() plt.axis import figure pyplot highlight_text pypalettes plt.subplots() xlabel ylabel title legend colorbar savefig tight_layout grid set_xlim set_ylim plot scatter hist boxplot imshow cmap alpha bins tick_params annotate quiver contour barh stackplot subplots_adjust axhline axvline semilogx semilogy loglog polar streamplot hexbin pcolor tricontour errorbar clabel set_aspect violinplot set_axis_off spines text hatch plt axis plt.bar() plt.axis import figure pyplot highlight_text pypalettes plt.subplots() xlabel ylabel title legend colorbar savefig tight_layout grid set_xlim set_ylim plot scatter hist boxplot imshow cmap alpha bins tick_params annotate quiver contour barh stackplot subplots_adjust axhline axvline semilogx semilogy loglog polar streamplot hexbin pcolor tricontour errorbar clabel set_aspect violinplot set_axis_off spines text hatch plt axis plt.bar() plt.axis import figure pyplot highlight_text pypalettes plt.subplots() xlabel ylabel title legend colorbar savefig tight_layout grid set_xlim set_ylim plot scatter hist boxplot imshow cmap alpha bins tick_params annotate quiver contour barh stackplot subplots_adjust axhline axvline semilogx semilogy loglog polar streamplot hexbin pcolor tricontour errorbar clabel set_aspect violinplot set_axis_off spines text hatch plt axis plt.bar() plt.axis import figure pyplot highlight_text pypalettes plt.subplots() xlabel ylabel title legend colorbar savefig tight_layout grid set_xlim set_ylim plot scatter hist boxplot imshow cmap alpha bins tick_params annotate quiver contour barh stackplot subplots_adjust axhline axvline semilogx semilogy loglog polar streamplot hexbin pcolor tricontour errorbar clabel set_aspect violinplot set_axis_off spines text hatch plt axis plt.bar() plt.axis import figure pyplot highlight_text pypalettes plt.subplots() xlabel ylabel title legend colorbar savefig tight_layout grid set_xlim set_ylim plot scatter hist boxplot imshow cmap alpha bins tick_params annotate quiver contour barh stackplot subplots_adjust axhline axvline semilogx semilogy loglog polar streamplot hexbin pcolor tricontour errorbar clabel set_aspect violinplot set_axis_off spines text hatch plt axis plt.bar() plt.axis import figure pyplot highlight_text pypalettes plt.subplots() xlabel ylabel title legend colorbar savefig tight_layout grid set_xlim set_ylim plot scatter hist boxplot imshow cmap alpha bins tick_params annotate quiver contour barh stackplot subplots_adjust axhline axvline semilogx semilogy loglog polar streamplot hexbin pcolor tricontour errorbar clabel set_aspect violinplot set_axis_off spines text hatch plt axis plt.bar() plt.axis import figure pyplot highlight_text pypalettes plt.subplots() xlabel ylabel title legend colorbar savefig tight_layout grid set_xlim set_ylim plot scatter hist boxplot imshow cmap alpha bins tick_params annotate quiver contour barh stackplot subplots_adjust axhline axvline semilogx semilogy loglog polar streamplot hexbin pcolor tricontour errorbar clabel set_aspect violinplot set_axis_off spines text hatch plt axis plt.bar() plt.axis import figure pyplot highlight_text pypalettes plt.subplots() xlabel ylabel title legend colorbar savefig tight_layout grid set_xlim set_ylim plot scatter hist boxplot imshow cmap alpha bins tick_params annotate quiver contour barh stackplot subplots_adjust axhline axvline semilogx semilogy loglog polar streamplot hexbin pcolor tricontour errorbar clabel set_aspect violinplot set_axis_off spines text hatch plt axis plt.bar() plt.axis import figure pyplot highlight_text pypalettes plt.subplots() xlabel ylabel title legend colorbar savefig tight_layout grid set_xlim set_ylim plot scatter hist boxplot imshow cmap alpha bins tick_params annotate quiver contour barh stackplot subplots_adjust axhline axvline semilogx semilogy loglog polar streamplot hexbin pcolor tricontour errorbar clabel set_aspect violinplot set_axis_off spines text hatch plt axis plt.bar() plt.axis import figure pyplot highlight_text pypalettes plt.subplots() xlabel ylabel title legend colorbar savefig tight_layout grid set_xlim set_ylim plot scatter hist boxplot imshow cmap alpha bins tick_params annotate quiver contour barh stackplot subplots_adjust axhline axvline semilogx semilogy loglog polar streamplot hexbin pcolor tricontour errorbar clabel set_aspect violinplot set_axis_off spines text hatch plt axis plt.bar() plt.axis import figure pyplot highlight_text pypalettes plt.subplots() xlabel ylabel title legend colorbar savefig tight_layout grid set_xlim set_ylim plot scatter hist boxplot imshow cmap alpha bins tick_params annotate quiver contour barh stackplot subplots_adjust axhline axvline semilogx semilogy loglog polar streamplot hexbin pcolor tricontour errorbar clabel set_aspect violinplot set_axis_off spines text hatch plt axis plt.bar() plt.axis import figure pyplot highlight_text pypalettes plt.subplots() xlabel ylabel title legend colorbar savefig tight_layout grid set_xlim set_ylim plot scatter hist boxplot imshow cmap alpha bins tick_params annotate quiver contour barh stackplot subplots_adjust axhline axvline semilogx semilogy loglog polar streamplot hexbin pcolor tricontour errorbar clabel set_aspect violinplot set_axis_off spines text hatch plt axis plt.bar() plt.axis import figure pyplot highlight_text pypalettes plt.subplots() xlabel ylabel title legend colorbar savefig tight_layout grid set_xlim set_ylim plot scatter hist boxplot imshow cmap alpha bins tick_params annotate quiver contour barh stackplot subplots_adjust axhline axvline semilogx semilogy loglog polar streamplot hexbin pcolor tricontour errorbar clabel set_aspect violinplot set_axis_off spines text hatch plt axis plt.bar() plt.axis import figure pyplot highlight_text pypalettes plt.subplots() xlabel ylabel title legend colorbar savefig tight_layout grid set_xlim set_ylim plot scatter hist boxplot imshow cmap alpha bins tick_params annotate quiver contour barh stackplot subplots_adjust axhline axvline semilogx semilogy loglog polar streamplot hexbin pcolor tricontour errorbar clabel set_aspect violinplot set_axis_off spines text hatch plt axis plt.bar() plt.axis import figure pyplot highlight_text pypalettes plt.subplots() xlabel ylabel title legend colorbar savefig tight_layout grid set_xlim set_ylim plot scatter hist boxplot imshow cmap alpha bins tick_params annotate quiver contour barh stackplot subplots_adjust axhline axvline semilogx semilogy loglog polar streamplot hexbin pcolor tricontour errorbar clabel set_aspect violinplot set_axis_off spines text hatch plt axis plt.bar() plt.axis import figure pyplot highlight_text pypalettes plt.subplots() xlabel ylabel title legend colorbar savefig tight_layout grid set_xlim set_ylim plot scatter hist boxplot imshow cmap alpha bins tick_params annotate quiver contour barh stackplot subplots_adjust axhline axvline semilogx semilogy loglog polar streamplot hexbin pcolor tricontour errorbar clabel set_aspect violinplot set_axis_off spines text hatch plt axis plt.bar() plt.axis import figure pyplot highlight_text pypalettes plt.subplots() xlabel ylabel title legend colorbar savefig tight_layout grid set_xlim set_ylim plot scatter hist boxplot imshow cmap alpha bins tick_params annotate quiver contour barh stackplot subplots_adjust axhline axvline semilogx semilogy loglog polar streamplot hexbin pcolor tricontour errorbar clabel set_aspect violinplot set_axis_off spines text hatch plt axis plt.bar() plt.axis import figure pyplot highlight_text pypalettes plt.subplots() xlabel ylabel title legend colorbar savefig tight_layout grid set_xlim set_ylim plot scatter hist boxplot imshow cmap alpha bins tick_params annotate quiver contour barh stackplot subplots_adjust axhline axvline semilogx semilogy loglog polar streamplot hexbin pcolor tricontour errorbar clabel set_aspect violinplot set_axis_off spines text hatch plt axis plt.bar() plt.axis import figure pyplot highlight_text pypalettes plt.subplots() xlabel ylabel title legend colorbar savefig tight_layout grid set_xlim set_ylim plot scatter hist boxplot imshow cmap alpha bins tick_params annotate quiver contour barh stackplot subplots_adjust axhline axvline semilogx semilogy loglog polar streamplot hexbin pcolor tricontour errorbar clabel set_aspect violinplot set_axis_off spines text hatch plt axis plt.bar() plt.axis import figure pyplot highlight_text pypalettes plt.subplots() xlabel ylabel title legend colorbar savefig tight_layout grid set_xlim set_ylim plot scatter hist boxplot imshow cmap alpha bins tick_params annotate quiver contour barh stackplot subplots_adjust axhline axvline semilogx semilogy loglog polar streamplot hexbin pcolor tricontour errorbar clabel set_aspect violinplot set_axis_off spines text hatch plt axis plt.bar() plt.axis import figure pyplot highlight_text pypalettes plt.subplots() xlabel ylabel title legend colorbar savefig tight_layout grid set_xlim set_ylim plot scatter hist boxplot imshow cmap alpha bins tick_params annotate quiver contour barh stackplot subplots_adjust axhline axvline semilogx semilogy loglog polar streamplot hexbin pcolor tricontour errorbar clabel set_aspect violinplot set_axis_off spines text hatch plt axis plt.bar() plt.axis import figure pyplot highlight_text pypalettes plt.subplots() xlabel ylabel title legend colorbar savefig tight_layout grid set_xlim set_ylim plot scatter hist boxplot imshow cmap alpha bins tick_params annotate quiver contour barh stackplot subplots_adjust axhline axvline semilogx semilogy loglog polar streamplot hexbin pcolor tricontour errorbar clabel set_aspect violinplot set_axis_off spines text hatch plt axis plt.bar() plt.axis import figure pyplot highlight_text pypalettes plt.subplots() xlabel ylabel title legend colorbar savefig tight_layout grid set_xlim set_ylim plot scatter hist boxplot imshow cmap alpha bins tick_params annotate quiver contour barh stackplot subplots_adjust axhline axvline semilogx semilogy loglog polar streamplot hexbin pcolor tricontour errorbar clabel set_aspect violinplot set_axis_off spines text hatch plt axis plt.bar() plt.axis import figure pyplot highlight_text pypalettes plt.subplots() xlabel ylabel title legend colorbar savefig tight_layout grid set_xlim set_ylim plot scatter hist boxplot imshow cmap alpha bins tick_params annotate quiver contour barh stackplot subplots_adjust axhline axvline semilogx semilogy loglog polar streamplot hexbin pcolor tricontour errorbar clabel set_aspect violinplot set_axis_off spines text hatch plt axis plt.bar() plt.axis import figure pyplot highlight_text pypalettes plt.subplots() xlabel ylabel title legend colorbar savefig tight_layout grid set_xlim set_ylim plot scatter hist boxplot imshow cmap alpha bins tick_params annotate quiver contour barh stackplot subplots_adjust axhline axvline semilogx semilogy loglog polar streamplot hexbin pcolor tricontour errorbar clabel set_aspect violinplot set_axis_off spines text hatch plt axis plt.bar() plt.axis import figure pyplot highlight_text pypalettes plt.subplots() xlabel ylabel title legend colorbar savefig tight_layout grid set_xlim set_ylim plot scatter hist boxplot imshow cmap alpha bins tick_params annotate quiver contour barh stackplot subplots_adjust axhline axvline semilogx semilogy loglog polar streamplot hexbin pcolor tricontour errorbar clabel set_aspect violinplot set_axis_off spines text hatch plt axis plt.bar() plt.axis import figure pyplot highlight_text pypalettes plt.subplots() xlabel ylabel title legend colorbar savefig tight_layout grid set_xlim set_ylim plot scatter hist boxplot imshow cmap alpha bins tick_params annotate quiver contour barh stackplot subplots_adjust axhline axvline semilogx semilogy loglog polar streamplot hexbin pcolor tricontour errorbar clabel set_aspect violinplot set_axis_off spines text hatch plt axis plt.bar() plt.axis import figure pyplot highlight_text pypalettes plt.subplots() xlabel ylabel title legend colorbar savefig tight_layout grid set_xlim set_ylim plot scatter hist boxplot imshow cmap alpha bins tick_params annotate quiver contour barh stackplot subplots_adjust axhline axvline semilogx semilogy loglog polar streamplot hexbin pcolor tricontour errorbar clabel set_aspect violinplot set_axis_off spines text hatch plt axis plt.bar() plt.axis import figure pyplot highlight_text pypalettes plt.subplots() xlabel ylabel title legend colorbar savefig tight_layout grid set_xlim set_ylim plot scatter hist boxplot imshow cmap alpha bins tick_params annotate quiver contour barh stackplot subplots_adjust axhline axvline semilogx semilogy loglog polar streamplot hexbin pcolor tricontour errorbar clabel set_aspect violinplot set_axis_off spines text hatch plt axis plt.bar() plt.axis import figure pyplot highlight_text pypalettes plt.subplots() xlabel ylabel title legend colorbar savefig tight_layout grid set_xlim set_ylim plot scatter hist boxplot imshow cmap alpha bins tick_params annotate quiver contour barh stackplot subplots_adjust axhline axvline semilogx semilogy loglog polar streamplot hexbin pcolor tricontour errorbar clabel set_aspect violinplot set_axis_off spines text hatch plt axis plt.bar() plt.axis import figure pyplot highlight_text pypalettes plt.subplots() xlabel ylabel title legend colorbar savefig tight_layout grid set_xlim set_ylim plot scatter hist boxplot imshow cmap alpha bins tick_params annotate quiver contour barh stackplot subplots_adjust axhline axvline semilogx semilogy loglog polar streamplot hexbin pcolor tricontour errorbar clabel set_aspect violinplot set_axis_off spines text hatch plt axis plt.bar() plt.axis import figure pyplot highlight_text pypalettes plt.subplots() xlabel ylabel title legend colorbar savefig tight_layout grid set_xlim set_ylim plot scatter hist boxplot imshow cmap alpha bins tick_params annotate quiver contour barh stackplot subplots_adjust axhline axvline semilogx semilogy loglog polar streamplot hexbin pcolor tricontour errorbar clabel set_aspect violinplot set_axis_off spines text hatch plt axis plt.bar() plt.axis import figure pyplot highlight_text pypalettes plt.subplots() xlabel ylabel title legend colorbar savefig tight_layout grid set_xlim set_ylim plot scatter hist boxplot imshow cmap alpha bins tick_params annotate quiver contour barh stackplot subplots_adjust axhline axvline semilogx semilogy loglog polar streamplot hexbin pcolor tricontour errorbar clabel set_aspect violinplot set_axis_off spines text hatch plt axis plt.bar() plt.axis import figure pyplot highlight_text pypalettes plt.subplots() xlabel ylabel title legend colorbar savefig tight_layout grid set_xlim set_ylim plot scatter hist boxplot imshow cmap alpha bins tick_params annotate quiver contour barh stackplot subplots_adjust axhline axvline semilogx semilogy loglog polar streamplot hexbin pcolor tricontour errorbar clabel set_aspect violinplot set_axis_off spines text hatch plt axis plt.bar() plt.axis import figure pyplot highlight_text pypalettes plt.subplots() xlabel ylabel title legend colorbar savefig tight_layout grid set_xlim set_ylim plot scatter hist boxplot imshow cmap alpha bins tick_params annotate quiver contour barh stackplot subplots_adjust axhline axvline semilogx semilogy loglog polar streamplot hexbin pcolor tricontour errorbar clabel set_aspect violinplot set_axis_off spines text hatch plt axis plt.bar() plt.axis import figure pyplot highlight_text pypalettes plt.subplots() xlabel ylabel title legend colorbar savefig tight_layout grid set_xlim set_ylim plot scatter hist boxplot imshow cmap alpha bins tick_params annotate quiver contour barh stackplot subplots_adjust axhline axvline semilogx semilogy loglog polar streamplot hexbin pcolor tricontour errorbar clabel set_aspect violinplot set_axis_off spines text hatch plt axis plt.bar() plt.axis import figure pyplot highlight_text pypalettes plt.subplots() xlabel ylabel title legend colorbar savefig tight_layout grid set_xlim set_ylim plot scatter hist boxplot imshow cmap alpha bins tick_params annotate quiver contour barh stackplot subplots_adjust axhline axvline semilogx semilogy loglog polar streamplot hexbin pcolor tricontour errorbar clabel set_aspect violinplot set_axis_off spines text hatch plt axis plt.bar() plt.axis import figure pyplot highlight_text pypalettes plt.subplots() xlabel ylabel title legend colorbar savefig tight_layout grid set_xlim set_ylim plot scatter hist boxplot imshow cmap alpha bins tick_params annotate quiver contour barh stackplot subplots_adjust axhline axvline semilogx semilogy loglog polar streamplot hexbin pcolor tricontour errorbar clabel set_aspect violinplot set_axis_off spines text hatch plt axis plt.bar() plt.axis import figure pyplot highlight_text pypalettes plt.subplots() xlabel ylabel title legend colorbar savefig tight_layout grid set_xlim set_ylim plot scatter hist boxplot imshow cmap alpha bins tick_params annotate quiver contour barh stackplot subplots_adjust axhline axvline semilogx semilogy loglog polar streamplot hexbin pcolor tricontour errorbar clabel set_aspect violinplot set_axis_off spines text hatch plt axis plt.bar() plt.axis import figure pyplot highlight_text pypalettes plt.subplots() xlabel ylabel title legend colorbar savefig tight_layout grid set_xlim set_ylim plot scatter hist boxplot imshow cmap alpha bins tick_params annotate quiver contour barh stackplot subplots_adjust axhline axvline semilogx semilogy loglog polar streamplot hexbin pcolor tricontour errorbar clabel set_aspect violinplot set_axis_off spines text hatch plt axis plt.bar() plt.axis import figure pyplot highlight_text pypalettes plt.subplots() xlabel ylabel title legend colorbar savefig tight_layout grid set_xlim set_ylim plot scatter hist boxplot imshow cmap alpha bins tick_params annotate quiver contour barh stackplot subplots_adjust axhline axvline semilogx semilogy loglog polar streamplot hexbin pcolor tricontour errorbar clabel set_aspect violinplot set_axis_off spines text hatch plt axis plt.bar() plt.axis import figure pyplot highlight_text pypalettes plt.subplots() xlabel ylabel title legend colorbar savefig tight_layout grid set_xlim set_ylim plot scatter hist boxplot imshow cmap alpha bins tick_params annotate quiver contour barh stackplot subplots_adjust axhline axvline semilogx semilogy loglog polar streamplot hexbin pcolor tricontour errorbar clabel set_aspect violinplot set_axis_off spines text hatch plt axis plt.bar() plt.axis import figure pyplot highlight_text pypalettes plt.subplots() xlabel ylabel title legend colorbar savefig tight_layout grid set_xlim set_ylim plot scatter hist boxplot imshow cmap alpha bins tick_params annotate quiver contour barh stackplot subplots_adjust axhline axvline semilogx semilogy loglog polar streamplot hexbin pcolor tricontour errorbar clabel set_aspect violinplot set_axis_off spines text hatch plt axis plt.bar() plt.axis import figure pyplot highlight_text pypalettes plt.subplots() xlabel ylabel title legend colorbar savefig tight_layout grid set_xlim set_ylim plot scatter hist boxplot imshow cmap alpha bins tick_params annotate quiver contour barh stackplot subplots_adjust axhline axvline semilogx semilogy loglog polar streamplot hexbin pcolor tricontour errorbar clabel set_aspect violinplot set_axis_off spines text hatch plt axis plt.bar() plt.axis import figure pyplot highlight_text pypalettes plt.subplots() xlabel ylabel title legend colorbar savefig tight_layout grid set_xlim set_ylim plot scatter hist boxplot imshow cmap alpha bins tick_params annotate quiver contour barh stackplot subplots_adjust axhline axvline semilogx semilogy loglog polar streamplot hexbin pcolor tricontour errorbar clabel set_aspect violinplot set_axis_off spines text hatch plt axis plt.bar() plt.axis import figure pyplot highlight_text pypalettes plt.subplots() xlabel ylabel title legend colorbar savefig tight_layout grid set_xlim set_ylim plot scatter hist boxplot imshow cmap alpha bins tick_params annotate quiver contour barh stackplot subplots_adjust axhline axvline semilogx semilogy loglog polar streamplot hexbin pcolor tricontour errorbar clabel set_aspect violinplot set_axis_off spines text hatch plt axis plt.bar() plt.axis import figure pyplot highlight_text pypalettes plt.subplots() xlabel ylabel title legend colorbar savefig tight_layout grid set_xlim set_ylim plot scatter hist boxplot imshow cmap alpha bins tick_params annotate quiver contour barh stackplot subplots_adjust axhline axvline semilogx semilogy loglog polar streamplot hexbin pcolor tricontour errorbar clabel set_aspect violinplot set_axis_off spines text hatch plt axis plt.bar() plt.axis import figure pyplot highlight_text pypalettes plt.subplots() xlabel ylabel title legend colorbar savefig tight_layout grid set_xlim set_ylim plot scatter hist boxplot imshow cmap alpha bins tick_params annotate quiver contour barh stackplot subplots_adjust axhline axvline semilogx semilogy loglog polar streamplot hexbin pcolor tricontour errorbar clabel set_aspect violinplot set_axis_off spines text hatch plt axis plt.bar() plt.axis import figure pyplot highlight_text pypalettes plt.subplots() xlabel ylabel title legend colorbar savefig tight_layout grid set_xlim set_ylim plot scatter hist boxplot imshow cmap alpha bins tick_params annotate quiver contour barh stackplot subplots_adjust axhline axvline semilogx semilogy loglog polar streamplot hexbin pcolor tricontour errorbar clabel set_aspect violinplot set_axis_off spines text hatch plt axis plt.bar() plt.axis import figure pyplot highlight_text pypalettes plt.subplots() xlabel ylabel title legend colorbar savefig tight_layout grid set_xlim set_ylim plot scatter hist boxplot imshow cmap alpha bins tick_params annotate quiver contour barh stackplot subplots_adjust axhline axvline semilogx semilogy loglog polar streamplot hexbin pcolor tricontour errorbar clabel set_aspect violinplot set_axis_off spines text hatch plt axis plt.bar() plt.axis import figure pyplot highlight_text pypalettes plt.subplots() xlabel ylabel title legend colorbar savefig tight_layout grid set_xlim set_ylim plot scatter hist boxplot imshow cmap alpha bins tick_params annotate quiver contour barh stackplot subplots_adjust axhline axvline semilogx semilogy loglog polar streamplot hexbin pcolor tricontour errorbar clabel set_aspect violinplot set_axis_off spines text hatch plt axis plt.bar() plt.axis import figure pyplot highlight_text pypalettes plt.subplots() xlabel ylabel title legend colorbar savefig tight_layout grid set_xlim set_ylim plot scatter hist boxplot imshow cmap alpha bins tick_params annotate quiver contour barh stackplot subplots_adjust axhline axvline semilogx semilogy loglog polar streamplot hexbin pcolor tricontour errorbar clabel set_aspect violinplot set_axis_off spines text hatch plt axis plt.bar() plt.axis import figure pyplot highlight_text pypalettes plt.subplots() xlabel ylabel title legend colorbar savefig tight_layout grid set_xlim set_ylim plot scatter hist boxplot imshow cmap alpha bins tick_params annotate quiver contour barh stackplot subplots_adjust axhline axvline semilogx semilogy loglog polar streamplot hexbin pcolor tricontour errorbar clabel set_aspect violinplot set_axis_off spines text hatch plt axis plt.bar() plt.axis import figure pyplot highlight_text pypalettes plt.subplots() xlabel ylabel title legend colorbar savefig tight_layout grid set_xlim set_ylim plot scatter hist boxplot imshow cmap alpha bins tick_params annotate quiver contour barh stackplot subplots_adjust axhline axvline semilogx semilogy loglog polar streamplot hexbin pcolor tricontour errorbar clabel set_aspect violinplot set_axis_off spines text hatch plt axis plt.bar() plt.axis import figure pyplot highlight_text pypalettes plt.subplots() xlabel ylabel title legend colorbar savefig tight_layout grid set_xlim set_ylim plot scatter hist boxplot imshow cmap alpha bins tick_params annotate quiver contour barh stackplot subplots_adjust axhline axvline semilogx semilogy loglog polar streamplot hexbin pcolor tricontour errorbar clabel set_aspect violinplot set_axis_off spines text hatch plt axis plt.bar() plt.axis import figure pyplot highlight_text pypalettes plt.subplots() xlabel ylabel title legend colorbar savefig tight_layout grid set_xlim set_ylim plot scatter hist boxplot imshow cmap alpha bins tick_params annotate quiver contour barh stackplot subplots_adjust axhline axvline semilogx semilogy loglog polar streamplot hexbin pcolor tricontour errorbar clabel set_aspect violinplot set_axis_off spines text hatch plt axis plt.bar() plt.axis import figure pyplot highlight_text pypalettes plt.subplots() xlabel ylabel title legend colorbar savefig tight_layout grid set_xlim set_ylim plot scatter hist boxplot imshow cmap alpha bins tick_params annotate quiver contour barh stackplot subplots_adjust axhline axvline semilogx semilogy loglog polar streamplot hexbin pcolor tricontour errorbar clabel set_aspect violinplot set_axis_off spines text hatch plt axis plt.bar() plt.axis import figure pyplot highlight_text pypalettes plt.subplots() xlabel ylabel title legend colorbar savefig tight_layout grid set_xlim set_ylim plot scatter hist boxplot imshow cmap alpha bins tick_params annotate quiver contour barh stackplot subplots_adjust axhline axvline semilogx semilogy loglog polar streamplot hexbin pcolor tricontour errorbar clabel set_aspect violinplot set_axis_off spines text hatch plt axis plt.bar() plt.axis import figure pyplot highlight_text pypalettes plt.subplots() xlabel ylabel title legend colorbar savefig tight_layout grid set_xlim set_ylim plot scatter hist boxplot imshow cmap alpha bins tick_params annotate quiver contour barh stackplot subplots_adjust axhline axvline semilogx semilogy loglog polar streamplot hexbin pcolor tricontour errorbar clabel set_aspect violinplot set_axis_off spines text hatch plt axis plt.bar() plt.axis import figure pyplot highlight_text pypalettes plt.subplots() xlabel ylabel title legend colorbar savefig tight_layout grid set_xlim set_ylim plot scatter hist boxplot imshow cmap alpha bins tick_params annotate quiver contour barh stackplot subplots_adjust axhline axvline semilogx semilogy loglog polar streamplot hexbin pcolor tricontour errorbar clabel set_aspect violinplot set_axis_off spines text hatch plt axis plt.bar() plt.axis import figure pyplot highlight_text pypalettes plt.subplots() xlabel ylabel title legend colorbar savefig tight_layout grid set_xlim set_ylim plot scatter hist boxplot imshow cmap alpha bins tick_params annotate quiver contour barh stackplot subplots_adjust axhline axvline semilogx semilogy loglog polar streamplot hexbin pcolor tricontour errorbar clabel set_aspect violinplot set_axis_off spines text hatch plt axis plt.bar() plt.axis import figure pyplot highlight_text pypalettes plt.subplots() xlabel ylabel title legend colorbar savefig tight_layout grid set_xlim set_ylim plot scatter hist boxplot imshow cmap alpha bins tick_params annotate quiver contour barh stackplot subplots_adjust axhline axvline semilogx semilogy loglog polar streamplot hexbin pcolor tricontour errorbar clabel set_aspect violinplot set_axis_off spines text hatch plt axis plt.bar() plt.axis import figure pyplot highlight_text pypalettes plt.subplots() xlabel ylabel title legend colorbar savefig tight_layout grid set_xlim set_ylim plot scatter hist boxplot imshow cmap alpha bins tick_params annotate quiver contour barh stackplot subplots_adjust axhline axvline semilogx semilogy loglog polar streamplot hexbin pcolor tricontour errorbar clabel set_aspect violinplot set_axis_off spines text hatch plt axis plt.bar() plt.axis import figure pyplot highlight_text pypalettes plt.subplots() xlabel ylabel title legend colorbar savefig tight_layout grid set_xlim set_ylim plot scatter hist boxplot imshow cmap alpha bins tick_params annotate quiver contour barh stackplot subplots_adjust axhline axvline semilogx semilogy loglog polar streamplot hexbin pcolor tricontour errorbar clabel set_aspect violinplot set_axis_off spines text hatch plt axis plt.bar() plt.axis import figure pyplot highlight_text pypalettes plt.subplots() xlabel ylabel title legend colorbar savefig tight_layout grid set_xlim set_ylim plot scatter hist boxplot imshow cmap alpha bins tick_params annotate quiver contour barh stackplot subplots_adjust axhline axvline semilogx semilogy loglog polar streamplot hexbin pcolor tricontour errorbar clabel set_aspect violinplot set_axis_off spines text hatch plt axis plt.bar() plt.axis import figure pyplot highlight_text pypalettes plt.subplots() xlabel ylabel title legend colorbar savefig tight_layout grid set_xlim set_ylim plot scatter hist boxplot imshow cmap alpha bins tick_params annotate quiver contour barh stackplot subplots_adjust axhline axvline semilogx semilogy loglog polar streamplot hexbin pcolor tricontour errorbar clabel set_aspect violinplot set_axis_off spines text hatch plt axis plt.bar() plt.axis import figure pyplot highlight_text pypalettes plt.subplots() xlabel ylabel title legend colorbar savefig tight_layout grid set_xlim set_ylim plot scatter hist boxplot imshow cmap alpha bins tick_params annotate quiver contour barh stackplot subplots_adjust axhline axvline semilogx semilogy loglog polar streamplot hexbin pcolor tricontour errorbar clabel set_aspect violinplot set_axis_off spines text hatch plt axis plt.bar() plt.axis import figure pyplot highlight_text pypalettes plt.subplots() xlabel ylabel title legend colorbar savefig tight_layout grid set_xlim set_ylim plot scatter hist boxplot imshow cmap alpha bins tick_params annotate quiver contour barh stackplot subplots_adjust axhline axvline semilogx semilogy loglog polar streamplot hexbin pcolor tricontour errorbar clabel set_aspect violinplot set_axis_off spines text hatch plt axis plt.bar() plt.axis import figure pyplot highlight_text pypalettes plt.subplots() xlabel ylabel title legend colorbar savefig tight_layout grid set_xlim set_ylim plot scatter hist boxplot imshow cmap alpha bins tick_params annotate quiver contour barh stackplot subplots_adjust axhline axvline semilogx semilogy loglog polar streamplot hexbin pcolor tricontour errorbar clabel set_aspect violinplot set_axis_off spines text hatch plt axis plt.bar() plt.axis import figure pyplot highlight_text pypalettes plt.subplots() xlabel ylabel title legend colorbar savefig tight_layout grid set_xlim set_ylim plot scatter hist boxplot imshow cmap alpha bins tick_params annotate quiver contour barh stackplot subplots_adjust axhline axvline semilogx semilogy loglog polar streamplot hexbin pcolor tricontour errorbar clabel set_aspect violinplot set_axis_off spines text hatch plt axis plt.bar() plt.axis import figure pyplot highlight_text pypalettes plt.subplots() xlabel ylabel title legend colorbar savefig tight_layout grid set_xlim set_ylim plot scatter hist boxplot imshow cmap alpha bins tick_params annotate quiver contour barh stackplot subplots_adjust axhline axvline semilogx semilogy loglog polar streamplot hexbin pcolor tricontour errorbar clabel set_aspect violinplot set_axis_off spines text hatch plt axis plt.bar() plt.axis import figure pyplot highlight_text pypalettes plt.subplots() xlabel ylabel title legend colorbar savefig tight_layout grid set_xlim set_ylim plot scatter hist boxplot imshow cmap alpha bins tick_params annotate quiver contour barh stackplot subplots_adjust axhline axvline semilogx semilogy loglog polar streamplot hexbin pcolor tricontour errorbar clabel set_aspect violinplot set_axis_off spines text hatch plt axis plt.bar() plt.axis import figure pyplot highlight_text pypalettes plt.subplots() xlabel ylabel title legend colorbar savefig tight_layout grid set_xlim set_ylim plot scatter hist boxplot imshow cmap alpha bins tick_params annotate quiver contour barh stackplot subplots_adjust axhline axvline semilogx semilogy loglog polar streamplot hexbin pcolor tricontour errorbar clabel set_aspect violinplot set_axis_off spines text hatch plt axis plt.bar() plt.axis import figure pyplot highlight_text pypalettes plt.subplots() xlabel ylabel title legend colorbar savefig tight_layout grid set_xlim set_ylim plot scatter hist boxplot imshow cmap alpha bins tick_params annotate quiver contour barh stackplot subplots_adjust axhline axvline semilogx semilogy loglog polar streamplot hexbin pcolor tricontour errorbar clabel set_aspect violinplot set_axis_off spines text hatch plt axis plt.bar() plt.axis import figure pyplot highlight_text pypalettes plt.subplots() xlabel ylabel title legend colorbar savefig tight_layout grid set_xlim set_ylim plot scatter hist boxplot imshow cmap alpha bins tick_params annotate quiver contour barh stackplot subplots_adjust axhline axvline semilogx semilogy loglog polar streamplot hexbin pcolor tricontour errorbar clabel set_aspect violinplot set_axis_off spines text hatch plt axis plt.bar() plt.axis import figure pyplot highlight_text pypalettes plt.subplots() xlabel ylabel title legend colorbar savefig tight_layout grid set_xlim set_ylim plot scatter hist boxplot imshow cmap alpha bins tick_params annotate quiver contour barh stackplot subplots_adjust axhline axvline semilogx semilogy loglog polar streamplot hexbin pcolor tricontour errorbar clabel set_aspect violinplot set_axis_off spines text hatch plt axis plt.bar() plt.axis import figure pyplot highlight_text pypalettes plt.subplots() xlabel ylabel title legend colorbar savefig tight_layout grid set_xlim set_ylim plot scatter hist boxplot imshow cmap alpha bins tick_params annotate quiver contour barh stackplot subplots_adjust axhline axvline semilogx semilogy loglog polar streamplot hexbin pcolor tricontour errorbar clabel set_aspect violinplot set_axis_off spines text hatch plt axis plt.bar() plt.axis import figure pyplot highlight_text pypalettes plt.subplots() xlabel ylabel title legend colorbar savefig tight_layout grid set_xlim set_ylim plot scatter hist boxplot imshow cmap alpha bins tick_params annotate quiver contour barh stackplot subplots_adjust axhline axvline semilogx semilogy loglog polar streamplot hexbin pcolor tricontour errorbar clabel set_aspect violinplot set_axis_off spines text hatch plt axis plt.bar() plt.axis import figure pyplot highlight_text pypalettes plt.subplots() xlabel ylabel title legend colorbar savefig tight_layout grid set_xlim set_ylim plot scatter hist boxplot imshow cmap alpha bins tick_params annotate quiver contour barh stackplot subplots_adjust axhline axvline semilogx semilogy loglog polar streamplot hexbin pcolor tricontour errorbar clabel set_aspect violinplot set_axis_off spines text hatch plt axis plt.bar() plt.axis import figure pyplot highlight_text pypalettes plt.subplots() xlabel ylabel title legend colorbar savefig tight_layout grid set_xlim set_ylim plot scatter hist boxplot imshow cmap alpha bins tick_params annotate quiver contour barh stackplot subplots_adjust axhline axvline semilogx semilogy loglog polar streamplot hexbin pcolor tricontour errorbar clabel set_aspect violinplot set_axis_off spines text hatch plt axis plt.bar() plt.axis import figure pyplot highlight_text pypalettes plt.subplots() xlabel ylabel title legend colorbar savefig tight_layout grid set_xlim set_ylim plot scatter hist boxplot imshow cmap alpha bins tick_params annotate quiver contour barh stackplot subplots_adjust axhline axvline semilogx semilogy loglog polar streamplot hexbin pcolor tricontour errorbar clabel set_aspect violinplot set_axis_off spines text hatch plt axis plt.bar() plt.axis import figure pyplot highlight_text pypalettes plt.subplots() xlabel ylabel title legend colorbar savefig tight_layout grid set_xlim set_ylim plot scatter hist boxplot imshow cmap alpha bins tick_params annotate quiver contour barh stackplot subplots_adjust axhline axvline semilogx semilogy loglog polar streamplot hexbin pcolor tricontour errorbar clabel set_aspect violinplot set_axis_off spines text hatch plt axis plt.bar() plt.axis import figure pyplot highlight_text pypalettes plt.subplots() xlabel ylabel title legend colorbar savefig tight_layout grid set_xlim set_ylim plot scatter hist boxplot imshow cmap alpha bins tick_params annotate quiver contour barh stackplot subplots_adjust axhline axvline semilogx semilogy loglog polar streamplot hexbin pcolor tricontour errorbar clabel set_aspect violinplot set_axis_off spines text hatch plt axis plt.bar() plt.axis import figure pyplot highlight_text pypalettes plt.subplots() xlabel ylabel title legend colorbar savefig tight_layout grid set_xlim set_ylim plot scatter hist boxplot imshow cmap alpha bins tick_params annotate quiver contour barh stackplot subplots_adjust axhline axvline semilogx semilogy loglog polar streamplot hexbin pcolor tricontour errorbar clabel set_aspect violinplot set_axis_off spines text hatch plt axis plt.bar() plt.axis import figure pyplot highlight_text pypalettes plt.subplots() xlabel ylabel title legend colorbar savefig tight_layout grid set_xlim set_ylim plot scatter hist boxplot imshow cmap alpha bins tick_params annotate quiver contour barh stackplot subplots_adjust axhline axvline semilogx semilogy loglog polar streamplot hexbin pcolor tricontour errorbar clabel set_aspect violinplot set_axis_off spines text hatch plt axis plt.bar() plt.axis import figure pyplot highlight_text pypalettes plt.subplots() xlabel ylabel title legend colorbar savefig tight_layout grid set_xlim set_ylim plot scatter hist boxplot imshow cmap alpha bins tick_params annotate quiver contour barh stackplot subplots_adjust axhline axvline semilogx semilogy loglog polar streamplot hexbin pcolor tricontour errorbar clabel set_aspect violinplot set_axis_off spines text hatch plt axis plt.bar() plt.axis import figure pyplot highlight_text pypalettes plt.subplots() xlabel ylabel title legend colorbar savefig tight_layout grid set_xlim set_ylim plot scatter hist boxplot imshow cmap alpha bins tick_params annotate quiver contour barh stackplot subplots_adjust axhline axvline semilogx semilogy loglog polar streamplot hexbin pcolor tricontour errorbar clabel set_aspect violinplot set_axis_off spines text hatch plt axis plt.bar() plt.axis import figure pyplot highlight_text pypalettes plt.subplots() xlabel ylabel title legend colorbar savefig tight_layout grid set_xlim set_ylim plot scatter hist boxplot imshow cmap alpha bins tick_params annotate quiver contour barh stackplot subplots_adjust axhline axvline semilogx semilogy loglog polar streamplot hexbin pcolor tricontour errorbar clabel set_aspect violinplot set_axis_off spines text hatch plt axis plt.bar() plt.axis import figure pyplot highlight_text pypalettes plt.subplots() xlabel ylabel title legend colorbar savefig tight_layout grid set_xlim set_ylim plot scatter hist boxplot imshow cmap alpha bins tick_params annotate quiver contour barh stackplot subplots_adjust axhline axvline semilogx semilogy loglog polar streamplot hexbin pcolor tricontour errorbar clabel set_aspect violinplot set_axis_off spines text hatch plt axis plt.bar() plt.axis import figure pyplot highlight_text pypalettes plt.subplots() xlabel ylabel title legend colorbar savefig tight_layout grid set_xlim set_ylim plot scatter hist boxplot imshow cmap alpha bins tick_params annotate quiver contour barh stackplot subplots_adjust axhline axvline semilogx semilogy loglog polar streamplot hexbin pcolor tricontour errorbar clabel set_aspect violinplot set_axis_off spines text hatch plt axis plt.bar() plt.axis import figure pyplot highlight_text pypalettes plt.subplots() xlabel ylabel title legend colorbar savefig tight_layout grid set_xlim set_ylim plot scatter hist boxplot imshow cmap alpha bins tick_params annotate quiver contour barh stackplot subplots_adjust axhline axvline semilogx semilogy loglog polar streamplot hexbin pcolor tricontour errorbar clabel set_aspect violinplot set_axis_off spines text hatch plt axis plt.bar() plt.axis import figure pyplot highlight_text pypalettes plt.subplots() xlabel ylabel title legend colorbar savefig tight_layout grid set_xlim set_ylim plot scatter hist boxplot imshow cmap alpha bins tick_params annotate quiver contour barh stackplot subplots_adjust axhline axvline semilogx semilogy loglog polar streamplot hexbin pcolor tricontour errorbar clabel set_aspect violinplot set_axis_off spines text hatch plt axis plt.bar() plt.axis import figure pyplot highlight_text pypalettes plt.subplots() xlabel ylabel title legend colorbar savefig tight_layout grid set_xlim set_ylim plot scatter hist boxplot imshow cmap alpha bins tick_params annotate quiver contour barh stackplot subplots_adjust axhline axvline semilogx semilogy loglog polar streamplot hexbin pcolor tricontour errorbar clabel set_aspect violinplot set_axis_off spines text hatch plt axis plt.bar() plt.axis import figure pyplot highlight_text pypalettes plt.subplots() xlabel ylabel title legend colorbar savefig tight_layout grid set_xlim set_ylim plot scatter hist boxplot imshow cmap alpha bins tick_params annotate quiver contour barh stackplot subplots_adjust axhline axvline semilogx semilogy loglog polar streamplot hexbin pcolor tricontour errorbar clabel set_aspect violinplot set_axis_off spines text hatch plt axis plt.bar() plt.axis import figure pyplot highlight_text pypalettes plt.subplots() xlabel ylabel title legend colorbar savefig tight_layout grid set_xlim set_ylim plot scatter hist boxplot imshow cmap alpha bins tick_params annotate quiver contour barh stackplot subplots_adjust axhline axvline semilogx semilogy loglog polar streamplot hexbin pcolor tricontour errorbar clabel set_aspect violinplot set_axis_off spines text hatch plt axis plt.bar() plt.axis import figure pyplot highlight_text pypalettes plt.subplots() xlabel ylabel title legend colorbar savefig tight_layout grid set_xlim set_ylim plot scatter hist boxplot imshow cmap alpha bins tick_params annotate quiver contour barh stackplot subplots_adjust axhline axvline semilogx semilogy loglog polar streamplot hexbin pcolor tricontour errorbar clabel set_aspect violinplot set_axis_off spines text hatch plt axis plt.bar() plt.axis import figure pyplot highlight_text pypalettes plt.subplots() xlabel ylabel title legend colorbar savefig tight_layout grid set_xlim set_ylim plot scatter hist boxplot imshow cmap alpha bins tick_params annotate quiver contour barh stackplot subplots_adjust axhline axvline semilogx semilogy loglog polar streamplot hexbin pcolor tricontour errorbar clabel set_aspect violinplot set_axis_off spines text hatch plt axis plt.bar() plt.axis import figure pyplot highlight_text pypalettes plt.subplots() xlabel ylabel title legend colorbar savefig tight_layout grid set_xlim set_ylim plot scatter hist boxplot imshow cmap alpha bins tick_params annotate quiver contour barh stackplot subplots_adjust axhline axvline semilogx semilogy loglog polar streamplot hexbin pcolor tricontour errorbar clabel set_aspect violinplot set_axis_off spines text hatch plt axis plt.bar() plt.axis import figure pyplot highlight_text pypalettes plt.subplots() xlabel ylabel title legend colorbar savefig tight_layout grid set_xlim set_ylim plot scatter hist boxplot imshow cmap alpha bins tick_params annotate quiver contour barh stackplot subplots_adjust axhline axvline semilogx semilogy loglog polar streamplot hexbin pcolor tricontour errorbar clabel set_aspect violinplot set_axis_off spines text hatch plt axis plt.bar() plt.axis import figure pyplot highlight_text pypalettes plt.subplots() xlabel ylabel title legend colorbar savefig tight_layout grid set_xlim set_ylim plot scatter hist boxplot imshow cmap alpha bins tick_params annotate quiver contour barh stackplot subplots_adjust axhline axvline semilogx semilogy loglog polar streamplot hexbin pcolor tricontour errorbar clabel set_aspect violinplot set_axis_off spines text hatch plt axis plt.bar() plt.axis import figure pyplot highlight_text pypalettes plt.subplots() xlabel ylabel title legend colorbar savefig tight_layout grid set_xlim set_ylim plot scatter hist boxplot imshow cmap alpha bins tick_params annotate quiver contour barh stackplot subplots_adjust axhline axvline semilogx semilogy loglog polar streamplot hexbin pcolor tricontour errorbar clabel set_aspect violinplot set_axis_off spines text hatch plt axis plt.bar() plt.axis import figure pyplot highlight_text pypalettes plt.subplots() xlabel ylabel title legend colorbar savefig tight_layout grid set_xlim set_ylim plot scatter hist boxplot imshow cmap alpha bins tick_params annotate quiver contour barh stackplot subplots_adjust axhline axvline semilogx semilogy loglog polar streamplot hexbin pcolor tricontour errorbar clabel set_aspect violinplot set_axis_off spines text hatch plt axis plt.bar() plt.axis import figure pyplot highlight_text pypalettes plt.subplots() xlabel ylabel title legend colorbar savefig tight_layout grid set_xlim set_ylim plot scatter hist boxplot imshow cmap alpha bins tick_params annotate quiver contour barh stackplot subplots_adjust axhline axvline semilogx semilogy loglog polar streamplot hexbin pcolor tricontour errorbar clabel set_aspect violinplot set_axis_off spines text hatch plt axis plt.bar() plt.axis import figure pyplot highlight_text pypalettes plt.subplots() xlabel ylabel title legend colorbar savefig tight_layout grid set_xlim set_ylim plot scatter hist boxplot imshow cmap alpha bins tick_params annotate quiver contour barh stackplot subplots_adjust axhline axvline semilogx semilogy loglog polar streamplot hexbin pcolor tricontour errorbar clabel set_aspect violinplot set_axis_off spines text hatch plt axis plt.bar() plt.axis import figure pyplot highlight_text pypalettes plt.subplots() xlabel ylabel title legend colorbar savefig tight_layout grid set_xlim set_ylim plot scatter hist boxplot imshow cmap alpha bins tick_params annotate quiver contour barh stackplot subplots_adjust axhline axvline semilogx semilogy loglog polar streamplot hexbin pcolor tricontour errorbar clabel set_aspect violinplot set_axis_off spines text hatch plt axis plt.bar() plt.axis import figure pyplot highlight_text pypalettes plt.subplots() xlabel ylabel title legend colorbar savefig tight_layout grid set_xlim set_ylim plot scatter hist boxplot imshow cmap alpha bins tick_params annotate quiver contour barh stackplot subplots_adjust axhline axvline semilogx semilogy loglog polar streamplot hexbin pcolor tricontour errorbar clabel set_aspect violinplot set_axis_off spines text hatch plt axis plt.bar() plt.axis import figure pyplot highlight_text pypalettes plt.subplots() xlabel ylabel title legend colorbar savefig tight_layout grid set_xlim set_ylim plot scatter hist boxplot imshow cmap alpha bins tick_params annotate quiver contour barh stackplot subplots_adjust axhline axvline semilogx semilogy loglog polar streamplot hexbin pcolor tricontour errorbar clabel set_aspect violinplot set_axis_off spines text hatch plt axis plt.bar() plt.axis import figure pyplot highlight_text pypalettes plt.subplots() xlabel ylabel title legend colorbar savefig tight_layout grid set_xlim set_ylim plot scatter hist boxplot imshow cmap alpha bins tick_params annotate quiver contour barh stackplot subplots_adjust axhline axvline semilogx semilogy loglog polar streamplot hexbin pcolor tricontour errorbar clabel set_aspect violinplot set_axis_off spines text hatch plt axis plt.bar() plt.axis import figure pyplot highlight_text pypalettes plt.subplots() xlabel ylabel title legend colorbar savefig tight_layout grid set_xlim set_ylim plot scatter hist boxplot imshow cmap alpha bins tick_params annotate quiver contour barh stackplot subplots_adjust axhline axvline semilogx semilogy loglog polar streamplot hexbin pcolor tricontour errorbar clabel set_aspect violinplot set_axis_off spines text hatch plt axis plt.bar() plt.axis import figure pyplot highlight_text pypalettes plt.subplots() xlabel ylabel title legend colorbar savefig tight_layout grid set_xlim set_ylim plot scatter hist boxplot imshow cmap alpha bins tick_params annotate quiver contour barh stackplot subplots_adjust axhline axvline semilogx semilogy loglog polar streamplot hexbin pcolor tricontour errorbar clabel set_aspect violinplot set_axis_off spines text hatch plt axis plt.bar() plt.axis import figure pyplot highlight_text pypalettes plt.subplots() xlabel ylabel title legend colorbar savefig tight_layout grid set_xlim set_ylim plot scatter hist boxplot imshow cmap alpha bins tick_params annotate quiver contour barh stackplot subplots_adjust axhline axvline semilogx semilogy loglog polar streamplot hexbin pcolor tricontour errorbar clabel set_aspect violinplot set_axis_off spines text hatch plt axis plt.bar() plt.axis import figure pyplot highlight_text pypalettes plt.subplots() xlabel ylabel title legend colorbar savefig tight_layout grid set_xlim set_ylim plot scatter hist boxplot imshow cmap alpha bins tick_params annotate quiver contour barh stackplot subplots_adjust axhline axvline semilogx semilogy loglog polar streamplot hexbin pcolor tricontour errorbar clabel set_aspect violinplot set_axis_off spines text hatch plt axis plt.bar() plt.axis import figure pyplot highlight_text pypalettes plt.subplots() xlabel ylabel title legend colorbar savefig tight_layout grid set_xlim set_ylim plot scatter hist boxplot imshow cmap alpha bins tick_params annotate quiver contour barh stackplot subplots_adjust axhline axvline semilogx semilogy loglog polar streamplot hexbin pcolor tricontour errorbar clabel set_aspect violinplot set_axis_off spines text hatch plt axis plt.bar() plt.axis import figure pyplot highlight_text pypalettes plt.subplots() xlabel ylabel title legend colorbar savefig tight_layout grid set_xlim set_ylim plot scatter hist boxplot imshow cmap alpha bins tick_params annotate quiver contour barh stackplot subplots_adjust axhline axvline semilogx semilogy loglog polar streamplot hexbin pcolor tricontour errorbar clabel set_aspect violinplot set_axis_off spines text hatch plt axis plt.bar() plt.axis import figure pyplot highlight_text pypalettes plt.subplots() xlabel ylabel title legend colorbar savefig tight_layout grid set_xlim set_ylim plot scatter hist boxplot imshow cmap alpha bins tick_params annotate quiver contour barh stackplot subplots_adjust axhline axvline semilogx semilogy loglog polar streamplot hexbin pcolor tricontour errorbar clabel set_aspect violinplot set_axis_off spines text hatch plt axis plt.bar() plt.axis import figure pyplot highlight_text pypalettes plt.subplots() xlabel ylabel title legend colorbar savefig tight_layout grid set_xlim set_ylim plot scatter hist boxplot imshow cmap alpha bins tick_params annotate quiver contour barh stackplot subplots_adjust axhline axvline semilogx semilogy loglog polar streamplot hexbin pcolor tricontour errorbar clabel set_aspect violinplot set_axis_off spines text hatch plt axis plt.bar() plt.axis import figure pyplot highlight_text pypalettes plt.subplots() xlabel ylabel title legend colorbar savefig tight_layout grid set_xlim set_ylim plot scatter hist boxplot imshow cmap alpha bins tick_params annotate quiver contour barh stackplot subplots_adjust axhline axvline semilogx semilogy loglog polar streamplot hexbin pcolor tricontour errorbar clabel set_aspect violinplot set_axis_off spines text hatch plt axis plt.bar() plt.axis import figure pyplot highlight_text pypalettes plt.subplots() xlabel ylabel title legend colorbar savefig tight_layout grid set_xlim set_ylim plot scatter hist boxplot imshow cmap alpha bins tick_params annotate quiver contour barh stackplot subplots_adjust axhline axvline semilogx semilogy loglog polar streamplot hexbin pcolor tricontour errorbar clabel set_aspect violinplot set_axis_off spines text hatch plt axis plt.bar() plt.axis import figure pyplot highlight_text pypalettes plt.subplots() xlabel ylabel title legend colorbar savefig tight_layout grid set_xlim set_ylim plot scatter hist boxplot imshow cmap alpha bins tick_params annotate quiver contour barh stackplot subplots_adjust axhline axvline semilogx semilogy loglog polar streamplot hexbin pcolor tricontour errorbar clabel set_aspect violinplot set_axis_off spines text hatch plt axis plt.bar() plt.axis import figure pyplot highlight_text pypalettes plt.subplots() xlabel ylabel title legend colorbar savefig tight_layout grid set_xlim set_ylim plot scatter hist boxplot imshow cmap alpha bins tick_params annotate quiver contour barh stackplot subplots_adjust axhline axvline semilogx semilogy loglog polar streamplot hexbin pcolor tricontour errorbar clabel set_aspect violinplot set_axis_off spines text hatch plt axis plt.bar() plt.axis import figure pyplot highlight_text pypalettes plt.subplots() xlabel ylabel title legend colorbar savefig tight_layout grid set_xlim set_ylim plot scatter hist boxplot imshow cmap alpha bins tick_params annotate quiver contour barh stackplot subplots_adjust axhline axvline semilogx semilogy loglog polar streamplot hexbin pcolor tricontour errorbar clabel set_aspect violinplot set_axis_off spines text hatch plt axis plt.bar() plt.axis import figure pyplot highlight_text pypalettes plt.subplots() xlabel ylabel title legend colorbar savefig tight_layout grid set_xlim set_ylim plot scatter hist boxplot imshow cmap alpha bins tick_params annotate quiver contour barh stackplot subplots_adjust axhline axvline semilogx semilogy loglog polar streamplot hexbin pcolor tricontour errorbar clabel set_aspect violinplot set_axis_off spines text hatch plt axis plt.bar() plt.axis import figure pyplot highlight_text pypalettes plt.subplots() xlabel ylabel title legend colorbar savefig tight_layout grid set_xlim set_ylim plot scatter hist boxplot imshow cmap alpha bins tick_params annotate quiver contour barh stackplot subplots_adjust axhline axvline semilogx semilogy loglog polar streamplot hexbin pcolor tricontour errorbar clabel set_aspect violinplot set_axis_off spines text hatch plt axis plt.bar() plt.axis import figure pyplot highlight_text pypalettes plt.subplots() xlabel ylabel title legend colorbar savefig tight_layout grid set_xlim set_ylim plot scatter hist boxplot imshow cmap alpha bins tick_params annotate quiver contour barh stackplot subplots_adjust axhline axvline semilogx semilogy loglog polar streamplot hexbin pcolor tricontour errorbar clabel set_aspect violinplot set_axis_off spines text hatch plt axis plt.bar() plt.axis import figure pyplot highlight_text pypalettes plt.subplots() xlabel ylabel title legend colorbar savefig tight_layout grid set_xlim set_ylim plot scatter hist boxplot imshow cmap alpha bins tick_params annotate quiver contour barh stackplot subplots_adjust axhline axvline semilogx semilogy loglog polar streamplot hexbin pcolor tricontour errorbar clabel set_aspect violinplot set_axis_off spines text hatch plt axis plt.bar() plt.axis import figure pyplot highlight_text pypalettes plt.subplots() xlabel ylabel title legend colorbar savefig tight_layout grid set_xlim set_ylim plot scatter hist boxplot imshow cmap alpha bins tick_params annotate quiver contour barh stackplot subplots_adjust axhline axvline semilogx semilogy loglog polar streamplot hexbin pcolor tricontour errorbar clabel set_aspect violinplot set_axis_off spines text hatch plt axis plt.bar() plt.axis import figure pyplot highlight_text pypalettes plt.subplots() xlabel ylabel title legend colorbar savefig tight_layout grid set_xlim set_ylim plot scatter hist boxplot imshow cmap alpha bins tick_params annotate quiver contour barh stackplot subplots_adjust axhline axvline semilogx semilogy loglog polar streamplot hexbin pcolor tricontour errorbar clabel set_aspect violinplot set_axis_off spines text hatch plt axis plt.bar() plt.axis import figure pyplot highlight_text pypalettes plt.subplots() xlabel ylabel title legend colorbar savefig tight_layout grid set_xlim set_ylim plot scatter hist boxplot imshow cmap alpha bins tick_params annotate quiver contour barh stackplot subplots_adjust axhline axvline semilogx semilogy loglog polar streamplot hexbin pcolor tricontour errorbar clabel set_aspect violinplot set_axis_off spines text hatch plt axis plt.bar() plt.axis import figure pyplot highlight_text pypalettes plt.subplots() xlabel ylabel title legend colorbar savefig tight_layout grid set_xlim set_ylim plot scatter hist boxplot imshow cmap alpha bins tick_params annotate quiver contour barh stackplot subplots_adjust axhline axvline semilogx semilogy loglog polar streamplot hexbin pcolor tricontour errorbar clabel set_aspect violinplot set_axis_off spines text hatch plt axis plt.bar() plt.axis import figure pyplot highlight_text pypalettes plt.subplots() xlabel ylabel title legend colorbar savefig tight_layout grid set_xlim set_ylim plot scatter hist boxplot imshow cmap alpha bins tick_params annotate quiver contour barh stackplot subplots_adjust axhline axvline semilogx semilogy loglog polar streamplot hexbin pcolor tricontour errorbar clabel set_aspect violinplot set_axis_off spines text hatch plt axis plt.bar() plt.axis import figure pyplot highlight_text pypalettes plt.subplots() xlabel ylabel title legend colorbar savefig tight_layout grid set_xlim set_ylim plot scatter hist boxplot imshow cmap alpha bins tick_params annotate quiver contour barh stackplot subplots_adjust axhline axvline semilogx semilogy loglog polar streamplot hexbin pcolor tricontour errorbar clabel set_aspect violinplot set_axis_off spines text hatch plt axis plt.bar() plt.axis import figure pyplot highlight_text pypalettes plt.subplots() xlabel ylabel title legend colorbar savefig tight_layout grid set_xlim set_ylim plot scatter hist boxplot imshow cmap alpha bins tick_params annotate quiver contour barh stackplot subplots_adjust axhline axvline semilogx semilogy loglog polar streamplot hexbin pcolor tricontour errorbar clabel set_aspect violinplot set_axis_off spines text hatch plt axis plt.bar() plt.axis import figure pyplot highlight_text pypalettes plt.subplots() xlabel ylabel title legend colorbar savefig tight_layout grid set_xlim set_ylim plot scatter hist boxplot imshow cmap alpha bins tick_params annotate quiver contour barh stackplot subplots_adjust axhline axvline semilogx semilogy loglog polar streamplot hexbin pcolor tricontour errorbar clabel set_aspect violinplot set_axis_off spines text hatch plt axis plt.bar() plt.axis import figure pyplot highlight_text pypalettes plt.subplots() xlabel ylabel title legend colorbar savefig tight_layout grid set_xlim set_ylim plot scatter hist boxplot imshow cmap alpha bins tick_params annotate quiver contour barh stackplot subplots_adjust axhline axvline semilogx semilogy loglog polar streamplot hexbin pcolor tricontour errorbar clabel set_aspect violinplot set_axis_off spines text hatch plt axis plt.bar() plt.axis import figure pyplot highlight_text pypalettes plt.subplots() xlabel ylabel title legend colorbar savefig tight_layout grid set_xlim set_ylim plot scatter hist boxplot imshow cmap alpha bins tick_params annotate quiver contour barh stackplot subplots_adjust axhline axvline semilogx semilogy loglog polar streamplot hexbin pcolor tricontour errorbar clabel set_aspect violinplot set_axis_off spines text hatch plt axis plt.bar() plt.axis import figure pyplot highlight_text pypalettes plt.subplots() xlabel ylabel title legend colorbar savefig tight_layout grid set_xlim set_ylim plot scatter hist boxplot imshow cmap alpha bins tick_params annotate quiver contour barh stackplot subplots_adjust axhline axvline semilogx semilogy loglog polar streamplot hexbin pcolor tricontour errorbar clabel set_aspect violinplot set_axis_off spines text hatch plt axis plt.bar() plt.axis import figure pyplot highlight_text pypalettes plt.subplots() xlabel ylabel title legend colorbar savefig tight_layout grid set_xlim set_ylim plot scatter hist boxplot imshow cmap alpha bins tick_params annotate quiver contour barh stackplot subplots_adjust axhline axvline semilogx semilogy loglog polar streamplot hexbin pcolor tricontour errorbar clabel set_aspect violinplot set_axis_off spines text hatch plt axis plt.bar() plt.axis import figure pyplot highlight_text pypalettes plt.subplots() xlabel ylabel title legend colorbar savefig tight_layout grid set_xlim set_ylim plot scatter hist boxplot imshow cmap alpha bins tick_params annotate quiver contour barh stackplot subplots_adjust axhline axvline semilogx semilogy loglog polar streamplot hexbin pcolor tricontour errorbar clabel set_aspect violinplot set_axis_off spines text hatch plt axis plt.bar() plt.axis import figure pyplot highlight_text pypalettes plt.subplots() xlabel ylabel title legend colorbar savefig tight_layout grid set_xlim set_ylim plot scatter hist boxplot imshow cmap alpha bins tick_params annotate quiver contour barh stackplot subplots_adjust axhline axvline semilogx semilogy loglog polar streamplot hexbin pcolor tricontour errorbar clabel set_aspect violinplot set_axis_off spines text hatch plt axis plt.bar() plt.axis import figure pyplot highlight_text pypalettes plt.subplots() xlabel ylabel title legend colorbar savefig tight_layout grid set_xlim set_ylim plot scatter hist boxplot imshow cmap alpha bins tick_params annotate quiver contour barh stackplot subplots_adjust axhline axvline semilogx semilogy loglog polar streamplot hexbin pcolor tricontour errorbar clabel set_aspect violinplot set_axis_off spines text hatch plt axis plt.bar() plt.axis import figure pyplot highlight_text pypalettes plt.subplots() xlabel ylabel title legend colorbar savefig tight_layout grid set_xlim set_ylim plot scatter hist boxplot imshow cmap alpha bins tick_params annotate quiver contour barh stackplot subplots_adjust axhline axvline semilogx semilogy loglog polar streamplot hexbin pcolor tricontour errorbar clabel set_aspect violinplot set_axis_off spines text hatch plt axis plt.bar() plt.axis import figure pyplot highlight_text pypalettes plt.subplots() xlabel ylabel title legend colorbar savefig tight_layout grid set_xlim set_ylim plot scatter hist boxplot imshow cmap alpha bins tick_params annotate quiver contour barh stackplot subplots_adjust axhline axvline semilogx semilogy loglog polar streamplot hexbin pcolor tricontour errorbar clabel set_aspect violinplot set_axis_off spines text hatch plt axis plt.bar() plt.axis import figure pyplot highlight_text pypalettes plt.subplots() xlabel ylabel title legend colorbar savefig tight_layout grid set_xlim set_ylim plot scatter hist boxplot imshow cmap alpha bins tick_params annotate quiver contour barh stackplot subplots_adjust axhline axvline semilogx semilogy loglog polar streamplot hexbin pcolor tricontour errorbar clabel set_aspect violinplot set_axis_off spines text hatch plt axis plt.bar() plt.axis import figure pyplot highlight_text pypalettes plt.subplots() xlabel ylabel title legend colorbar savefig tight_layout grid set_xlim set_ylim plot scatter hist boxplot imshow cmap alpha bins tick_params annotate quiver contour barh stackplot subplots_adjust axhline axvline semilogx semilogy loglog polar streamplot hexbin pcolor tricontour errorbar clabel set_aspect violinplot set_axis_off spines text hatch plt axis plt.bar() plt.axis import figure pyplot highlight_text pypalettes plt.subplots() xlabel ylabel title legend colorbar savefig tight_layout grid set_xlim set_ylim plot scatter hist boxplot imshow cmap alpha bins tick_params annotate quiver contour barh stackplot subplots_adjust axhline axvline semilogx semilogy loglog polar streamplot hexbin pcolor tricontour errorbar clabel set_aspect violinplot set_axis_off spines text hatch plt axis plt.bar() plt.axis import figure pyplot highlight_text pypalettes plt.subplots() xlabel ylabel title legend colorbar savefig tight_layout grid set_xlim set_ylim plot scatter hist boxplot imshow cmap alpha bins tick_params annotate quiver contour barh stackplot subplots_adjust axhline axvline semilogx semilogy loglog polar streamplot hexbin pcolor tricontour errorbar clabel set_aspect violinplot set_axis_off spines text hatch plt axis plt.bar() plt.axis import figure pyplot highlight_text pypalettes plt.subplots() xlabel ylabel title legend colorbar savefig tight_layout grid set_xlim set_ylim plot scatter hist boxplot imshow cmap alpha bins tick_params annotate quiver contour barh stackplot subplots_adjust axhline axvline semilogx semilogy loglog polar streamplot hexbin pcolor tricontour errorbar clabel set_aspect violinplot set_axis_off spines text hatch plt axis plt.bar() plt.axis import figure pyplot highlight_text pypalettes plt.subplots() xlabel ylabel title legend colorbar savefig tight_layout grid set_xlim set_ylim plot scatter hist boxplot imshow cmap alpha bins tick_params annotate quiver contour barh stackplot subplots_adjust axhline axvline semilogx semilogy loglog polar streamplot hexbin pcolor tricontour errorbar clabel set_aspect violinplot set_axis_off spines text hatch plt axis plt.bar() plt.axis import figure pyplot highlight_text pypalettes plt.subplots() xlabel ylabel title legend colorbar savefig tight_layout grid set_xlim set_ylim plot scatter hist boxplot imshow cmap alpha bins tick_params annotate quiver contour barh stackplot subplots_adjust axhline axvline semilogx semilogy loglog polar streamplot hexbin pcolor tricontour errorbar clabel set_aspect violinplot set_axis_off spines text hatch plt axis plt.bar() plt.axis import figure pyplot highlight_text pypalettes plt.subplots() xlabel ylabel title legend colorbar savefig tight_layout grid set_xlim set_ylim plot scatter hist boxplot imshow cmap alpha bins tick_params annotate quiver contour barh stackplot subplots_adjust axhline axvline semilogx semilogy loglog polar streamplot hexbin pcolor tricontour errorbar clabel set_aspect violinplot set_axis_off spines text hatch plt axis plt.bar() plt.axis import figure pyplot highlight_text pypalettes plt.subplots() xlabel ylabel title legend colorbar savefig tight_layout grid set_xlim set_ylim plot scatter hist boxplot imshow cmap alpha bins tick_params annotate quiver contour barh stackplot subplots_adjust axhline axvline semilogx semilogy loglog polar streamplot hexbin pcolor tricontour errorbar clabel set_aspect violinplot set_axis_off spines text hatch plt axis plt.bar() plt.axis import figure pyplot highlight_text pypalettes plt.subplots() xlabel ylabel title legend colorbar savefig tight_layout grid set_xlim set_ylim plot scatter hist boxplot imshow cmap alpha bins tick_params annotate quiver contour barh stackplot subplots_adjust axhline axvline semilogx semilogy loglog polar streamplot hexbin pcolor tricontour errorbar clabel set_aspect violinplot set_axis_off spines text hatch plt axis plt.bar() plt.axis import figure pyplot highlight_text pypalettes plt.subplots() xlabel ylabel title legend colorbar savefig tight_layout grid set_xlim set_ylim plot scatter hist boxplot imshow cmap alpha bins tick_params annotate quiver contour barh stackplot subplots_adjust axhline axvline semilogx semilogy loglog polar streamplot hexbin pcolor tricontour errorbar clabel set_aspect violinplot set_axis_off spines text hatch plt axis plt.bar() plt.axis import figure pyplot highlight_text pypalettes plt.subplots() xlabel ylabel title legend colorbar savefig tight_layout grid set_xlim set_ylim plot scatter hist boxplot imshow cmap alpha bins tick_params annotate quiver contour barh stackplot subplots_adjust axhline axvline semilogx semilogy loglog polar streamplot hexbin pcolor tricontour errorbar clabel set_aspect violinplot set_axis_off spines text hatch plt axis plt.bar() plt.axis import figure pyplot highlight_text pypalettes plt.subplots() xlabel ylabel title legend colorbar savefig tight_layout grid set_xlim set_ylim plot scatter hist boxplot imshow cmap alpha bins tick_params annotate quiver contour barh stackplot subplots_adjust axhline axvline semilogx semilogy loglog polar streamplot hexbin pcolor tricontour errorbar clabel set_aspect violinplot set_axis_off spines text hatch plt axis plt.bar() plt.axis import figure pyplot highlight_text pypalettes plt.subplots() xlabel ylabel title legend colorbar savefig tight_layout grid set_xlim set_ylim plot scatter hist boxplot imshow cmap alpha bins tick_params annotate quiver contour barh stackplot subplots_adjust axhline axvline semilogx semilogy loglog polar streamplot hexbin pcolor tricontour errorbar clabel set_aspect violinplot set_axis_off spines text hatch plt axis plt.bar() plt.axis import figure pyplot highlight_text pypalettes plt.subplots() xlabel ylabel title legend colorbar savefig tight_layout grid set_xlim set_ylim plot scatter hist boxplot imshow cmap alpha bins tick_params annotate quiver contour barh stackplot subplots_adjust axhline axvline semilogx semilogy loglog polar streamplot hexbin pcolor tricontour errorbar clabel set_aspect violinplot set_axis_off spines text hatch plt axis plt.bar() plt.axis import figure pyplot highlight_text pypalettes plt.subplots() xlabel ylabel title legend colorbar savefig tight_layout grid set_xlim set_ylim plot scatter hist boxplot imshow cmap alpha bins tick_params annotate quiver contour barh stackplot subplots_adjust axhline axvline semilogx semilogy loglog polar streamplot hexbin pcolor tricontour errorbar clabel set_aspect violinplot set_axis_off spines text hatch plt axis plt.bar() plt.axis import figure pyplot highlight_text pypalettes plt.subplots() xlabel ylabel title legend colorbar savefig tight_layout grid set_xlim set_ylim plot scatter hist boxplot imshow cmap alpha bins tick_params annotate quiver contour barh stackplot subplots_adjust axhline axvline semilogx semilogy loglog polar streamplot hexbin pcolor tricontour errorbar clabel set_aspect violinplot set_axis_off spines text hatch plt axis plt.bar() plt.axis import figure pyplot highlight_text pypalettes plt.subplots() xlabel ylabel title legend colorbar savefig tight_layout grid set_xlim set_ylim plot scatter hist boxplot imshow cmap alpha bins tick_params annotate quiver contour barh stackplot subplots_adjust axhline axvline semilogx semilogy loglog polar streamplot hexbin pcolor tricontour errorbar clabel set_aspect violinplot set_axis_off spines text hatch plt axis plt.bar() plt.axis import figure pyplot highlight_text pypalettes plt.subplots() xlabel ylabel title legend colorbar savefig tight_layout grid set_xlim set_ylim plot scatter hist boxplot imshow cmap alpha bins tick_params annotate quiver contour barh stackplot subplots_adjust axhline axvline semilogx semilogy loglog polar streamplot hexbin pcolor tricontour errorbar clabel set_aspect violinplot set_axis_off spines text hatch plt axis plt.bar() plt.axis import figure pyplot highlight_text pypalettes plt.subplots() xlabel ylabel title legend colorbar savefig tight_layout grid set_xlim set_ylim plot scatter hist boxplot imshow cmap alpha bins tick_params annotate quiver contour barh stackplot subplots_adjust axhline axvline semilogx semilogy loglog polar streamplot hexbin pcolor tricontour errorbar clabel set_aspect violinplot set_axis_off spines text hatch plt axis plt.bar() plt.axis import figure pyplot highlight_text pypalettes plt.subplots() xlabel ylabel title legend colorbar savefig tight_layout grid set_xlim set_ylim plot scatter hist boxplot imshow cmap alpha bins tick_params annotate quiver contour barh stackplot subplots_adjust axhline axvline semilogx semilogy loglog polar streamplot hexbin pcolor tricontour errorbar clabel set_aspect violinplot set_axis_off spines text hatch plt axis plt.bar() plt.axis import figure pyplot highlight_text pypalettes plt.subplots() xlabel ylabel title legend colorbar savefig tight_layout grid set_xlim set_ylim plot scatter hist boxplot imshow cmap alpha bins tick_params annotate quiver contour barh stackplot subplots_adjust axhline axvline semilogx semilogy loglog polar streamplot hexbin pcolor tricontour errorbar clabel set_aspect violinplot set_axis_off spines text hatch plt axis plt.bar() plt.axis import figure pyplot highlight_text pypalettes plt.subplots() xlabel ylabel title legend colorbar savefig tight_layout grid set_xlim set_ylim plot scatter hist boxplot imshow cmap alpha bins tick_params annotate quiver contour barh stackplot subplots_adjust axhline axvline semilogx semilogy loglog polar streamplot hexbin pcolor tricontour errorbar clabel set_aspect violinplot set_axis_off spines text hatch plt axis plt.bar() plt.axis import figure pyplot highlight_text pypalettes plt.subplots() xlabel ylabel title legend colorbar savefig tight_layout grid set_xlim set_ylim plot scatter hist boxplot imshow cmap alpha bins tick_params annotate quiver contour barh stackplot subplots_adjust axhline axvline semilogx semilogy loglog polar streamplot hexbin pcolor tricontour errorbar clabel set_aspect violinplot set_axis_off spines text hatch plt axis plt.bar() plt.axis import figure pyplot highlight_text pypalettes plt.subplots() xlabel ylabel title legend colorbar savefig tight_layout grid set_xlim set_ylim plot scatter hist boxplot imshow cmap alpha bins tick_params annotate quiver contour barh stackplot subplots_adjust axhline axvline semilogx semilogy loglog polar streamplot hexbin pcolor tricontour errorbar clabel set_aspect violinplot set_axis_off spines text hatch plt axis plt.bar() plt.axis import figure pyplot highlight_text pypalettes plt.subplots() xlabel ylabel title legend colorbar savefig tight_layout grid set_xlim set_ylim plot scatter hist boxplot imshow cmap alpha bins tick_params annotate quiver contour barh stackplot subplots_adjust axhline axvline semilogx semilogy loglog polar streamplot hexbin pcolor tricontour errorbar clabel set_aspect violinplot set_axis_off spines text hatch plt axis plt.bar() plt.axis import figure pyplot highlight_text pypalettes plt.subplots() xlabel ylabel title legend colorbar savefig tight_layout grid set_xlim set_ylim plot scatter hist boxplot imshow cmap alpha bins tick_params annotate quiver contour barh stackplot subplots_adjust axhline axvline semilogx semilogy loglog polar streamplot hexbin pcolor tricontour errorbar clabel set_aspect violinplot set_axis_off spines text hatch plt axis plt.bar() plt.axis import figure pyplot highlight_text pypalettes plt.subplots() xlabel ylabel title legend colorbar savefig tight_layout grid set_xlim set_ylim plot scatter hist boxplot imshow cmap alpha bins tick_params annotate quiver contour barh stackplot subplots_adjust axhline axvline semilogx semilogy loglog polar streamplot hexbin pcolor tricontour errorbar clabel set_aspect violinplot set_axis_off spines text hatch plt axis plt.bar() plt.axis import figure pyplot highlight_text pypalettes plt.subplots() xlabel ylabel title legend colorbar savefig tight_layout grid set_xlim set_ylim plot scatter hist boxplot imshow cmap alpha bins tick_params annotate quiver contour barh stackplot subplots_adjust axhline axvline semilogx semilogy loglog polar streamplot hexbin pcolor tricontour errorbar clabel set_aspect violinplot set_axis_off spines text hatch plt axis plt.bar() plt.axis import figure pyplot highlight_text pypalettes plt.subplots() xlabel ylabel title legend colorbar savefig tight_layout grid set_xlim set_ylim plot scatter hist boxplot imshow cmap alpha bins tick_params annotate quiver contour barh stackplot subplots_adjust axhline axvline semilogx semilogy loglog polar streamplot hexbin pcolor tricontour errorbar clabel set_aspect violinplot set_axis_off spines text hatch plt axis plt.bar() plt.axis import figure pyplot highlight_text pypalettes plt.subplots() xlabel ylabel title legend colorbar savefig tight_layout grid set_xlim set_ylim plot scatter hist boxplot imshow cmap alpha bins tick_params annotate quiver contour barh stackplot subplots_adjust axhline axvline semilogx semilogy loglog polar streamplot hexbin pcolor tricontour errorbar clabel set_aspect violinplot set_axis_off spines text hatch plt axis plt.bar() plt.axis import figure pyplot highlight_text pypalettes plt.subplots() xlabel ylabel title legend colorbar savefig tight_layout grid set_xlim set_ylim plot scatter hist boxplot imshow cmap alpha bins tick_params annotate quiver contour barh stackplot subplots_adjust axhline axvline semilogx semilogy loglog polar streamplot hexbin pcolor tricontour errorbar clabel set_aspect violinplot set_axis_off spines text hatch plt axis plt.bar() plt.axis import figure pyplot highlight_text pypalettes plt.subplots() xlabel ylabel title legend colorbar savefig tight_layout grid set_xlim set_ylim plot scatter hist boxplot imshow cmap alpha bins tick_params annotate quiver contour barh stackplot subplots_adjust axhline axvline semilogx semilogy loglog polar streamplot hexbin pcolor tricontour errorbar clabel set_aspect violinplot set_axis_off spines text hatch plt axis plt.bar() plt.axis import figure pyplot highlight_text pypalettes plt.subplots() xlabel ylabel title legend colorbar savefig tight_layout grid set_xlim set_ylim plot scatter hist boxplot imshow cmap alpha bins tick_params annotate quiver contour barh stackplot subplots_adjust axhline axvline semilogx semilogy loglog polar streamplot hexbin pcolor tricontour errorbar clabel set_aspect violinplot set_axis_off spines text hatch plt axis plt.bar() plt.axis import figure pyplot highlight_text pypalettes plt.subplots() xlabel ylabel title legend colorbar savefig tight_layout grid set_xlim set_ylim plot scatter hist boxplot imshow cmap alpha bins tick_params annotate quiver contour barh stackplot subplots_adjust axhline axvline semilogx semilogy loglog polar streamplot hexbin pcolor tricontour errorbar clabel set_aspect violinplot set_axis_off spines text hatch plt axis plt.bar() plt.axis import figure pyplot highlight_text pypalettes plt.subplots() xlabel ylabel title legend colorbar savefig tight_layout grid set_xlim set_ylim plot scatter hist boxplot imshow cmap alpha bins tick_params annotate quiver contour barh stackplot subplots_adjust axhline axvline semilogx semilogy loglog polar streamplot hexbin pcolor tricontour errorbar clabel set_aspect violinplot set_axis_off spines text hatch plt axis plt.bar() plt.axis import figure pyplot highlight_text pypalettes plt.subplots() xlabel ylabel title legend colorbar savefig tight_layout grid set_xlim set_ylim plot scatter hist boxplot imshow cmap alpha bins tick_params annotate quiver contour barh stackplot subplots_adjust axhline axvline semilogx semilogy loglog polar streamplot hexbin pcolor tricontour errorbar clabel set_aspect violinplot set_axis_off spines text hatch plt axis plt.bar() plt.axis import figure pyplot highlight_text pypalettes plt.subplots() xlabel ylabel title legend colorbar savefig tight_layout grid set_xlim set_ylim plot scatter hist boxplot imshow cmap alpha bins tick_params annotate quiver contour barh stackplot subplots_adjust axhline axvline semilogx semilogy loglog polar streamplot hexbin pcolor tricontour errorbar clabel set_aspect violinplot set_axis_off spines text hatch plt axis plt.bar() plt.axis import figure pyplot highlight_text pypalettes plt.subplots() xlabel ylabel title legend colorbar savefig tight_layout grid set_xlim set_ylim plot scatter hist boxplot imshow cmap alpha bins tick_params annotate quiver contour barh stackplot subplots_adjust axhline axvline semilogx semilogy loglog polar streamplot hexbin pcolor tricontour errorbar clabel set_aspect violinplot set_axis_off spines text hatch plt axis plt.bar() plt.axis import figure pyplot highlight_text pypalettes plt.subplots() xlabel ylabel title legend colorbar savefig tight_layout grid set_xlim set_ylim plot scatter hist boxplot imshow cmap alpha bins tick_params annotate quiver contour barh stackplot subplots_adjust axhline axvline semilogx semilogy loglog polar streamplot hexbin pcolor tricontour errorbar clabel set_aspect violinplot set_axis_off spines text hatch plt axis plt.bar() plt.axis import figure pyplot highlight_text pypalettes plt.subplots() xlabel ylabel title legend colorbar savefig tight_layout grid set_xlim set_ylim plot scatter hist boxplot imshow cmap alpha bins tick_params annotate quiver contour barh stackplot subplots_adjust axhline axvline semilogx semilogy loglog polar streamplot hexbin pcolor tricontour errorbar clabel set_aspect violinplot set_axis_off spines text hatch plt axis plt.bar() plt.axis import figure pyplot highlight_text pypalettes plt.subplots() xlabel ylabel title legend colorbar savefig tight_layout grid set_xlim set_ylim plot scatter hist boxplot imshow cmap alpha bins tick_params annotate quiver contour barh stackplot subplots_adjust axhline axvline semilogx semilogy loglog polar streamplot hexbin pcolor tricontour errorbar clabel set_aspect violinplot set_axis_off spines text hatch plt axis plt.bar() plt.axis import figure pyplot highlight_text pypalettes plt.subplots() xlabel ylabel title legend colorbar savefig tight_layout grid set_xlim set_ylim plot scatter hist boxplot imshow cmap alpha bins tick_params annotate quiver contour barh stackplot subplots_adjust axhline axvline semilogx semilogy loglog polar streamplot hexbin pcolor tricontour errorbar clabel set_aspect violinplot set_axis_off spines text hatch plt axis plt.bar() plt.axis import figure pyplot highlight_text pypalettes plt.subplots() xlabel ylabel title legend colorbar savefig tight_layout grid set_xlim set_ylim plot scatter hist boxplot imshow cmap alpha bins tick_params annotate quiver contour barh stackplot subplots_adjust axhline axvline semilogx semilogy loglog polar streamplot hexbin pcolor tricontour errorbar clabel set_aspect violinplot set_axis_off spines text hatch plt axis plt.bar() plt.axis import figure pyplot highlight_text pypalettes plt.subplots() xlabel ylabel title legend colorbar savefig tight_layout grid set_xlim set_ylim plot scatter hist boxplot imshow cmap alpha bins tick_params annotate quiver contour barh stackplot subplots_adjust axhline axvline semilogx semilogy loglog polar streamplot hexbin pcolor tricontour errorbar clabel set_aspect violinplot set_axis_off spines text hatch plt axis plt.bar() plt.axis import figure pyplot highlight_text pypalettes plt.subplots() xlabel ylabel title legend colorbar savefig tight_layout grid set_xlim set_ylim plot scatter hist boxplot imshow cmap alpha bins tick_params annotate quiver contour barh stackplot subplots_adjust axhline axvline semilogx semilogy loglog polar streamplot hexbin pcolor tricontour errorbar clabel set_aspect violinplot set_axis_off spines text hatch plt axis plt.bar() plt.axis import figure pyplot highlight_text pypalettes plt.subplots() xlabel ylabel title legend colorbar savefig tight_layout grid set_xlim set_ylim plot scatter hist boxplot imshow cmap alpha bins tick_params annotate quiver contour barh stackplot subplots_adjust axhline axvline semilogx semilogy loglog polar streamplot hexbin pcolor tricontour errorbar clabel set_aspect violinplot set_axis_off spines text hatch plt axis plt.bar() plt.axis import figure pyplot highlight_text pypalettes plt.subplots() xlabel ylabel title legend colorbar savefig tight_layout grid set_xlim set_ylim plot scatter hist boxplot imshow cmap alpha bins tick_params annotate quiver contour barh stackplot subplots_adjust axhline axvline semilogx semilogy loglog polar streamplot hexbin pcolor tricontour errorbar clabel set_aspect violinplot set_axis_off spines text hatch plt axis plt.bar() plt.axis import figure pyplot highlight_text pypalettes plt.subplots() xlabel ylabel title legend colorbar savefig tight_layout grid set_xlim set_ylim plot scatter hist boxplot imshow cmap alpha bins tick_params annotate quiver contour barh stackplot subplots_adjust axhline axvline semilogx semilogy loglog polar streamplot hexbin pcolor tricontour errorbar clabel set_aspect violinplot set_axis_off spines text hatch plt axis plt.bar() plt.axis import figure pyplot highlight_text pypalettes plt.subplots() xlabel ylabel title legend colorbar savefig tight_layout grid set_xlim set_ylim plot scatter hist boxplot imshow cmap alpha bins tick_params annotate quiver contour barh stackplot subplots_adjust axhline axvline semilogx semilogy loglog polar streamplot hexbin pcolor tricontour errorbar clabel set_aspect violinplot set_axis_off spines text hatch plt axis plt.bar() plt.axis import figure pyplot highlight_text pypalettes plt.subplots() xlabel ylabel title legend colorbar savefig tight_layout grid set_xlim set_ylim plot scatter hist boxplot imshow cmap alpha bins tick_params annotate quiver contour barh stackplot subplots_adjust axhline axvline semilogx semilogy loglog polar streamplot hexbin pcolor tricontour errorbar clabel set_aspect violinplot set_axis_off spines text hatch plt axis plt.bar() plt.axis import figure pyplot highlight_text pypalettes plt.subplots() xlabel ylabel title legend colorbar savefig tight_layout grid set_xlim set_ylim plot scatter hist boxplot imshow cmap alpha bins tick_params annotate quiver contour barh stackplot subplots_adjust axhline axvline semilogx semilogy loglog polar streamplot hexbin pcolor tricontour errorbar clabel set_aspect violinplot set_axis_off spines text hatch plt axis plt.bar() plt.axis import figure pyplot highlight_text pypalettes plt.subplots() xlabel ylabel title legend colorbar savefig tight_layout grid set_xlim set_ylim plot scatter hist boxplot imshow cmap alpha bins tick_params annotate quiver contour barh stackplot subplots_adjust axhline axvline semilogx semilogy loglog polar streamplot hexbin pcolor tricontour errorbar clabel set_aspect violinplot set_axis_off spines text hatch plt axis plt.bar() plt.axis import figure pyplot highlight_text pypalettes plt.subplots() xlabel ylabel title legend colorbar savefig tight_layout grid set_xlim set_ylim plot scatter hist boxplot imshow cmap alpha bins tick_params annotate quiver contour barh stackplot subplots_adjust axhline axvline semilogx semilogy loglog polar streamplot hexbin pcolor tricontour errorbar clabel set_aspect violinplot set_axis_off spines text hatch plt axis plt.bar() plt.axis import figure pyplot highlight_text pypalettes plt.subplots() xlabel ylabel title legend colorbar savefig tight_layout grid set_xlim set_ylim plot scatter hist boxplot imshow cmap alpha bins tick_params annotate quiver contour barh stackplot subplots_adjust axhline axvline semilogx semilogy loglog polar streamplot hexbin pcolor tricontour errorbar clabel set_aspect violinplot set_axis_off spines text hatch plt axis plt.bar() plt.axis import figure pyplot highlight_text pypalettes plt.subplots() xlabel ylabel title legend colorbar savefig tight_layout grid set_xlim set_ylim plot scatter hist boxplot imshow cmap alpha bins tick_params annotate quiver contour barh stackplot subplots_adjust axhline axvline semilogx semilogy loglog polar streamplot hexbin pcolor tricontour errorbar clabel set_aspect violinplot set_axis_off spines text hatch plt axis plt.bar() plt.axis import figure pyplot highlight_text pypalettes plt.subplots() xlabel ylabel title legend colorbar savefig tight_layout grid set_xlim set_ylim plot scatter hist boxplot imshow cmap alpha bins tick_params annotate quiver contour barh stackplot subplots_adjust axhline axvline semilogx semilogy loglog polar streamplot hexbin pcolor tricontour errorbar clabel set_aspect violinplot set_axis_off spines text hatch plt axis plt.bar() plt.axis import figure pyplot highlight_text pypalettes plt.subplots() xlabel ylabel title legend colorbar savefig tight_layout grid set_xlim set_ylim plot scatter hist boxplot imshow cmap alpha bins tick_params annotate quiver contour barh stackplot subplots_adjust axhline axvline semilogx semilogy loglog polar streamplot hexbin pcolor tricontour errorbar clabel set_aspect violinplot set_axis_off spines text hatch plt axis plt.bar() plt.axis import figure pyplot highlight_text pypalettes plt.subplots() xlabel ylabel title legend colorbar savefig tight_layout grid set_xlim set_ylim plot scatter hist boxplot imshow cmap alpha bins tick_params annotate quiver contour barh stackplot subplots_adjust axhline axvline semilogx semilogy loglog polar streamplot hexbin pcolor tricontour errorbar clabel set_aspect violinplot set_axis_off spines text hatch plt axis plt.bar() plt.axis import figure pyplot highlight_text pypalettes plt.subplots() xlabel ylabel title legend colorbar savefig tight_layout grid set_xlim set_ylim plot scatter hist boxplot imshow cmap alpha bins tick_params annotate quiver contour barh stackplot subplots_adjust axhline axvline semilogx semilogy loglog polar streamplot hexbin pcolor tricontour errorbar clabel set_aspect violinplot set_axis_off spines text hatch plt axis plt.bar() plt.axis import figure pyplot highlight_text pypalettes plt.subplots() xlabel ylabel title legend colorbar savefig tight_layout grid set_xlim set_ylim plot scatter hist boxplot imshow cmap alpha bins tick_params annotate quiver contour barh stackplot subplots_adjust axhline axvline semilogx semilogy loglog polar streamplot hexbin pcolor tricontour errorbar clabel set_aspect violinplot set_axis_off spines text hatch plt axis plt.bar() plt.axis import figure pyplot highlight_text pypalettes plt.subplots() xlabel ylabel title legend colorbar savefig tight_layout grid set_xlim set_ylim plot scatter hist boxplot imshow cmap alpha bins tick_params annotate quiver contour barh stackplot subplots_adjust axhline axvline semilogx semilogy loglog polar streamplot hexbin pcolor tricontour errorbar clabel set_aspect violinplot set_axis_off spines text hatch plt axis plt.bar() plt.axis import figure pyplot highlight_text pypalettes plt.subplots() xlabel ylabel title legend colorbar savefig tight_layout grid set_xlim set_ylim plot scatter hist boxplot imshow cmap alpha bins tick_params annotate quiver contour barh stackplot subplots_adjust axhline axvline semilogx semilogy loglog polar streamplot hexbin pcolor tricontour errorbar clabel set_aspect violinplot set_axis_off spines text hatch plt axis plt.bar() plt.axis import figure pyplot highlight_text pypalettes plt.subplots() xlabel ylabel title legend colorbar savefig tight_layout grid set_xlim set_ylim plot scatter hist boxplot imshow cmap alpha bins tick_params annotate quiver contour barh stackplot subplots_adjust axhline axvline semilogx semilogy loglog polar streamplot hexbin pcolor tricontour errorbar clabel set_aspect violinplot set_axis_off spines text hatch plt axis plt.bar() plt.axis import figure pyplot highlight_text pypalettes plt.subplots() xlabel ylabel title legend colorbar savefig tight_layout grid set_xlim set_ylim plot scatter hist boxplot imshow cmap alpha bins tick_params annotate quiver contour barh stackplot subplots_adjust axhline axvline semilogx semilogy loglog polar streamplot hexbin pcolor tricontour errorbar clabel set_aspect violinplot set_axis_off spines text hatch plt axis plt.bar() plt.axis import figure pyplot highlight_text pypalettes plt.subplots() xlabel ylabel title legend colorbar savefig tight_layout grid set_xlim set_ylim plot scatter hist boxplot imshow cmap alpha bins tick_params annotate quiver contour barh stackplot subplots_adjust axhline axvline semilogx semilogy loglog polar streamplot hexbin pcolor tricontour errorbar clabel set_aspect violinplot set_axis_off spines text hatch plt axis plt.bar() plt.axis import figure pyplot highlight_text pypalettes plt.subplots() xlabel ylabel title legend colorbar savefig tight_layout grid set_xlim set_ylim plot scatter hist boxplot imshow cmap alpha bins tick_params annotate quiver contour barh stackplot subplots_adjust axhline axvline semilogx semilogy loglog polar streamplot hexbin pcolor tricontour errorbar clabel set_aspect violinplot set_axis_off spines text hatch plt axis plt.bar() plt.axis import figure pyplot highlight_text pypalettes plt.subplots() xlabel ylabel title legend colorbar savefig tight_layout grid set_xlim set_ylim plot scatter hist boxplot imshow cmap alpha bins tick_params annotate quiver contour barh stackplot subplots_adjust axhline axvline semilogx semilogy loglog polar streamplot hexbin pcolor tricontour errorbar clabel set_aspect violinplot set_axis_off spines text hatch plt axis plt.bar() plt.axis import figure pyplot highlight_text pypalettes plt.subplots() xlabel ylabel title legend colorbar savefig tight_layout grid set_xlim set_ylim plot scatter hist boxplot imshow cmap alpha bins tick_params annotate quiver contour barh stackplot subplots_adjust axhline axvline semilogx semilogy loglog polar streamplot hexbin pcolor tricontour errorbar clabel set_aspect violinplot set_axis_off spines text hatch plt axis plt.bar() plt.axis import figure pyplot highlight_text pypalettes plt.subplots() xlabel ylabel title legend colorbar savefig tight_layout grid set_xlim set_ylim plot scatter hist boxplot imshow cmap alpha bins tick_params annotate quiver contour barh stackplot subplots_adjust axhline axvline semilogx semilogy loglog polar streamplot hexbin pcolor tricontour errorbar clabel set_aspect violinplot set_axis_off spines text hatch plt axis plt.bar() plt.axis import figure pyplot highlight_text pypalettes plt.subplots() xlabel ylabel title legend colorbar savefig tight_layout grid set_xlim set_ylim plot scatter hist boxplot imshow cmap alpha bins tick_params annotate quiver contour barh stackplot subplots_adjust axhline axvline semilogx semilogy loglog polar streamplot hexbin pcolor tricontour errorbar clabel set_aspect violinplot set_axis_off spines text hatch plt axis plt.bar() plt.axis import figure pyplot highlight_text pypalettes plt.subplots() xlabel ylabel title legend colorbar savefig tight_layout grid set_xlim set_ylim plot scatter hist boxplot imshow cmap alpha bins tick_params annotate quiver contour barh stackplot subplots_adjust axhline axvline semilogx semilogy loglog polar streamplot hexbin pcolor tricontour errorbar clabel set_aspect violinplot set_axis_off spines text hatch plt axis plt.bar() plt.axis import figure pyplot highlight_text pypalettes plt.subplots() xlabel ylabel title legend colorbar savefig tight_layout grid set_xlim set_ylim plot scatter hist boxplot imshow cmap alpha bins tick_params annotate quiver contour barh stackplot subplots_adjust axhline axvline semilogx semilogy loglog polar streamplot hexbin pcolor tricontour errorbar clabel set_aspect violinplot set_axis_off spines text hatch plt axis plt.bar() plt.axis import figure pyplot highlight_text pypalettes plt.subplots() xlabel ylabel title legend colorbar savefig tight_layout grid set_xlim set_ylim plot scatter hist boxplot imshow cmap alpha bins tick_params annotate quiver contour barh stackplot subplots_adjust axhline axvline semilogx semilogy loglog polar streamplot hexbin pcolor tricontour errorbar clabel set_aspect violinplot set_axis_off spines text hatch plt axis plt.bar() plt.axis import figure pyplot highlight_text pypalettes plt.subplots() xlabel ylabel title legend colorbar savefig tight_layout grid set_xlim set_ylim plot scatter hist boxplot imshow cmap alpha bins tick_params annotate quiver contour barh stackplot subplots_adjust axhline axvline semilogx semilogy loglog polar streamplot hexbin pcolor tricontour errorbar clabel set_aspect violinplot set_axis_off spines text hatch plt axis plt.bar() plt.axis import figure pyplot highlight_text pypalettes plt.subplots() xlabel ylabel title legend colorbar savefig tight_layout grid set_xlim set_ylim plot scatter hist boxplot imshow cmap alpha bins tick_params annotate quiver contour barh stackplot subplots_adjust axhline axvline semilogx semilogy loglog polar streamplot hexbin pcolor tricontour errorbar clabel set_aspect violinplot set_axis_off spines text hatch plt axis plt.bar() plt.axis import figure pyplot highlight_text pypalettes plt.subplots() xlabel ylabel title legend colorbar savefig tight_layout grid set_xlim set_ylim plot scatter hist boxplot imshow cmap alpha bins tick_params annotate quiver contour barh stackplot subplots_adjust axhline axvline semilogx semilogy loglog polar streamplot hexbin pcolor tricontour errorbar clabel set_aspect violinplot set_axis_off spines text hatch plt axis plt.bar() plt.axis import figure pyplot highlight_text pypalettes plt.subplots() xlabel ylabel title legend colorbar savefig tight_layout grid set_xlim set_ylim plot scatter hist boxplot imshow cmap alpha bins tick_params annotate quiver contour barh stackplot subplots_adjust axhline axvline semilogx semilogy loglog polar streamplot hexbin pcolor tricontour errorbar clabel set_aspect violinplot set_axis_off spines text hatch plt axis plt.bar() plt.axis import figure pyplot highlight_text pypalettes plt.subplots() xlabel ylabel title legend colorbar savefig tight_layout grid set_xlim set_ylim plot scatter hist boxplot imshow cmap alpha bins tick_params annotate quiver contour barh stackplot subplots_adjust axhline axvline semilogx semilogy loglog polar streamplot hexbin pcolor tricontour errorbar clabel set_aspect violinplot set_axis_off spines text hatch plt axis plt.bar() plt.axis import figure pyplot highlight_text pypalettes plt.subplots() xlabel ylabel title legend colorbar savefig tight_layout grid set_xlim set_ylim plot scatter hist boxplot imshow cmap alpha bins tick_params annotate quiver contour barh stackplot subplots_adjust axhline axvline semilogx semilogy loglog polar streamplot hexbin pcolor tricontour errorbar clabel set_aspect violinplot set_axis_off spines text hatch plt axis plt.bar() plt.axis import figure pyplot highlight_text pypalettes plt.subplots() xlabel ylabel title legend colorbar savefig tight_layout grid set_xlim set_ylim plot scatter hist boxplot imshow cmap alpha bins tick_params annotate quiver contour barh stackplot subplots_adjust axhline axvline semilogx semilogy loglog polar streamplot hexbin pcolor tricontour errorbar clabel set_aspect violinplot set_axis_off spines text hatch plt axis plt.bar() plt.axis import figure pyplot highlight_text pypalettes plt.subplots() xlabel ylabel title legend colorbar savefig tight_layout grid set_xlim set_ylim plot scatter hist boxplot imshow cmap alpha bins tick_params annotate quiver contour barh stackplot subplots_adjust axhline axvline semilogx semilogy loglog polar streamplot hexbin pcolor tricontour errorbar clabel set_aspect violinplot set_axis_off spines text hatch plt axis plt.bar() plt.axis import figure pyplot highlight_text pypalettes plt.subplots() xlabel ylabel title legend colorbar savefig tight_layout grid set_xlim set_ylim plot scatter hist boxplot imshow cmap alpha bins tick_params annotate quiver contour barh stackplot subplots_adjust axhline axvline semilogx semilogy loglog polar streamplot hexbin pcolor tricontour errorbar clabel set_aspect violinplot set_axis_off spines text hatch plt axis plt.bar() plt.axis import figure pyplot highlight_text pypalettes plt.subplots() xlabel ylabel title legend colorbar savefig tight_layout grid set_xlim set_ylim plot scatter hist boxplot imshow cmap alpha bins tick_params annotate quiver contour barh stackplot subplots_adjust axhline axvline semilogx semilogy loglog polar streamplot hexbin pcolor tricontour errorbar clabel set_aspect violinplot set_axis_off spines text hatch plt axis plt.bar() plt.axis import figure pyplot highlight_text pypalettes plt.subplots() xlabel ylabel title legend colorbar savefig tight_layout grid set_xlim set_ylim plot scatter hist boxplot imshow cmap alpha bins tick_params annotate quiver contour barh stackplot subplots_adjust axhline axvline semilogx semilogy loglog polar streamplot hexbin pcolor tricontour errorbar clabel set_aspect violinplot set_axis_off spines text hatch plt axis plt.bar() plt.axis import figure pyplot highlight_text pypalettes plt.subplots() xlabel ylabel title legend colorbar savefig tight_layout grid set_xlim set_ylim plot scatter hist boxplot imshow cmap alpha bins tick_params annotate quiver contour barh stackplot subplots_adjust axhline axvline semilogx semilogy loglog polar streamplot hexbin pcolor tricontour errorbar clabel set_aspect violinplot set_axis_off spines text hatch plt axis plt.bar() plt.axis import figure pyplot highlight_text pypalettes plt.subplots() xlabel ylabel title legend colorbar savefig tight_layout grid set_xlim set_ylim plot scatter hist boxplot imshow cmap alpha bins tick_params annotate quiver contour barh stackplot subplots_adjust axhline axvline semilogx semilogy loglog polar streamplot hexbin pcolor tricontour errorbar clabel set_aspect violinplot set_axis_off spines text hatch plt axis plt.bar() plt.axis import figure pyplot highlight_text pypalettes plt.subplots() xlabel ylabel title legend colorbar savefig tight_layout grid set_xlim set_ylim plot scatter hist boxplot imshow cmap alpha bins tick_params annotate quiver contour barh stackplot subplots_adjust axhline axvline semilogx semilogy loglog polar streamplot hexbin pcolor tricontour errorbar clabel set_aspect violinplot set_axis_off spines text hatch plt axis plt.bar() plt.axis import figure pyplot highlight_text pypalettes plt.subplots() xlabel ylabel title legend colorbar savefig tight_layout grid set_xlim set_ylim plot scatter hist boxplot imshow cmap alpha bins tick_params annotate quiver contour barh stackplot subplots_adjust axhline axvline semilogx semilogy loglog polar streamplot hexbin pcolor tricontour errorbar clabel set_aspect violinplot set_axis_off spines text hatch plt axis plt.bar() plt.axis import figure pyplot highlight_text pypalettes plt.subplots() xlabel ylabel title legend colorbar savefig tight_layout grid set_xlim set_ylim plot scatter hist boxplot imshow cmap alpha bins tick_params annotate quiver contour barh stackplot subplots_adjust axhline axvline semilogx semilogy loglog polar streamplot hexbin pcolor tricontour errorbar clabel set_aspect violinplot set_axis_off spines text hatch plt axis plt.bar() plt.axis import figure pyplot highlight_text pypalettes plt.subplots() xlabel ylabel title legend colorbar savefig tight_layout grid set_xlim set_ylim plot scatter hist boxplot imshow cmap alpha bins tick_params annotate quiver contour barh stackplot subplots_adjust axhline axvline semilogx semilogy loglog polar streamplot hexbin pcolor tricontour errorbar clabel set_aspect violinplot set_axis_off spines text hatch plt axis plt.bar() plt.axis import figure pyplot highlight_text pypalettes plt.subplots() xlabel ylabel title legend colorbar savefig tight_layout grid set_xlim set_ylim plot scatter hist boxplot imshow cmap alpha bins tick_params annotate quiver contour barh stackplot subplots_adjust axhline axvline semilogx semilogy loglog polar streamplot hexbin pcolor tricontour errorbar clabel set_aspect violinplot set_axis_off spines text hatch plt axis plt.bar() plt.axis import figure pyplot highlight_text pypalettes plt.subplots() xlabel ylabel title legend colorbar savefig tight_layout grid set_xlim set_ylim plot scatter hist boxplot imshow cmap alpha bins tick_params annotate quiver contour barh stackplot subplots_adjust axhline axvline semilogx semilogy loglog polar streamplot hexbin pcolor tricontour errorbar clabel set_aspect violinplot set_axis_off spines text hatch plt axis plt.bar() plt.axis import figure pyplot highlight_text pypalettes plt.subplots() xlabel ylabel title legend colorbar savefig tight_layout grid set_xlim set_ylim plot scatter hist boxplot imshow cmap alpha bins tick_params annotate quiver contour barh stackplot subplots_adjust axhline axvline semilogx semilogy loglog polar streamplot hexbin pcolor tricontour errorbar clabel set_aspect violinplot set_axis_off spines text hatch plt axis plt.bar() plt.axis import figure pyplot highlight_text pypalettes plt.subplots() xlabel ylabel title legend colorbar savefig tight_layout grid set_xlim set_ylim plot scatter hist boxplot imshow cmap alpha bins tick_params annotate quiver contour barh stackplot subplots_adjust axhline axvline semilogx semilogy loglog polar streamplot hexbin pcolor tricontour errorbar clabel set_aspect violinplot set_axis_off spines text hatch plt axis plt.bar() plt.axis import figure pyplot highlight_text pypalettes plt.subplots() xlabel ylabel title legend colorbar savefig tight_layout grid set_xlim set_ylim plot scatter hist boxplot imshow cmap alpha bins tick_params annotate quiver contour barh stackplot subplots_adjust axhline axvline semilogx semilogy loglog polar streamplot hexbin pcolor tricontour errorbar clabel set_aspect violinplot set_axis_off spines text hatch plt axis plt.bar() plt.axis import figure pyplot highlight_text pypalettes plt.subplots() xlabel ylabel title legend colorbar savefig tight_layout grid set_xlim set_ylim plot scatter hist boxplot imshow cmap alpha bins tick_params annotate quiver contour barh stackplot subplots_adjust axhline axvline semilogx semilogy loglog polar streamplot hexbin pcolor tricontour errorbar clabel set_aspect violinplot set_axis_off spines text hatch plt axis plt.bar() plt.axis import figure pyplot highlight_text pypalettes plt.subplots() xlabel ylabel title legend colorbar savefig tight_layout grid set_xlim set_ylim plot scatter hist boxplot imshow cmap alpha bins tick_params annotate quiver contour barh stackplot subplots_adjust axhline axvline semilogx semilogy loglog polar streamplot hexbin pcolor tricontour errorbar clabel set_aspect violinplot set_axis_off spines text hatch plt axis plt.bar() plt.axis import figure pyplot highlight_text pypalettes plt.subplots() xlabel ylabel title legend colorbar savefig tight_layout grid set_xlim set_ylim plot scatter hist boxplot imshow cmap alpha bins tick_params annotate quiver contour barh stackplot subplots_adjust axhline axvline semilogx semilogy loglog polar streamplot hexbin pcolor tricontour errorbar clabel set_aspect violinplot set_axis_off spines text hatch plt axis plt.bar() plt.axis import figure pyplot highlight_text pypalettes plt.subplots() xlabel ylabel title legend colorbar savefig tight_layout grid set_xlim set_ylim plot scatter hist boxplot imshow cmap alpha bins tick_params annotate quiver contour barh stackplot subplots_adjust axhline axvline semilogx semilogy loglog polar streamplot hexbin pcolor tricontour errorbar clabel set_aspect violinplot set_axis_off spines text hatch plt axis plt.bar() plt.axis import figure pyplot highlight_text pypalettes plt.subplots() xlabel ylabel title legend colorbar savefig tight_layout grid set_xlim set_ylim plot scatter hist boxplot imshow cmap alpha bins tick_params annotate quiver contour barh stackplot subplots_adjust axhline axvline semilogx semilogy loglog polar streamplot hexbin pcolor tricontour errorbar clabel set_aspect violinplot set_axis_off spines text hatch plt axis plt.bar() plt.axis import figure pyplot highlight_text pypalettes plt.subplots() xlabel ylabel title legend colorbar savefig tight_layout grid set_xlim set_ylim plot scatter hist boxplot imshow cmap alpha bins tick_params annotate quiver contour barh stackplot subplots_adjust axhline axvline semilogx semilogy loglog polar streamplot hexbin pcolor tricontour errorbar clabel set_aspect violinplot set_axis_off spines text hatch plt axis plt.bar() plt.axis import figure pyplot highlight_text pypalettes plt.subplots() xlabel ylabel title legend colorbar savefig tight_layout grid set_xlim set_ylim plot scatter hist boxplot imshow cmap alpha bins tick_params annotate quiver contour barh stackplot subplots_adjust axhline axvline semilogx semilogy loglog polar streamplot hexbin pcolor tricontour errorbar clabel set_aspect violinplot set_axis_off spines text hatch plt axis plt.bar() plt.axis import figure pyplot highlight_text pypalettes plt.subplots() xlabel ylabel title legend colorbar savefig tight_layout grid set_xlim set_ylim plot scatter hist boxplot imshow cmap alpha bins tick_params annotate quiver contour barh stackplot subplots_adjust axhline axvline semilogx semilogy loglog polar streamplot hexbin pcolor tricontour errorbar clabel set_aspect violinplot set_axis_off spines text hatch plt axis plt.bar() plt.axis import figure pyplot highlight_text pypalettes plt.subplots() xlabel ylabel title legend colorbar savefig tight_layout grid set_xlim set_ylim plot scatter hist boxplot imshow cmap alpha bins tick_params annotate quiver contour barh stackplot subplots_adjust axhline axvline semilogx semilogy loglog polar streamplot hexbin pcolor tricontour errorbar clabel set_aspect violinplot set_axis_off spines text hatch plt axis plt.bar() plt.axis import figure pyplot highlight_text pypalettes plt.subplots() xlabel ylabel title legend colorbar savefig tight_layout grid set_xlim set_ylim plot scatter hist boxplot imshow cmap alpha bins tick_params annotate quiver contour barh stackplot subplots_adjust axhline axvline semilogx semilogy loglog polar streamplot hexbin pcolor tricontour errorbar clabel set_aspect violinplot set_axis_off spines text hatch plt axis plt.bar() plt.axis import figure pyplot highlight_text pypalettes plt.subplots() xlabel ylabel title legend colorbar savefig tight_layout grid set_xlim set_ylim plot scatter hist boxplot imshow cmap alpha bins tick_params annotate quiver contour barh stackplot subplots_adjust axhline axvline semilogx semilogy loglog polar streamplot hexbin pcolor tricontour errorbar clabel set_aspect violinplot set_axis_off spines text hatch plt axis plt.bar() plt.axis import figure pyplot highlight_text pypalettes plt.subplots() xlabel ylabel title legend colorbar savefig tight_layout grid set_xlim set_ylim plot scatter hist boxplot imshow cmap alpha bins tick_params annotate quiver contour barh stackplot subplots_adjust axhline axvline semilogx semilogy loglog polar streamplot hexbin pcolor tricontour errorbar clabel set_aspect violinplot set_axis_off spines text hatch plt axis plt.bar() plt.axis import figure pyplot highlight_text pypalettes plt.subplots() xlabel ylabel title legend colorbar savefig tight_layout grid set_xlim set_ylim plot scatter hist boxplot imshow cmap alpha bins tick_params annotate quiver contour barh stackplot subplots_adjust axhline axvline semilogx semilogy loglog polar streamplot hexbin pcolor tricontour errorbar clabel set_aspect violinplot set_axis_off spines text hatch plt axis plt.bar() plt.axis import figure pyplot highlight_text pypalettes plt.subplots() xlabel ylabel title legend colorbar savefig tight_layout grid set_xlim set_ylim plot scatter hist boxplot imshow cmap alpha bins tick_params annotate quiver contour barh stackplot subplots_adjust axhline axvline semilogx semilogy loglog polar streamplot hexbin pcolor tricontour errorbar clabel set_aspect violinplot set_axis_off spines text hatch plt axis plt.bar() plt.axis import figure pyplot highlight_text pypalettes plt.subplots() xlabel ylabel title legend colorbar savefig tight_layout grid set_xlim set_ylim plot scatter hist boxplot imshow cmap alpha bins tick_params annotate quiver contour barh stackplot subplots_adjust axhline axvline semilogx semilogy loglog polar streamplot hexbin pcolor tricontour errorbar clabel set_aspect violinplot set_axis_off spines text hatch plt axis plt.bar() plt.axis import figure pyplot highlight_text pypalettes plt.subplots() xlabel ylabel title legend colorbar savefig tight_layout grid set_xlim set_ylim plot scatter hist boxplot imshow cmap alpha bins tick_params annotate quiver contour barh stackplot subplots_adjust axhline axvline semilogx semilogy loglog polar streamplot hexbin pcolor tricontour errorbar clabel set_aspect violinplot set_axis_off spines text hatch plt axis plt.bar() plt.axis import figure pyplot highlight_text pypalettes plt.subplots() xlabel ylabel title legend colorbar savefig tight_layout grid set_xlim set_ylim plot scatter hist boxplot imshow cmap alpha bins tick_params annotate quiver contour barh stackplot subplots_adjust axhline axvline semilogx semilogy loglog polar streamplot hexbin pcolor tricontour errorbar clabel set_aspect violinplot set_axis_off spines text hatch plt axis plt.bar() plt.axis import figure pyplot highlight_text pypalettes plt.subplots() xlabel ylabel title legend colorbar savefig tight_layout grid set_xlim set_ylim plot scatter hist boxplot imshow cmap alpha bins tick_params annotate quiver contour barh stackplot subplots_adjust axhline axvline semilogx semilogy loglog polar streamplot hexbin pcolor tricontour errorbar clabel set_aspect violinplot set_axis_off spines text hatch plt axis plt.bar() plt.axis import figure pyplot highlight_text pypalettes plt.subplots() xlabel ylabel title legend colorbar savefig tight_layout grid set_xlim set_ylim plot scatter hist boxplot imshow cmap alpha bins tick_params annotate quiver contour barh stackplot subplots_adjust axhline axvline semilogx semilogy loglog polar streamplot hexbin pcolor tricontour errorbar clabel set_aspect violinplot set_axis_off spines text hatch plt axis plt.bar() plt.axis import figure pyplot highlight_text pypalettes plt.subplots() xlabel ylabel title legend colorbar savefig tight_layout grid set_xlim set_ylim plot scatter hist boxplot imshow cmap alpha bins tick_params annotate quiver contour barh stackplot subplots_adjust axhline axvline semilogx semilogy loglog polar streamplot hexbin pcolor tricontour errorbar clabel set_aspect violinplot set_axis_off spines text hatch plt axis plt.bar() plt.axis import figure pyplot highlight_text pypalettes plt.subplots() xlabel ylabel title legend colorbar savefig tight_layout grid set_xlim set_ylim plot scatter hist boxplot imshow cmap alpha bins tick_params annotate quiver contour barh stackplot subplots_adjust axhline axvline semilogx semilogy loglog polar streamplot hexbin pcolor tricontour errorbar clabel set_aspect violinplot set_axis_off spines text hatch plt axis plt.bar() plt.axis import figure pyplot highlight_text pypalettes plt.subplots() xlabel ylabel title legend colorbar savefig tight_layout grid set_xlim set_ylim plot scatter hist boxplot imshow cmap alpha bins tick_params annotate quiver contour barh stackplot subplots_adjust axhline axvline semilogx semilogy loglog polar streamplot hexbin pcolor tricontour errorbar clabel set_aspect violinplot set_axis_off spines text hatch plt axis plt.bar() plt.axis import figure pyplot highlight_text pypalettes plt.subplots() xlabel ylabel title legend colorbar savefig tight_layout grid set_xlim set_ylim plot scatter hist boxplot imshow cmap alpha bins tick_params annotate quiver contour barh stackplot subplots_adjust axhline axvline semilogx semilogy loglog polar streamplot hexbin pcolor tricontour errorbar clabel set_aspect violinplot set_axis_off spines text hatch plt axis plt.bar() plt.axis import figure pyplot highlight_text pypalettes plt.subplots() xlabel ylabel title legend colorbar savefig tight_layout grid set_xlim set_ylim plot scatter hist boxplot imshow cmap alpha bins tick_params annotate quiver contour barh stackplot subplots_adjust axhline axvline semilogx semilogy loglog polar streamplot hexbin pcolor tricontour errorbar clabel set_aspect violinplot set_axis_off spines text hatch plt axis plt.bar() plt.axis import figure pyplot highlight_text pypalettes plt.subplots() xlabel ylabel title legend colorbar savefig tight_layout grid set_xlim set_ylim plot scatter hist boxplot imshow cmap alpha bins tick_params annotate quiver contour barh stackplot subplots_adjust axhline axvline semilogx semilogy loglog polar streamplot hexbin pcolor tricontour errorbar clabel set_aspect violinplot set_axis_off spines text hatch plt axis plt.bar() plt.axis import figure pyplot highlight_text pypalettes plt.subplots() xlabel ylabel title legend colorbar savefig tight_layout grid set_xlim set_ylim plot scatter hist boxplot imshow cmap alpha bins tick_params annotate quiver contour barh stackplot subplots_adjust axhline axvline semilogx semilogy loglog polar streamplot hexbin pcolor tricontour errorbar clabel set_aspect violinplot set_axis_off spines text hatch plt axis plt.bar() plt.axis import figure pyplot highlight_text pypalettes plt.subplots() xlabel ylabel title legend colorbar savefig tight_layout grid set_xlim set_ylim plot scatter hist boxplot imshow cmap alpha bins tick_params annotate quiver contour barh stackplot subplots_adjust axhline axvline semilogx semilogy loglog polar streamplot hexbin pcolor tricontour errorbar clabel set_aspect violinplot set_axis_off spines text hatch plt axis plt.bar() plt.axis import figure pyplot highlight_text pypalettes plt.subplots() xlabel ylabel title legend colorbar savefig tight_layout grid set_xlim set_ylim plot scatter hist boxplot imshow cmap alpha bins tick_params annotate quiver contour barh stackplot subplots_adjust axhline axvline semilogx semilogy loglog polar streamplot hexbin pcolor tricontour errorbar clabel set_aspect violinplot set_axis_off spines text hatch plt axis plt.bar() plt.axis import figure pyplot highlight_text pypalettes plt.subplots() xlabel ylabel title legend colorbar savefig tight_layout grid set_xlim set_ylim plot scatter hist boxplot imshow cmap alpha bins tick_params annotate quiver contour barh stackplot subplots_adjust axhline axvline semilogx semilogy loglog polar streamplot hexbin pcolor tricontour errorbar clabel set_aspect violinplot set_axis_off spines text hatch plt axis plt.bar() plt.axis import figure pyplot highlight_text pypalettes plt.subplots() xlabel ylabel title legend colorbar savefig tight_layout grid set_xlim set_ylim plot scatter hist boxplot imshow cmap alpha bins tick_params annotate quiver contour barh stackplot subplots_adjust axhline axvline semilogx semilogy loglog polar streamplot hexbin pcolor tricontour errorbar clabel set_aspect violinplot set_axis_off spines text hatch plt axis plt.bar() plt.axis import figure pyplot highlight_text pypalettes plt.subplots() xlabel ylabel title legend colorbar savefig tight_layout grid set_xlim set_ylim plot scatter hist boxplot imshow cmap alpha bins tick_params annotate quiver contour barh stackplot subplots_adjust axhline axvline semilogx semilogy loglog polar streamplot hexbin pcolor tricontour errorbar clabel set_aspect violinplot set_axis_off spines text hatch plt axis plt.bar() plt.axis import figure pyplot highlight_text pypalettes plt.subplots() xlabel ylabel title legend colorbar savefig tight_layout grid set_xlim set_ylim plot scatter hist boxplot imshow cmap alpha bins tick_params annotate quiver contour barh stackplot subplots_adjust axhline axvline semilogx semilogy loglog polar streamplot hexbin pcolor tricontour errorbar clabel set_aspect violinplot set_axis_off spines text hatch plt axis plt.bar() plt.axis import figure pyplot highlight_text pypalettes plt.subplots() xlabel ylabel title legend colorbar savefig tight_layout grid set_xlim set_ylim plot scatter hist boxplot imshow cmap alpha bins tick_params annotate quiver contour barh stackplot subplots_adjust axhline axvline semilogx semilogy loglog polar streamplot hexbin pcolor tricontour errorbar clabel set_aspect violinplot set_axis_off spines text hatch plt axis plt.bar() plt.axis import figure pyplot highlight_text pypalettes plt.subplots() xlabel ylabel title legend colorbar savefig tight_layout grid set_xlim set_ylim plot scatter hist boxplot imshow cmap alpha bins tick_params annotate quiver contour barh stackplot subplots_adjust axhline axvline semilogx semilogy loglog polar streamplot hexbin pcolor tricontour errorbar clabel set_aspect violinplot set_axis_off spines text hatch plt axis plt.bar() plt.axis import figure pyplot highlight_text pypalettes plt.subplots() xlabel ylabel title legend colorbar savefig tight_layout grid set_xlim set_ylim plot scatter hist boxplot imshow cmap alpha bins tick_params annotate quiver contour barh stackplot subplots_adjust axhline axvline semilogx semilogy loglog polar streamplot hexbin pcolor tricontour errorbar clabel set_aspect violinplot set_axis_off spines text hatch plt axis plt.bar() plt.axis import figure pyplot highlight_text pypalettes plt.subplots() xlabel ylabel title legend colorbar savefig tight_layout grid set_xlim set_ylim plot scatter hist boxplot imshow cmap alpha bins tick_params annotate quiver contour barh stackplot subplots_adjust axhline axvline semilogx semilogy loglog polar streamplot hexbin pcolor tricontour errorbar clabel set_aspect violinplot set_axis_off spines text hatch plt axis plt.bar() plt.axis import figure pyplot highlight_text pypalettes plt.subplots() xlabel ylabel title legend colorbar savefig tight_layout grid set_xlim set_ylim plot scatter hist boxplot imshow cmap alpha bins tick_params annotate quiver contour barh stackplot subplots_adjust axhline axvline semilogx semilogy loglog polar streamplot hexbin pcolor tricontour errorbar clabel set_aspect violinplot set_axis_off spines text hatch plt axis plt.bar() plt.axis import figure pyplot highlight_text pypalettes plt.subplots() xlabel ylabel title legend colorbar savefig tight_layout grid set_xlim set_ylim plot scatter hist boxplot imshow cmap alpha bins tick_params annotate quiver contour barh stackplot subplots_adjust axhline axvline semilogx semilogy loglog polar streamplot hexbin pcolor tricontour errorbar clabel set_aspect violinplot set_axis_off spines text hatch plt axis plt.bar() plt.axis import figure pyplot highlight_text pypalettes plt.subplots() xlabel ylabel title legend colorbar savefig tight_layout grid set_xlim set_ylim plot scatter hist boxplot imshow cmap alpha bins tick_params annotate quiver contour barh stackplot subplots_adjust axhline axvline semilogx semilogy loglog polar streamplot hexbin pcolor tricontour errorbar clabel set_aspect violinplot set_axis_off spines text hatch plt axis plt.bar() plt.axis import figure pyplot highlight_text pypalettes plt.subplots() xlabel ylabel title legend colorbar savefig tight_layout grid set_xlim set_ylim plot scatter hist boxplot imshow cmap alpha bins tick_params annotate quiver contour barh stackplot subplots_adjust axhline axvline semilogx semilogy loglog polar streamplot hexbin pcolor tricontour errorbar clabel set_aspect violinplot set_axis_off spines text hatch plt axis plt.bar() plt.axis import figure pyplot highlight_text pypalettes plt.subplots() xlabel ylabel title legend colorbar savefig tight_layout grid set_xlim set_ylim plot scatter hist boxplot imshow cmap alpha bins tick_params annotate quiver contour barh stackplot subplots_adjust axhline axvline semilogx semilogy loglog polar streamplot hexbin pcolor tricontour errorbar clabel set_aspect violinplot set_axis_off spines text hatch plt axis plt.bar() plt.axis import figure pyplot highlight_text pypalettes plt.subplots() xlabel ylabel title legend colorbar savefig tight_layout grid set_xlim set_ylim plot scatter hist boxplot imshow cmap alpha bins tick_params annotate quiver contour barh stackplot subplots_adjust axhline axvline semilogx semilogy loglog polar streamplot hexbin pcolor tricontour errorbar clabel set_aspect violinplot set_axis_off spines text hatch plt axis plt.bar() plt.axis import figure pyplot highlight_text pypalettes plt.subplots() xlabel ylabel title legend colorbar savefig tight_layout grid set_xlim set_ylim plot scatter hist boxplot imshow cmap alpha bins tick_params annotate quiver contour barh stackplot subplots_adjust axhline axvline semilogx semilogy loglog polar streamplot hexbin pcolor tricontour errorbar clabel set_aspect violinplot set_axis_off spines text hatch plt axis plt.bar() plt.axis import figure pyplot highlight_text pypalettes plt.subplots() xlabel ylabel title legend colorbar savefig tight_layout grid set_xlim set_ylim plot scatter hist boxplot imshow cmap alpha bins tick_params annotate quiver contour barh stackplot subplots_adjust axhline axvline semilogx semilogy loglog polar streamplot hexbin pcolor tricontour errorbar clabel set_aspect violinplot set_axis_off spines text hatch plt axis plt.bar() plt.axis import figure pyplot highlight_text pypalettes plt.subplots() xlabel ylabel title legend colorbar savefig tight_layout grid set_xlim set_ylim plot scatter hist boxplot imshow cmap alpha bins tick_params annotate quiver contour barh stackplot subplots_adjust axhline axvline semilogx semilogy loglog polar streamplot hexbin pcolor tricontour errorbar clabel set_aspect violinplot set_axis_off spines text hatch plt axis plt.bar() plt.axis import figure pyplot highlight_text pypalettes plt.subplots() xlabel ylabel title legend colorbar savefig tight_layout grid set_xlim set_ylim plot scatter hist boxplot imshow cmap alpha bins tick_params annotate quiver contour barh stackplot subplots_adjust axhline axvline semilogx semilogy loglog polar streamplot hexbin pcolor tricontour errorbar clabel set_aspect violinplot set_axis_off spines text hatch plt axis plt.bar() plt.axis import figure pyplot highlight_text pypalettes plt.subplots() xlabel ylabel title legend colorbar savefig tight_layout grid set_xlim set_ylim plot scatter hist boxplot imshow cmap alpha bins tick_params annotate quiver contour barh stackplot subplots_adjust axhline axvline semilogx semilogy loglog polar streamplot hexbin pcolor tricontour errorbar clabel set_aspect violinplot set_axis_off spines text hatch plt axis plt.bar() plt.axis import figure pyplot highlight_text pypalettes plt.subplots() xlabel ylabel title legend colorbar savefig tight_layout grid set_xlim set_ylim plot scatter hist boxplot imshow cmap alpha bins tick_params annotate quiver contour barh stackplot subplots_adjust axhline axvline semilogx semilogy loglog polar streamplot hexbin pcolor tricontour errorbar clabel set_aspect violinplot set_axis_off spines text hatch plt axis plt.bar() plt.axis import figure pyplot highlight_text pypalettes plt.subplots() xlabel ylabel title legend colorbar savefig tight_layout grid set_xlim set_ylim plot scatter hist boxplot imshow cmap alpha bins tick_params annotate quiver contour barh stackplot subplots_adjust axhline axvline semilogx semilogy loglog polar streamplot hexbin pcolor tricontour errorbar clabel set_aspect violinplot set_axis_off spines text hatch plt axis plt.bar() plt.axis import figure pyplot highlight_text pypalettes plt.subplots() xlabel ylabel title legend colorbar savefig tight_layout grid set_xlim set_ylim plot scatter hist boxplot imshow cmap alpha bins tick_params annotate quiver contour barh stackplot subplots_adjust axhline axvline semilogx semilogy loglog polar streamplot hexbin pcolor tricontour errorbar clabel set_aspect violinplot set_axis_off spines text hatch plt axis plt.bar() plt.axis import figure pyplot highlight_text pypalettes plt.subplots() xlabel ylabel title legend colorbar savefig tight_layout grid set_xlim set_ylim plot scatter hist boxplot imshow cmap alpha bins tick_params annotate quiver contour barh stackplot subplots_adjust axhline axvline semilogx semilogy loglog polar streamplot hexbin pcolor tricontour errorbar clabel set_aspect violinplot set_axis_off spines text hatch plt axis plt.bar() plt.axis import figure pyplot highlight_text pypalettes plt.subplots() xlabel ylabel title legend colorbar savefig tight_layout grid set_xlim set_ylim plot scatter hist boxplot imshow cmap alpha bins tick_params annotate quiver contour barh stackplot subplots_adjust axhline axvline semilogx semilogy loglog polar streamplot hexbin pcolor tricontour errorbar clabel set_aspect violinplot set_axis_off spines text hatch plt axis plt.bar() plt.axis import figure pyplot highlight_text pypalettes plt.subplots() xlabel ylabel title legend colorbar savefig tight_layout grid set_xlim set_ylim plot scatter hist boxplot imshow cmap alpha bins tick_params annotate quiver contour barh stackplot subplots_adjust axhline axvline semilogx semilogy loglog polar streamplot hexbin pcolor tricontour errorbar clabel set_aspect violinplot set_axis_off spines text hatch plt axis plt.bar() plt.axis import figure pyplot highlight_text pypalettes plt.subplots() xlabel ylabel title legend colorbar savefig tight_layout grid set_xlim set_ylim plot scatter hist boxplot imshow cmap alpha bins tick_params annotate quiver contour barh stackplot subplots_adjust axhline axvline semilogx semilogy loglog polar streamplot hexbin pcolor tricontour errorbar clabel set_aspect violinplot set_axis_off spines text hatch plt axis plt.bar() plt.axis import figure pyplot highlight_text pypalettes plt.subplots() xlabel ylabel title legend colorbar savefig tight_layout grid set_xlim set_ylim plot scatter hist boxplot imshow cmap alpha bins tick_params annotate quiver contour barh stackplot subplots_adjust axhline axvline semilogx semilogy loglog polar streamplot hexbin pcolor tricontour errorbar clabel set_aspect violinplot set_axis_off spines text hatch plt axis plt.bar() plt.axis import figure pyplot highlight_text pypalettes plt.subplots() xlabel ylabel title legend colorbar savefig tight_layout grid set_xlim set_ylim plot scatter hist boxplot imshow cmap alpha bins tick_params annotate quiver contour barh stackplot subplots_adjust axhline axvline semilogx semilogy loglog polar streamplot hexbin pcolor tricontour errorbar clabel set_aspect violinplot set_axis_off spines text hatch plt axis plt.bar() plt.axis import figure pyplot highlight_text pypalettes plt.subplots() xlabel ylabel title legend colorbar savefig tight_layout grid set_xlim set_ylim plot scatter hist boxplot imshow cmap alpha bins tick_params annotate quiver contour barh stackplot subplots_adjust axhline axvline semilogx semilogy loglog polar streamplot hexbin pcolor tricontour errorbar clabel set_aspect violinplot set_axis_off spines text hatch plt axis plt.bar() plt.axis import figure pyplot highlight_text pypalettes plt.subplots() xlabel ylabel title legend colorbar savefig tight_layout grid set_xlim set_ylim plot scatter hist boxplot imshow cmap alpha bins tick_params annotate quiver contour barh stackplot subplots_adjust axhline axvline semilogx semilogy loglog polar streamplot hexbin pcolor tricontour errorbar clabel set_aspect violinplot set_axis_off spines text hatch plt axis plt.bar() plt.axis import figure pyplot highlight_text pypalettes plt.subplots() xlabel ylabel title legend colorbar savefig tight_layout grid set_xlim set_ylim plot scatter hist boxplot imshow cmap alpha bins tick_params annotate quiver contour barh stackplot subplots_adjust axhline axvline semilogx semilogy loglog polar streamplot hexbin pcolor tricontour errorbar clabel set_aspect violinplot set_axis_off spines text hatch plt axis plt.bar() plt.axis import figure pyplot highlight_text pypalettes plt.subplots() xlabel ylabel title legend colorbar savefig tight_layout grid set_xlim set_ylim plot scatter hist boxplot imshow cmap alpha bins tick_params annotate quiver contour barh stackplot subplots_adjust axhline axvline semilogx semilogy loglog polar streamplot hexbin pcolor tricontour errorbar clabel set_aspect violinplot set_axis_off spines text hatch plt axis plt.bar() plt.axis import figure pyplot highlight_text pypalettes plt.subplots() xlabel ylabel title legend colorbar savefig tight_layout grid set_xlim set_ylim plot scatter hist boxplot imshow cmap alpha bins tick_params annotate quiver contour barh stackplot subplots_adjust axhline axvline semilogx semilogy loglog polar streamplot hexbin pcolor tricontour errorbar clabel set_aspect violinplot set_axis_off spines text hatch plt axis plt.bar() plt.axis import figure pyplot highlight_text pypalettes plt.subplots() xlabel ylabel title legend colorbar savefig tight_layout grid set_xlim set_ylim plot scatter hist boxplot imshow cmap alpha bins tick_params annotate quiver contour barh stackplot subplots_adjust axhline axvline semilogx semilogy loglog polar streamplot hexbin pcolor tricontour errorbar clabel set_aspect violinplot set_axis_off spines text hatch plt axis plt.bar() plt.axis import figure pyplot highlight_text pypalettes plt.subplots() xlabel ylabel title legend colorbar savefig tight_layout grid set_xlim set_ylim plot scatter hist boxplot imshow cmap alpha bins tick_params annotate quiver contour barh stackplot subplots_adjust axhline axvline semilogx semilogy loglog polar streamplot hexbin pcolor tricontour errorbar clabel set_aspect violinplot set_axis_off spines text hatch plt axis plt.bar() plt.axis import figure pyplot highlight_text pypalettes plt.subplots() xlabel ylabel title legend colorbar savefig tight_layout grid set_xlim set_ylim plot scatter hist boxplot imshow cmap alpha bins tick_params annotate quiver contour barh stackplot subplots_adjust axhline axvline semilogx semilogy loglog polar streamplot hexbin pcolor tricontour errorbar clabel set_aspect violinplot set_axis_off spines text hatch plt axis plt.bar() plt.axis import figure pyplot highlight_text pypalettes plt.subplots() xlabel ylabel title legend colorbar savefig tight_layout grid set_xlim set_ylim plot scatter hist boxplot imshow cmap alpha bins tick_params annotate quiver contour barh stackplot subplots_adjust axhline axvline semilogx semilogy loglog polar streamplot hexbin pcolor tricontour errorbar clabel set_aspect violinplot set_axis_off spines text hatch plt axis plt.bar() plt.axis import figure pyplot highlight_text pypalettes plt.subplots() xlabel ylabel title legend colorbar savefig tight_layout grid set_xlim set_ylim plot scatter hist boxplot imshow cmap alpha bins tick_params annotate quiver contour barh stackplot subplots_adjust axhline axvline semilogx semilogy loglog polar streamplot hexbin pcolor tricontour errorbar clabel set_aspect violinplot set_axis_off spines text hatch plt axis plt.bar() plt.axis import figure pyplot highlight_text pypalettes plt.subplots() xlabel ylabel title legend colorbar savefig tight_layout grid set_xlim set_ylim plot scatter hist boxplot imshow cmap alpha bins tick_params annotate quiver contour barh stackplot subplots_adjust axhline axvline semilogx semilogy loglog polar streamplot hexbin pcolor tricontour errorbar clabel set_aspect violinplot set_axis_off spines text hatch plt axis plt.bar() plt.axis import figure pyplot highlight_text pypalettes plt.subplots() xlabel ylabel title legend colorbar savefig tight_layout grid set_xlim set_ylim plot scatter hist boxplot imshow cmap alpha bins tick_params annotate quiver contour barh stackplot subplots_adjust axhline axvline semilogx semilogy loglog polar streamplot hexbin pcolor tricontour errorbar clabel set_aspect violinplot set_axis_off spines text hatch plt axis plt.bar() plt.axis import figure pyplot highlight_text pypalettes plt.subplots() xlabel ylabel title legend colorbar savefig tight_layout grid set_xlim set_ylim plot scatter hist boxplot imshow cmap alpha bins tick_params annotate quiver contour barh stackplot subplots_adjust axhline axvline semilogx semilogy loglog polar streamplot hexbin pcolor tricontour errorbar clabel set_aspect violinplot set_axis_off spines text hatch plt axis plt.bar() plt.axis import figure pyplot highlight_text pypalettes plt.subplots() xlabel ylabel title legend colorbar savefig tight_layout grid set_xlim set_ylim plot scatter hist boxplot imshow cmap alpha bins tick_params annotate quiver contour barh stackplot subplots_adjust axhline axvline semilogx semilogy loglog polar streamplot hexbin pcolor tricontour errorbar clabel set_aspect violinplot set_axis_off spines text hatch plt axis plt.bar() plt.axis import figure pyplot highlight_text pypalettes plt.subplots() xlabel ylabel title legend colorbar savefig tight_layout grid set_xlim set_ylim plot scatter hist boxplot imshow cmap alpha bins tick_params annotate quiver contour barh stackplot subplots_adjust axhline axvline semilogx semilogy loglog polar streamplot hexbin pcolor tricontour errorbar clabel set_aspect violinplot set_axis_off spines text hatch plt axis plt.bar() plt.axis import figure pyplot highlight_text pypalettes plt.subplots() xlabel ylabel title legend colorbar savefig tight_layout grid set_xlim set_ylim plot scatter hist boxplot imshow cmap alpha bins tick_params annotate quiver contour barh stackplot subplots_adjust axhline axvline semilogx semilogy loglog polar streamplot hexbin pcolor tricontour errorbar clabel set_aspect violinplot set_axis_off spines text hatch plt axis plt.bar() plt.axis import figure pyplot highlight_text pypalettes plt.subplots() xlabel ylabel title legend colorbar savefig tight_layout grid set_xlim set_ylim plot scatter hist boxplot imshow cmap alpha bins tick_params annotate quiver contour barh stackplot subplots_adjust axhline axvline semilogx semilogy loglog polar streamplot hexbin pcolor tricontour errorbar clabel set_aspect violinplot set_axis_off spines text hatch plt axis plt.bar() plt.axis import figure pyplot highlight_text pypalettes plt.subplots() xlabel ylabel title legend colorbar savefig tight_layout grid set_xlim set_ylim plot scatter hist boxplot imshow cmap alpha bins tick_params annotate quiver contour barh stackplot subplots_adjust axhline axvline semilogx semilogy loglog polar streamplot hexbin pcolor tricontour errorbar clabel set_aspect violinplot set_axis_off spines text hatch plt axis plt.bar() plt.axis import figure pyplot highlight_text pypalettes plt.subplots() xlabel ylabel title legend colorbar savefig tight_layout grid set_xlim set_ylim plot scatter hist boxplot imshow cmap alpha bins tick_params annotate quiver contour barh stackplot subplots_adjust axhline axvline semilogx semilogy loglog polar streamplot hexbin pcolor tricontour errorbar clabel set_aspect violinplot set_axis_off spines text hatch plt axis plt.bar() plt.axis import figure pyplot highlight_text pypalettes plt.subplots() xlabel ylabel title legend colorbar savefig tight_layout grid set_xlim set_ylim plot scatter hist boxplot imshow cmap alpha bins tick_params annotate quiver contour barh stackplot subplots_adjust axhline axvline semilogx semilogy loglog polar streamplot hexbin pcolor tricontour errorbar clabel set_aspect violinplot set_axis_off spines text hatch plt axis plt.bar() plt.axis import figure pyplot highlight_text pypalettes plt.subplots() xlabel ylabel title legend colorbar savefig tight_layout grid set_xlim set_ylim plot scatter hist boxplot imshow cmap alpha bins tick_params annotate quiver contour barh stackplot subplots_adjust axhline axvline semilogx semilogy loglog polar streamplot hexbin pcolor tricontour errorbar clabel set_aspect violinplot set_axis_off spines text hatch plt axis plt.bar() plt.axis import figure pyplot highlight_text pypalettes plt.subplots() xlabel ylabel title legend colorbar savefig tight_layout grid set_xlim set_ylim plot scatter hist boxplot imshow cmap alpha bins tick_params annotate quiver contour barh stackplot subplots_adjust axhline axvline semilogx semilogy loglog polar streamplot hexbin pcolor tricontour errorbar clabel set_aspect violinplot set_axis_off spines text hatch plt axis plt.bar() plt.axis import figure pyplot highlight_text pypalettes plt.subplots() xlabel ylabel title legend colorbar savefig tight_layout grid set_xlim set_ylim plot scatter hist boxplot imshow cmap alpha bins tick_params annotate quiver contour barh stackplot subplots_adjust axhline axvline semilogx semilogy loglog polar streamplot hexbin pcolor tricontour errorbar clabel set_aspect violinplot set_axis_off spines text hatch plt axis plt.bar() plt.axis import figure pyplot highlight_text pypalettes plt.subplots() xlabel ylabel title legend colorbar savefig tight_layout grid set_xlim set_ylim plot scatter hist boxplot imshow cmap alpha bins tick_params annotate quiver contour barh stackplot subplots_adjust axhline axvline semilogx semilogy loglog polar streamplot hexbin pcolor tricontour errorbar clabel set_aspect violinplot set_axis_off spines text hatch plt axis plt.bar() plt.axis import figure pyplot highlight_text pypalettes plt.subplots() xlabel ylabel title legend colorbar savefig tight_layout grid set_xlim set_ylim plot scatter hist boxplot imshow cmap alpha bins tick_params annotate quiver contour barh stackplot subplots_adjust axhline axvline semilogx semilogy loglog polar streamplot hexbin pcolor tricontour errorbar clabel set_aspect violinplot set_axis_off spines text hatch plt axis plt.bar() plt.axis import figure pyplot highlight_text pypalettes plt.subplots() xlabel ylabel title legend colorbar savefig tight_layout grid set_xlim set_ylim plot scatter hist boxplot imshow cmap alpha bins tick_params annotate quiver contour barh stackplot subplots_adjust axhline axvline semilogx semilogy loglog polar streamplot hexbin pcolor tricontour errorbar clabel set_aspect violinplot set_axis_off spines text hatch plt axis plt.bar() plt.axis import figure pyplot highlight_text pypalettes plt.subplots() xlabel ylabel title legend colorbar savefig tight_layout grid set_xlim set_ylim plot scatter hist boxplot imshow cmap alpha bins tick_params annotate quiver contour barh stackplot subplots_adjust axhline axvline semilogx semilogy loglog polar streamplot hexbin pcolor tricontour errorbar clabel set_aspect violinplot set_axis_off spines text hatch plt axis plt.bar() plt.axis import figure pyplot highlight_text pypalettes plt.subplots() xlabel ylabel title legend colorbar savefig tight_layout grid set_xlim set_ylim plot scatter hist boxplot imshow cmap alpha bins tick_params annotate quiver contour barh stackplot subplots_adjust axhline axvline semilogx semilogy loglog polar streamplot hexbin pcolor tricontour errorbar clabel set_aspect violinplot set_axis_off spines text hatch plt axis plt.bar() plt.axis import figure pyplot highlight_text pypalettes plt.subplots() xlabel ylabel title legend colorbar savefig tight_layout grid set_xlim set_ylim plot scatter hist boxplot imshow cmap alpha bins tick_params annotate quiver contour barh stackplot subplots_adjust axhline axvline semilogx semilogy loglog polar streamplot hexbin pcolor tricontour errorbar clabel set_aspect violinplot set_axis_off spines text hatch plt axis plt.bar() plt.axis import figure pyplot highlight_text pypalettes plt.subplots() xlabel ylabel title legend colorbar savefig tight_layout grid set_xlim set_ylim plot scatter hist boxplot imshow cmap alpha bins tick_params annotate quiver contour barh stackplot subplots_adjust axhline axvline semilogx semilogy loglog polar streamplot hexbin pcolor tricontour errorbar clabel set_aspect violinplot set_axis_off spines text hatch plt axis plt.bar() plt.axis import figure pyplot highlight_text pypalettes plt.subplots() xlabel ylabel title legend colorbar savefig tight_layout grid set_xlim set_ylim plot scatter hist boxplot imshow cmap alpha bins tick_params annotate quiver contour barh stackplot subplots_adjust axhline axvline semilogx semilogy loglog polar streamplot hexbin pcolor tricontour errorbar clabel set_aspect violinplot set_axis_off spines text hatch plt axis plt.bar() plt.axis import figure pyplot highlight_text pypalettes plt.subplots() xlabel ylabel title legend colorbar savefig tight_layout grid set_xlim set_ylim plot scatter hist boxplot imshow cmap alpha bins tick_params annotate quiver contour barh stackplot subplots_adjust axhline axvline semilogx semilogy loglog polar streamplot hexbin pcolor tricontour errorbar clabel set_aspect violinplot set_axis_off spines text hatch plt axis plt.bar() plt.axis import figure pyplot highlight_text pypalettes plt.subplots() xlabel ylabel title legend colorbar savefig tight_layout grid set_xlim set_ylim plot scatter hist boxplot imshow cmap alpha bins tick_params annotate quiver contour barh stackplot subplots_adjust axhline axvline semilogx semilogy loglog polar streamplot hexbin pcolor tricontour errorbar clabel set_aspect violinplot set_axis_off spines text hatch plt axis plt.bar() plt.axis import figure pyplot highlight_text pypalettes plt.subplots() xlabel ylabel title legend colorbar savefig tight_layout grid set_xlim set_ylim plot scatter hist boxplot imshow cmap alpha bins tick_params annotate quiver contour barh stackplot subplots_adjust axhline axvline semilogx semilogy loglog polar streamplot hexbin pcolor tricontour errorbar clabel set_aspect violinplot set_axis_off spines text hatch plt axis plt.bar() plt.axis import figure pyplot highlight_text pypalettes plt.subplots() xlabel ylabel title legend colorbar savefig tight_layout grid set_xlim set_ylim plot scatter hist boxplot imshow cmap alpha bins tick_params annotate quiver contour barh stackplot subplots_adjust axhline axvline semilogx semilogy loglog polar streamplot hexbin pcolor tricontour errorbar clabel set_aspect violinplot set_axis_off spines text hatch plt axis plt.bar() plt.axis import figure pyplot highlight_text pypalettes plt.subplots() xlabel ylabel title legend colorbar savefig tight_layout grid set_xlim set_ylim plot scatter hist boxplot imshow cmap alpha bins tick_params annotate quiver contour barh stackplot subplots_adjust axhline axvline semilogx semilogy loglog polar streamplot hexbin pcolor tricontour errorbar clabel set_aspect violinplot set_axis_off spines text hatch plt axis plt.bar() plt.axis import figure pyplot highlight_text pypalettes plt.subplots() xlabel ylabel title legend colorbar savefig tight_layout grid set_xlim set_ylim plot scatter hist boxplot imshow cmap alpha bins tick_params annotate quiver contour barh stackplot subplots_adjust axhline axvline semilogx semilogy loglog polar streamplot hexbin pcolor tricontour errorbar clabel set_aspect violinplot set_axis_off spines text hatch plt axis plt.bar() plt.axis import figure pyplot highlight_text pypalettes plt.subplots() xlabel ylabel title legend colorbar savefig tight_layout grid set_xlim set_ylim plot scatter hist boxplot imshow cmap alpha bins tick_params annotate quiver contour barh stackplot subplots_adjust axhline axvline semilogx semilogy loglog polar streamplot hexbin pcolor tricontour errorbar clabel set_aspect violinplot set_axis_off spines text hatch plt axis plt.bar() plt.axis import figure pyplot highlight_text pypalettes plt.subplots() xlabel ylabel title legend colorbar savefig tight_layout grid set_xlim set_ylim plot scatter hist boxplot imshow cmap alpha bins tick_params annotate quiver contour barh stackplot subplots_adjust axhline axvline semilogx semilogy loglog polar streamplot hexbin pcolor tricontour errorbar clabel set_aspect violinplot set_axis_off spines text hatch plt axis plt.bar() plt.axis import figure pyplot highlight_text pypalettes plt.subplots() xlabel ylabel title legend colorbar savefig tight_layout grid set_xlim set_ylim plot scatter hist boxplot imshow cmap alpha bins tick_params annotate quiver contour barh stackplot subplots_adjust axhline axvline semilogx semilogy loglog polar streamplot hexbin pcolor tricontour errorbar clabel set_aspect violinplot set_axis_off spines text hatch plt axis plt.bar() plt.axis import figure pyplot highlight_text pypalettes plt.subplots() xlabel ylabel title legend colorbar savefig tight_layout grid set_xlim set_ylim plot scatter hist boxplot imshow cmap alpha bins tick_params annotate quiver contour barh stackplot subplots_adjust axhline axvline semilogx semilogy loglog polar streamplot hexbin pcolor tricontour errorbar clabel set_aspect violinplot set_axis_off spines text hatch plt axis plt.bar() plt.axis import figure pyplot highlight_text pypalettes plt.subplots() xlabel ylabel title legend colorbar savefig tight_layout grid set_xlim set_ylim plot scatter hist boxplot imshow cmap alpha bins tick_params annotate quiver contour barh stackplot subplots_adjust axhline axvline semilogx semilogy loglog polar streamplot hexbin pcolor tricontour errorbar clabel set_aspect violinplot set_axis_off spines text hatch plt axis plt.bar() plt.axis import figure pyplot highlight_text pypalettes plt.subplots() xlabel ylabel title legend colorbar savefig tight_layout grid set_xlim set_ylim plot scatter hist boxplot imshow cmap alpha bins tick_params annotate quiver contour barh stackplot subplots_adjust axhline axvline semilogx semilogy loglog polar streamplot hexbin pcolor tricontour errorbar clabel set_aspect violinplot set_axis_off spines text hatch plt axis plt.bar() plt.axis import figure pyplot highlight_text pypalettes plt.subplots() xlabel ylabel title legend colorbar savefig tight_layout grid set_xlim set_ylim plot scatter hist boxplot imshow cmap alpha bins tick_params annotate quiver contour barh stackplot subplots_adjust axhline axvline semilogx semilogy loglog polar streamplot hexbin pcolor tricontour errorbar clabel set_aspect violinplot set_axis_off spines text hatch plt axis plt.bar() plt.axis import figure pyplot highlight_text pypalettes plt.subplots() xlabel ylabel title legend colorbar savefig tight_layout grid set_xlim set_ylim plot scatter hist boxplot imshow cmap alpha bins tick_params annotate quiver contour barh stackplot subplots_adjust axhline axvline semilogx semilogy loglog polar streamplot hexbin pcolor tricontour errorbar clabel set_aspect violinplot set_axis_off spines text hatch plt axis plt.bar() plt.axis import figure pyplot highlight_text pypalettes plt.subplots() xlabel ylabel title legend colorbar savefig tight_layout grid set_xlim set_ylim plot scatter hist boxplot imshow cmap alpha bins tick_params annotate quiver contour barh stackplot subplots_adjust axhline axvline semilogx semilogy loglog polar streamplot hexbin pcolor tricontour errorbar clabel set_aspect violinplot set_axis_off spines text hatch plt axis plt.bar() plt.axis import figure pyplot highlight_text pypalettes plt.subplots() xlabel ylabel title legend colorbar savefig tight_layout grid set_xlim set_ylim plot scatter hist boxplot imshow cmap alpha bins tick_params annotate quiver contour barh stackplot subplots_adjust axhline axvline semilogx semilogy loglog polar streamplot hexbin pcolor tricontour errorbar clabel set_aspect violinplot set_axis_off spines text hatch plt axis plt.bar() plt.axis import figure pyplot highlight_text pypalettes plt.subplots() xlabel ylabel title legend colorbar savefig tight_layout grid set_xlim set_ylim plot scatter hist boxplot imshow cmap alpha bins tick_params annotate quiver contour barh stackplot subplots_adjust axhline axvline semilogx semilogy loglog polar streamplot hexbin pcolor tricontour errorbar clabel set_aspect violinplot set_axis_off spines text hatch plt axis plt.bar() plt.axis import figure pyplot highlight_text pypalettes plt.subplots() xlabel ylabel title legend colorbar savefig tight_layout grid set_xlim set_ylim plot scatter hist boxplot imshow cmap alpha bins tick_params annotate quiver contour barh stackplot subplots_adjust axhline axvline semilogx semilogy loglog polar streamplot hexbin pcolor tricontour errorbar clabel set_aspect violinplot set_axis_off spines text hatch plt axis plt.bar() plt.axis import figure pyplot highlight_text pypalettes plt.subplots() xlabel ylabel title legend colorbar savefig tight_layout grid set_xlim set_ylim plot scatter hist boxplot imshow cmap alpha bins tick_params annotate quiver contour barh stackplot subplots_adjust axhline axvline semilogx semilogy loglog polar streamplot hexbin pcolor tricontour errorbar clabel set_aspect violinplot set_axis_off spines text hatch plt axis plt.bar() plt.axis import figure pyplot highlight_text pypalettes plt.subplots() xlabel ylabel title legend colorbar savefig tight_layout grid set_xlim set_ylim plot scatter hist boxplot imshow cmap alpha bins tick_params annotate quiver contour barh stackplot subplots_adjust axhline axvline semilogx semilogy loglog polar streamplot hexbin pcolor tricontour errorbar clabel set_aspect violinplot set_axis_off spines text hatch plt axis plt.bar() plt.axis import figure pyplot highlight_text pypalettes plt.subplots() xlabel ylabel title legend colorbar savefig tight_layout grid set_xlim set_ylim plot scatter hist boxplot imshow cmap alpha bins tick_params annotate quiver contour barh stackplot subplots_adjust axhline axvline semilogx semilogy loglog polar streamplot hexbin pcolor tricontour errorbar clabel set_aspect violinplot set_axis_off spines text hatch plt axis plt.bar() plt.axis import figure pyplot highlight_text pypalettes plt.subplots() xlabel ylabel title legend colorbar savefig tight_layout grid set_xlim set_ylim plot scatter hist boxplot imshow cmap alpha bins tick_params annotate quiver contour barh stackplot subplots_adjust axhline axvline semilogx semilogy loglog polar streamplot hexbin pcolor tricontour errorbar clabel set_aspect violinplot set_axis_off spines text hatch plt axis plt.bar() plt.axis import figure pyplot highlight_text pypalettes plt.subplots() xlabel ylabel title legend colorbar savefig tight_layout grid set_xlim set_ylim plot scatter hist boxplot imshow cmap alpha bins tick_params annotate quiver contour barh stackplot subplots_adjust axhline axvline semilogx semilogy loglog polar streamplot hexbin pcolor tricontour errorbar clabel set_aspect violinplot set_axis_off spines text hatch plt axis plt.bar() plt.axis import figure pyplot highlight_text pypalettes plt.subplots() xlabel ylabel title legend colorbar savefig tight_layout grid set_xlim set_ylim plot scatter hist boxplot imshow cmap alpha bins tick_params annotate quiver contour barh stackplot subplots_adjust axhline axvline semilogx semilogy loglog polar streamplot hexbin pcolor tricontour errorbar clabel set_aspect violinplot set_axis_off spines text hatch plt axis plt.bar() plt.axis import figure pyplot highlight_text pypalettes plt.subplots() xlabel ylabel title legend colorbar savefig tight_layout grid set_xlim set_ylim plot scatter hist boxplot imshow cmap alpha bins tick_params annotate quiver contour barh stackplot subplots_adjust axhline axvline semilogx semilogy loglog polar streamplot hexbin pcolor tricontour errorbar clabel set_aspect violinplot set_axis_off spines text hatch plt axis plt.bar() plt.axis import figure pyplot highlight_text pypalettes plt.subplots() xlabel ylabel title legend colorbar savefig tight_layout grid set_xlim set_ylim plot scatter hist boxplot imshow cmap alpha bins tick_params annotate quiver contour barh stackplot subplots_adjust axhline axvline semilogx semilogy loglog polar streamplot hexbin pcolor tricontour errorbar clabel set_aspect violinplot set_axis_off spines text hatch plt axis plt.bar() plt.axis import figure pyplot highlight_text pypalettes plt.subplots() xlabel ylabel title legend colorbar savefig tight_layout grid set_xlim set_ylim plot scatter hist boxplot imshow cmap alpha bins tick_params annotate quiver contour barh stackplot subplots_adjust axhline axvline semilogx semilogy loglog polar streamplot hexbin pcolor tricontour errorbar clabel set_aspect violinplot set_axis_off spines text hatch plt axis plt.bar() plt.axis import figure pyplot highlight_text pypalettes plt.subplots() xlabel ylabel title legend colorbar savefig tight_layout grid set_xlim set_ylim plot scatter hist boxplot imshow cmap alpha bins tick_params annotate quiver contour barh stackplot subplots_adjust axhline axvline semilogx semilogy loglog polar streamplot hexbin pcolor tricontour errorbar clabel set_aspect violinplot set_axis_off spines text hatch plt axis plt.bar() plt.axis import figure pyplot highlight_text pypalettes plt.subplots() xlabel ylabel title legend colorbar savefig tight_layout grid set_xlim set_ylim plot scatter hist boxplot imshow cmap alpha bins tick_params annotate quiver contour barh stackplot subplots_adjust axhline axvline semilogx semilogy loglog polar streamplot hexbin pcolor tricontour errorbar clabel set_aspect violinplot set_axis_off spines text hatch plt axis plt.bar() plt.axis import figure pyplot highlight_text pypalettes plt.subplots() xlabel ylabel title legend colorbar savefig tight_layout grid set_xlim set_ylim plot scatter hist boxplot imshow cmap alpha bins tick_params annotate quiver contour barh stackplot subplots_adjust axhline axvline semilogx semilogy loglog polar streamplot hexbin pcolor tricontour errorbar clabel set_aspect violinplot set_axis_off spines text hatch plt axis plt.bar() plt.axis import figure pyplot highlight_text pypalettes plt.subplots() xlabel ylabel title legend colorbar savefig tight_layout grid set_xlim set_ylim plot scatter hist boxplot imshow cmap alpha bins tick_params annotate quiver contour barh stackplot subplots_adjust axhline axvline semilogx semilogy loglog polar streamplot hexbin pcolor tricontour errorbar clabel set_aspect violinplot set_axis_off spines text hatch plt axis plt.bar() plt.axis import figure pyplot highlight_text pypalettes plt.subplots() xlabel ylabel title legend colorbar savefig tight_layout grid set_xlim set_ylim plot scatter hist boxplot imshow cmap alpha bins tick_params annotate quiver contour barh stackplot subplots_adjust axhline axvline semilogx semilogy loglog polar streamplot hexbin pcolor tricontour errorbar clabel set_aspect violinplot set_axis_off spines text hatch plt axis plt.bar() plt.axis import figure pyplot highlight_text pypalettes plt.subplots() xlabel ylabel title legend colorbar savefig tight_layout grid set_xlim set_ylim plot scatter hist boxplot imshow cmap alpha bins tick_params annotate quiver contour barh stackplot subplots_adjust axhline axvline semilogx semilogy loglog polar streamplot hexbin pcolor tricontour errorbar clabel set_aspect violinplot set_axis_off spines text hatch plt axis plt.bar() plt.axis import figure pyplot highlight_text pypalettes plt.subplots() xlabel ylabel title legend colorbar savefig tight_layout grid set_xlim set_ylim plot scatter hist boxplot imshow cmap alpha bins tick_params annotate quiver contour barh stackplot subplots_adjust axhline axvline semilogx semilogy loglog polar streamplot hexbin pcolor tricontour errorbar clabel set_aspect violinplot set_axis_off spines text hatch plt axis plt.bar() plt.axis import figure pyplot highlight_text pypalettes plt.subplots() xlabel ylabel title legend colorbar savefig tight_layout grid set_xlim set_ylim plot scatter hist boxplot imshow cmap alpha bins tick_params annotate quiver contour barh stackplot subplots_adjust axhline axvline semilogx semilogy loglog polar streamplot hexbin pcolor tricontour errorbar clabel set_aspect violinplot set_axis_off spines text hatch plt axis plt.bar() plt.axis import figure pyplot highlight_text pypalettes plt.subplots() xlabel ylabel title legend colorbar savefig tight_layout grid set_xlim set_ylim plot scatter hist boxplot imshow cmap alpha bins tick_params annotate quiver contour barh stackplot subplots_adjust axhline axvline semilogx semilogy loglog polar streamplot hexbin pcolor tricontour errorbar clabel set_aspect violinplot set_axis_off spines text hatch plt axis plt.bar() plt.axis import figure pyplot highlight_text pypalettes plt.subplots() xlabel ylabel title legend colorbar savefig tight_layout grid set_xlim set_ylim plot scatter hist boxplot imshow cmap alpha bins tick_params annotate quiver contour barh stackplot subplots_adjust axhline axvline semilogx semilogy loglog polar streamplot hexbin pcolor tricontour errorbar clabel set_aspect violinplot set_axis_off spines text hatch plt axis plt.bar() plt.axis import figure pyplot highlight_text pypalettes plt.subplots() xlabel ylabel title legend colorbar savefig tight_layout grid set_xlim set_ylim plot scatter hist boxplot imshow cmap alpha bins tick_params annotate quiver contour barh stackplot subplots_adjust axhline axvline semilogx semilogy loglog polar streamplot hexbin pcolor tricontour errorbar clabel set_aspect violinplot set_axis_off spines text hatch plt axis plt.bar() plt.axis import figure pyplot highlight_text pypalettes plt.subplots() xlabel ylabel title legend colorbar savefig tight_layout grid set_xlim set_ylim plot scatter hist boxplot imshow cmap alpha bins tick_params annotate quiver contour barh stackplot subplots_adjust axhline axvline semilogx semilogy loglog polar streamplot hexbin pcolor tricontour errorbar clabel set_aspect violinplot set_axis_off spines text hatch plt axis plt.bar() plt.axis import figure pyplot highlight_text pypalettes plt.subplots() xlabel ylabel title legend colorbar savefig tight_layout grid set_xlim set_ylim plot scatter hist boxplot imshow cmap alpha bins tick_params annotate quiver contour barh stackplot subplots_adjust axhline axvline semilogx semilogy loglog polar streamplot hexbin pcolor tricontour errorbar clabel set_aspect violinplot set_axis_off spines text hatch plt axis plt.bar() plt.axis import figure pyplot highlight_text pypalettes plt.subplots() xlabel ylabel title legend colorbar savefig tight_layout grid set_xlim set_ylim plot scatter hist boxplot imshow cmap alpha bins tick_params annotate quiver contour barh stackplot subplots_adjust axhline axvline semilogx semilogy loglog polar streamplot hexbin pcolor tricontour errorbar clabel set_aspect violinplot set_axis_off spines text hatch plt axis plt.bar() plt.axis import figure pyplot highlight_text pypalettes plt.subplots() xlabel ylabel title legend colorbar savefig tight_layout grid set_xlim set_ylim plot scatter hist boxplot imshow cmap alpha bins tick_params annotate quiver contour barh stackplot subplots_adjust axhline axvline semilogx semilogy loglog polar streamplot hexbin pcolor tricontour errorbar clabel set_aspect violinplot set_axis_off spines text hatch plt axis plt.bar() plt.axis import figure pyplot highlight_text pypalettes plt.subplots() xlabel ylabel title legend colorbar savefig tight_layout grid set_xlim set_ylim plot scatter hist boxplot imshow cmap alpha bins tick_params annotate quiver contour barh stackplot subplots_adjust axhline axvline semilogx semilogy loglog polar streamplot hexbin pcolor tricontour errorbar clabel set_aspect violinplot set_axis_off spines text hatch plt axis plt.bar() plt.axis import figure pyplot highlight_text pypalettes plt.subplots() xlabel ylabel title legend colorbar savefig tight_layout grid set_xlim set_ylim plot scatter hist boxplot imshow cmap alpha bins tick_params annotate quiver contour barh stackplot subplots_adjust axhline axvline semilogx semilogy loglog polar streamplot hexbin pcolor tricontour errorbar clabel set_aspect violinplot set_axis_off spines text hatch plt axis plt.bar() plt.axis import figure pyplot highlight_text pypalettes plt.subplots() xlabel ylabel title legend colorbar savefig tight_layout grid set_xlim set_ylim plot scatter hist boxplot imshow cmap alpha bins tick_params annotate quiver contour barh stackplot subplots_adjust axhline axvline semilogx semilogy loglog polar streamplot hexbin pcolor tricontour errorbar clabel set_aspect violinplot set_axis_off spines text hatch plt axis plt.bar() plt.axis import figure pyplot highlight_text pypalettes plt.subplots() xlabel ylabel title legend colorbar savefig tight_layout grid set_xlim set_ylim plot scatter hist boxplot imshow cmap alpha bins tick_params annotate quiver contour barh stackplot subplots_adjust axhline axvline semilogx semilogy loglog polar streamplot hexbin pcolor tricontour errorbar clabel set_aspect violinplot set_axis_off spines text hatch plt axis plt.bar() plt.axis import figure pyplot highlight_text pypalettes plt.subplots() xlabel ylabel title legend colorbar savefig tight_layout grid set_xlim set_ylim plot scatter hist boxplot imshow cmap alpha bins tick_params annotate quiver contour barh stackplot subplots_adjust axhline axvline semilogx semilogy loglog polar streamplot hexbin pcolor tricontour errorbar clabel set_aspect violinplot set_axis_off spines text hatch plt axis plt.bar() plt.axis import figure pyplot highlight_text pypalettes plt.subplots() xlabel ylabel title legend colorbar savefig tight_layout grid set_xlim set_ylim plot scatter hist boxplot imshow cmap alpha bins tick_params annotate quiver contour barh stackplot subplots_adjust axhline axvline semilogx semilogy loglog polar streamplot hexbin pcolor tricontour errorbar clabel set_aspect violinplot set_axis_off spines text hatch plt axis plt.bar() plt.axis import figure pyplot highlight_text pypalettes plt.subplots() xlabel ylabel title legend colorbar savefig tight_layout grid set_xlim set_ylim plot scatter hist boxplot imshow cmap alpha bins tick_params annotate quiver contour barh stackplot subplots_adjust axhline axvline semilogx semilogy loglog polar streamplot hexbin pcolor tricontour errorbar clabel set_aspect violinplot set_axis_off spines text hatch plt axis plt.bar() plt.axis import figure pyplot highlight_text pypalettes plt.subplots() xlabel ylabel title legend colorbar savefig tight_layout grid set_xlim set_ylim plot scatter hist boxplot imshow cmap alpha bins tick_params annotate quiver contour barh stackplot subplots_adjust axhline axvline semilogx semilogy loglog polar streamplot hexbin pcolor tricontour errorbar clabel set_aspect violinplot set_axis_off spines text hatch plt axis plt.bar() plt.axis import figure pyplot highlight_text pypalettes plt.subplots() xlabel ylabel title legend colorbar savefig tight_layout grid set_xlim set_ylim plot scatter hist boxplot imshow cmap alpha bins tick_params annotate quiver contour barh stackplot subplots_adjust axhline axvline semilogx semilogy loglog polar streamplot hexbin pcolor tricontour errorbar clabel set_aspect violinplot set_axis_off spines text hatch plt axis plt.bar() plt.axis import figure pyplot highlight_text pypalettes plt.subplots() xlabel ylabel title legend colorbar savefig tight_layout grid set_xlim set_ylim plot scatter hist boxplot imshow cmap alpha bins tick_params annotate quiver contour barh stackplot subplots_adjust axhline axvline semilogx semilogy loglog polar streamplot hexbin pcolor tricontour errorbar clabel set_aspect violinplot set_axis_off spines text hatch plt axis plt.bar() plt.axis import figure pyplot highlight_text pypalettes plt.subplots() xlabel ylabel title legend colorbar savefig tight_layout grid set_xlim set_ylim plot scatter hist boxplot imshow cmap alpha bins tick_params annotate quiver contour barh stackplot subplots_adjust axhline axvline semilogx semilogy loglog polar streamplot hexbin pcolor tricontour errorbar clabel set_aspect violinplot set_axis_off spines text hatch plt axis plt.bar() plt.axis import figure pyplot highlight_text pypalettes plt.subplots() xlabel ylabel title legend colorbar savefig tight_layout grid set_xlim set_ylim plot scatter hist boxplot imshow cmap alpha bins tick_params annotate quiver contour barh stackplot subplots_adjust axhline axvline semilogx semilogy loglog polar streamplot hexbin pcolor tricontour errorbar clabel set_aspect violinplot set_axis_off spines text hatch plt axis plt.bar() plt.axis import figure pyplot highlight_text pypalettes plt.subplots() xlabel ylabel title legend colorbar savefig tight_layout grid set_xlim set_ylim plot scatter hist boxplot imshow cmap alpha bins tick_params annotate quiver contour barh stackplot subplots_adjust axhline axvline semilogx semilogy loglog polar streamplot hexbin pcolor tricontour errorbar clabel set_aspect violinplot set_axis_off spines text hatch plt axis plt.bar() plt.axis import figure pyplot highlight_text pypalettes plt.subplots() xlabel ylabel title legend colorbar savefig tight_layout grid set_xlim set_ylim plot scatter hist boxplot imshow cmap alpha bins tick_params annotate quiver contour barh stackplot subplots_adjust axhline axvline semilogx semilogy loglog polar streamplot hexbin pcolor tricontour errorbar clabel set_aspect violinplot set_axis_off spines text hatch plt axis plt.bar() plt.axis import figure pyplot highlight_text pypalettes plt.subplots() xlabel ylabel title legend colorbar savefig tight_layout grid set_xlim set_ylim plot scatter hist boxplot imshow cmap alpha bins tick_params annotate quiver contour barh stackplot subplots_adjust axhline axvline semilogx semilogy loglog polar streamplot hexbin pcolor tricontour errorbar clabel set_aspect violinplot set_axis_off spines text hatch plt axis plt.bar() plt.axis import figure pyplot highlight_text pypalettes plt.subplots() xlabel ylabel title legend colorbar savefig tight_layout grid set_xlim set_ylim plot scatter hist boxplot imshow cmap alpha bins tick_params annotate quiver contour barh stackplot subplots_adjust axhline axvline semilogx semilogy loglog polar streamplot hexbin pcolor tricontour errorbar clabel set_aspect violinplot set_axis_off spines text hatch plt axis plt.bar() plt.axis import figure pyplot highlight_text pypalettes plt.subplots() xlabel ylabel title legend colorbar savefig tight_layout grid set_xlim set_ylim plot scatter hist boxplot imshow cmap alpha bins tick_params annotate quiver contour barh stackplot subplots_adjust axhline axvline semilogx semilogy loglog polar streamplot hexbin pcolor tricontour errorbar clabel set_aspect violinplot set_axis_off spines text hatch plt axis plt.bar() plt.axis import figure pyplot highlight_text pypalettes plt.subplots() xlabel ylabel title legend colorbar savefig tight_layout grid set_xlim set_ylim plot scatter hist boxplot imshow cmap alpha bins tick_params annotate quiver contour barh stackplot subplots_adjust axhline axvline semilogx semilogy loglog polar streamplot hexbin pcolor tricontour errorbar clabel set_aspect violinplot set_axis_off spines text hatch plt axis plt.bar() plt.axis import figure pyplot highlight_text pypalettes plt.subplots() xlabel ylabel title legend colorbar savefig tight_layout grid set_xlim set_ylim plot scatter hist boxplot imshow cmap alpha bins tick_params annotate quiver contour barh stackplot subplots_adjust axhline axvline semilogx semilogy loglog polar streamplot hexbin pcolor tricontour errorbar clabel set_aspect violinplot set_axis_off spines text hatch plt axis plt.bar() plt.axis import figure pyplot highlight_text pypalettes plt.subplots() xlabel ylabel title legend colorbar savefig tight_layout grid set_xlim set_ylim plot scatter hist boxplot imshow cmap alpha bins tick_params annotate quiver contour barh stackplot subplots_adjust axhline axvline semilogx semilogy loglog polar streamplot hexbin pcolor tricontour errorbar clabel set_aspect violinplot set_axis_off spines text hatch plt axis plt.bar() plt.axis import figure pyplot highlight_text pypalettes plt.subplots() xlabel ylabel title legend colorbar savefig tight_layout grid set_xlim set_ylim plot scatter hist boxplot imshow cmap alpha bins tick_params annotate quiver contour barh stackplot subplots_adjust axhline axvline semilogx semilogy loglog polar streamplot hexbin pcolor tricontour errorbar clabel set_aspect violinplot set_axis_off spines text hatch plt axis plt.bar() plt.axis import figure pyplot highlight_text pypalettes plt.subplots() xlabel ylabel title legend colorbar savefig tight_layout grid set_xlim set_ylim plot scatter hist boxplot imshow cmap alpha bins tick_params annotate quiver contour barh stackplot subplots_adjust axhline axvline semilogx semilogy loglog polar streamplot hexbin pcolor tricontour errorbar clabel set_aspect violinplot set_axis_off spines text hatch plt axis plt.bar() plt.axis import figure pyplot highlight_text pypalettes plt.subplots() xlabel ylabel title legend colorbar savefig tight_layout grid set_xlim set_ylim plot scatter hist boxplot imshow cmap alpha bins tick_params annotate quiver contour barh stackplot subplots_adjust axhline axvline semilogx semilogy loglog polar streamplot hexbin pcolor tricontour errorbar clabel set_aspect violinplot set_axis_off spines text hatch plt axis plt.bar() plt.axis import figure pyplot highlight_text pypalettes plt.subplots() xlabel ylabel title legend colorbar savefig tight_layout grid set_xlim set_ylim plot scatter hist boxplot imshow cmap alpha bins tick_params annotate quiver contour barh stackplot subplots_adjust axhline axvline semilogx semilogy loglog polar streamplot hexbin pcolor tricontour errorbar clabel set_aspect violinplot set_axis_off spines text hatch plt axis plt.bar() plt.axis import figure pyplot highlight_text pypalettes plt.subplots() xlabel ylabel title legend colorbar savefig tight_layout grid set_xlim set_ylim plot scatter hist boxplot imshow cmap alpha bins tick_params annotate quiver contour barh stackplot subplots_adjust axhline axvline semilogx semilogy loglog polar streamplot hexbin pcolor tricontour errorbar clabel set_aspect violinplot set_axis_off spines text hatch plt axis plt.bar() plt.axis import figure pyplot highlight_text pypalettes plt.subplots() xlabel ylabel title legend colorbar savefig tight_layout grid set_xlim set_ylim plot scatter hist boxplot imshow cmap alpha bins tick_params annotate quiver contour barh stackplot subplots_adjust axhline axvline semilogx semilogy loglog polar streamplot hexbin pcolor tricontour errorbar clabel set_aspect violinplot set_axis_off spines text hatch plt axis plt.bar() plt.axis import figure pyplot highlight_text pypalettes plt.subplots() xlabel ylabel title legend colorbar savefig tight_layout grid set_xlim set_ylim plot scatter hist boxplot imshow cmap alpha bins tick_params annotate quiver contour barh stackplot subplots_adjust axhline axvline semilogx semilogy loglog polar streamplot hexbin pcolor tricontour errorbar clabel set_aspect violinplot set_axis_off spines text hatch plt axis plt.bar() plt.axis import figure pyplot highlight_text pypalettes plt.subplots() xlabel ylabel title legend colorbar savefig tight_layout grid set_xlim set_ylim plot scatter hist boxplot imshow cmap alpha bins tick_params annotate quiver contour barh stackplot subplots_adjust axhline axvline semilogx semilogy loglog polar streamplot hexbin pcolor tricontour errorbar clabel set_aspect violinplot set_axis_off spines text hatch plt axis plt.bar() plt.axis import figure pyplot highlight_text pypalettes plt.subplots() xlabel ylabel title legend colorbar savefig tight_layout grid set_xlim set_ylim plot scatter hist boxplot imshow cmap alpha bins tick_params annotate quiver contour barh stackplot subplots_adjust axhline axvline semilogx semilogy loglog polar streamplot hexbin pcolor tricontour errorbar clabel set_aspect violinplot set_axis_off spines text hatch plt axis plt.bar() plt.axis import figure pyplot highlight_text pypalettes plt.subplots() xlabel ylabel title legend colorbar savefig tight_layout grid set_xlim set_ylim plot scatter hist boxplot imshow cmap alpha bins tick_params annotate quiver contour barh stackplot subplots_adjust axhline axvline semilogx semilogy loglog polar streamplot hexbin pcolor tricontour errorbar clabel set_aspect violinplot set_axis_off spines text hatch plt axis plt.bar() plt.axis import figure pyplot highlight_text pypalettes plt.subplots() xlabel ylabel title legend colorbar savefig tight_layout grid set_xlim set_ylim plot scatter hist boxplot imshow cmap alpha bins tick_params annotate quiver contour barh stackplot subplots_adjust axhline axvline semilogx semilogy loglog polar streamplot hexbin pcolor tricontour errorbar clabel set_aspect violinplot set_axis_off spines text hatch plt axis plt.bar() plt.axis import figure pyplot highlight_text pypalettes plt.subplots() xlabel ylabel title legend colorbar savefig tight_layout grid set_xlim set_ylim plot scatter hist boxplot imshow cmap alpha bins tick_params annotate quiver contour barh stackplot subplots_adjust axhline axvline semilogx semilogy loglog polar streamplot hexbin pcolor tricontour errorbar clabel set_aspect violinplot set_axis_off spines text hatch plt axis plt.bar() plt.axis import figure pyplot highlight_text pypalettes plt.subplots() xlabel ylabel title legend colorbar savefig tight_layout grid set_xlim set_ylim plot scatter hist boxplot imshow cmap alpha bins tick_params annotate quiver contour barh stackplot subplots_adjust axhline axvline semilogx semilogy loglog polar streamplot hexbin pcolor tricontour errorbar clabel set_aspect violinplot set_axis_off spines text hatch plt axis plt.bar() plt.axis import figure pyplot highlight_text pypalettes plt.subplots() xlabel ylabel title legend colorbar savefig tight_layout grid set_xlim set_ylim plot scatter hist boxplot imshow cmap alpha bins tick_params annotate quiver contour barh stackplot subplots_adjust axhline axvline semilogx semilogy loglog polar streamplot hexbin pcolor tricontour errorbar clabel set_aspect violinplot set_axis_off spines text hatch plt axis plt.bar() plt.axis import figure pyplot highlight_text pypalettes plt.subplots() xlabel ylabel title legend colorbar savefig tight_layout grid set_xlim set_ylim plot scatter hist boxplot imshow cmap alpha bins tick_params annotate quiver contour barh stackplot subplots_adjust axhline axvline semilogx semilogy loglog polar streamplot hexbin pcolor tricontour errorbar clabel set_aspect violinplot set_axis_off spines text hatch plt axis plt.bar() plt.axis import figure pyplot highlight_text pypalettes plt.subplots() xlabel ylabel title legend colorbar savefig tight_layout grid set_xlim set_ylim plot scatter hist boxplot imshow cmap alpha bins tick_params annotate quiver contour barh stackplot subplots_adjust axhline axvline semilogx semilogy loglog polar streamplot hexbin pcolor tricontour errorbar clabel set_aspect violinplot set_axis_off spines text hatch plt axis plt.bar() plt.axis import figure pyplot highlight_text pypalettes plt.subplots() xlabel ylabel title legend colorbar savefig tight_layout grid set_xlim set_ylim plot scatter hist boxplot imshow cmap alpha bins tick_params annotate quiver contour barh stackplot subplots_adjust axhline axvline semilogx semilogy loglog polar streamplot hexbin pcolor tricontour errorbar clabel set_aspect violinplot set_axis_off spines text hatch plt axis plt.bar() plt.axis import figure pyplot highlight_text pypalettes plt.subplots() xlabel ylabel title legend colorbar savefig tight_layout grid set_xlim set_ylim plot scatter hist boxplot imshow cmap alpha bins tick_params annotate quiver contour barh stackplot subplots_adjust axhline axvline semilogx semilogy loglog polar streamplot hexbin pcolor tricontour errorbar clabel set_aspect violinplot set_axis_off spines text hatch plt axis plt.bar() plt.axis import figure pyplot highlight_text pypalettes plt.subplots() xlabel ylabel title legend colorbar savefig tight_layout grid set_xlim set_ylim plot scatter hist boxplot imshow cmap alpha bins tick_params annotate quiver contour barh stackplot subplots_adjust axhline axvline semilogx semilogy loglog polar streamplot hexbin pcolor tricontour errorbar clabel set_aspect violinplot set_axis_off spines text hatch plt axis plt.bar() plt.axis import figure pyplot highlight_text pypalettes plt.subplots() xlabel ylabel title legend colorbar savefig tight_layout grid set_xlim set_ylim plot scatter hist boxplot imshow cmap alpha bins tick_params annotate quiver contour barh stackplot subplots_adjust axhline axvline semilogx semilogy loglog polar streamplot hexbin pcolor tricontour errorbar clabel set_aspect violinplot set_axis_off spines text hatch plt axis plt.bar() plt.axis import figure pyplot highlight_text pypalettes plt.subplots() xlabel ylabel title legend colorbar savefig tight_layout grid set_xlim set_ylim plot scatter hist boxplot imshow cmap alpha bins tick_params annotate quiver contour barh stackplot subplots_adjust axhline axvline semilogx semilogy loglog polar streamplot hexbin pcolor tricontour errorbar clabel set_aspect violinplot set_axis_off spines text hatch plt axis plt.bar() plt.axis import figure pyplot highlight_text pypalettes plt.subplots() xlabel ylabel title legend colorbar savefig tight_layout grid set_xlim set_ylim plot scatter hist boxplot imshow cmap alpha bins tick_params annotate quiver contour barh stackplot subplots_adjust axhline axvline semilogx semilogy loglog polar streamplot hexbin pcolor tricontour errorbar clabel set_aspect violinplot set_axis_off spines text hatch plt axis plt.bar() plt.axis import figure pyplot highlight_text pypalettes plt.subplots() xlabel ylabel title legend colorbar savefig tight_layout grid set_xlim set_ylim plot scatter hist boxplot imshow cmap alpha bins tick_params annotate quiver contour barh stackplot subplots_adjust axhline axvline semilogx semilogy loglog polar streamplot hexbin pcolor tricontour errorbar clabel set_aspect violinplot set_axis_off spines text hatch plt axis plt.bar() plt.axis import figure pyplot highlight_text pypalettes plt.subplots() xlabel ylabel title legend colorbar savefig tight_layout grid set_xlim set_ylim plot scatter hist boxplot imshow cmap alpha bins tick_params annotate quiver contour barh stackplot subplots_adjust axhline axvline semilogx semilogy loglog polar streamplot hexbin pcolor tricontour errorbar clabel set_aspect violinplot set_axis_off spines text hatch plt axis plt.bar() plt.axis import figure pyplot highlight_text pypalettes plt.subplots() xlabel ylabel title legend colorbar savefig tight_layout grid set_xlim set_ylim plot scatter hist boxplot imshow cmap alpha bins tick_params annotate quiver contour barh stackplot subplots_adjust axhline axvline semilogx semilogy loglog polar streamplot hexbin pcolor tricontour errorbar clabel set_aspect violinplot set_axis_off spines text hatch plt axis plt.bar() plt.axis import figure pyplot highlight_text pypalettes plt.subplots() xlabel ylabel title legend colorbar savefig tight_layout grid set_xlim set_ylim plot scatter hist boxplot imshow cmap alpha bins tick_params annotate quiver contour barh stackplot subplots_adjust axhline axvline semilogx semilogy loglog polar streamplot hexbin pcolor tricontour errorbar clabel set_aspect violinplot set_axis_off spines text hatch plt axis plt.bar() plt.axis import figure pyplot highlight_text pypalettes plt.subplots() xlabel ylabel title legend colorbar savefig tight_layout grid set_xlim set_ylim plot scatter hist boxplot imshow cmap alpha bins tick_params annotate quiver contour barh stackplot subplots_adjust axhline axvline semilogx semilogy loglog polar streamplot hexbin pcolor tricontour errorbar clabel set_aspect violinplot set_axis_off spines text hatch plt axis plt.bar() plt.axis import figure pyplot highlight_text pypalettes plt.subplots() xlabel ylabel title legend colorbar savefig tight_layout grid set_xlim set_ylim plot scatter hist boxplot imshow cmap alpha bins tick_params annotate quiver contour barh stackplot subplots_adjust axhline axvline semilogx semilogy loglog polar streamplot hexbin pcolor tricontour errorbar clabel set_aspect violinplot set_axis_off spines text hatch plt axis plt.bar() plt.axis import figure pyplot highlight_text pypalettes plt.subplots() xlabel ylabel title legend colorbar savefig tight_layout grid set_xlim set_ylim plot scatter hist boxplot imshow cmap alpha bins tick_params annotate quiver contour barh stackplot subplots_adjust axhline axvline semilogx semilogy loglog polar streamplot hexbin pcolor tricontour errorbar clabel set_aspect violinplot set_axis_off spines text hatch plt axis plt.bar() plt.axis import figure pyplot highlight_text pypalettes plt.subplots() xlabel ylabel title legend colorbar savefig tight_layout grid set_xlim set_ylim plot scatter hist boxplot imshow cmap alpha bins tick_params annotate quiver contour barh stackplot subplots_adjust axhline axvline semilogx semilogy loglog polar streamplot hexbin pcolor tricontour errorbar clabel set_aspect violinplot set_axis_off spines text hatch plt axis plt.bar() plt.axis import figure pyplot highlight_text pypalettes plt.subplots() xlabel ylabel title legend colorbar savefig tight_layout grid set_xlim set_ylim plot scatter hist boxplot imshow cmap alpha bins tick_params annotate quiver contour barh stackplot subplots_adjust axhline axvline semilogx semilogy loglog polar streamplot hexbin pcolor tricontour errorbar clabel set_aspect violinplot set_axis_off spines text hatch plt axis plt.bar() plt.axis import figure pyplot highlight_text pypalettes plt.subplots() xlabel ylabel title legend colorbar savefig tight_layout grid set_xlim set_ylim plot scatter hist boxplot imshow cmap alpha bins tick_params annotate quiver contour barh stackplot subplots_adjust axhline axvline semilogx semilogy loglog polar streamplot hexbin pcolor tricontour errorbar clabel set_aspect violinplot set_axis_off spines text hatch plt axis plt.bar() plt.axis import figure pyplot highlight_text pypalettes plt.subplots() xlabel ylabel title legend colorbar savefig tight_layout grid set_xlim set_ylim plot scatter hist boxplot imshow cmap alpha bins tick_params annotate quiver contour barh stackplot subplots_adjust axhline axvline semilogx semilogy loglog polar streamplot hexbin pcolor tricontour errorbar clabel set_aspect violinplot set_axis_off spines text hatch plt axis plt.bar() plt.axis import figure pyplot highlight_text pypalettes plt.subplots() xlabel ylabel title legend colorbar savefig tight_layout grid set_xlim set_ylim plot scatter hist boxplot imshow cmap alpha bins tick_params annotate quiver contour barh stackplot subplots_adjust axhline axvline semilogx semilogy loglog polar streamplot hexbin pcolor tricontour errorbar clabel set_aspect violinplot set_axis_off spines text hatch plt axis plt.bar() plt.axis import figure pyplot highlight_text pypalettes plt.subplots() xlabel ylabel title legend colorbar savefig tight_layout grid set_xlim set_ylim plot scatter hist boxplot imshow cmap alpha bins tick_params annotate quiver contour barh stackplot subplots_adjust axhline axvline semilogx semilogy loglog polar streamplot hexbin pcolor tricontour errorbar clabel set_aspect violinplot set_axis_off spines text hatch plt axis plt.bar() plt.axis import figure pyplot highlight_text pypalettes plt.subplots() xlabel ylabel title legend colorbar savefig tight_layout grid set_xlim set_ylim plot scatter hist boxplot imshow cmap alpha bins tick_params annotate quiver contour barh stackplot subplots_adjust axhline axvline semilogx semilogy loglog polar streamplot hexbin pcolor tricontour errorbar clabel set_aspect violinplot set_axis_off spines text hatch plt axis plt.bar() plt.axis import figure pyplot highlight_text pypalettes plt.subplots() xlabel ylabel title legend colorbar savefig tight_layout grid set_xlim set_ylim plot scatter hist boxplot imshow cmap alpha bins tick_params annotate quiver contour barh stackplot subplots_adjust axhline axvline semilogx semilogy loglog polar streamplot hexbin pcolor tricontour errorbar clabel set_aspect violinplot set_axis_off spines text hatch plt axis plt.bar() plt.axis import figure pyplot highlight_text pypalettes plt.subplots() xlabel ylabel title legend colorbar savefig tight_layout grid set_xlim set_ylim plot scatter hist boxplot imshow cmap alpha bins tick_params annotate quiver contour barh stackplot subplots_adjust axhline axvline semilogx semilogy loglog polar streamplot hexbin pcolor tricontour errorbar clabel set_aspect violinplot set_axis_off spines text hatch plt axis plt.bar() plt.axis import figure pyplot highlight_text pypalettes plt.subplots() xlabel ylabel title legend colorbar savefig tight_layout grid set_xlim set_ylim plot scatter hist boxplot imshow cmap alpha bins tick_params annotate quiver contour barh stackplot subplots_adjust axhline axvline semilogx semilogy loglog polar streamplot hexbin pcolor tricontour errorbar clabel set_aspect violinplot set_axis_off spines text hatch plt axis plt.bar() plt.axis import figure pyplot highlight_text pypalettes plt.subplots() xlabel ylabel title legend colorbar savefig tight_layout grid set_xlim set_ylim plot scatter hist boxplot imshow cmap alpha bins tick_params annotate quiver contour barh stackplot subplots_adjust axhline axvline semilogx semilogy loglog polar streamplot hexbin pcolor tricontour errorbar clabel set_aspect violinplot set_axis_off spines text hatch plt axis plt.bar() plt.axis import figure pyplot highlight_text pypalettes plt.subplots() xlabel ylabel title legend colorbar savefig tight_layout grid set_xlim set_ylim plot scatter hist boxplot imshow cmap alpha bins tick_params annotate quiver contour barh stackplot subplots_adjust axhline axvline semilogx semilogy loglog polar streamplot hexbin pcolor tricontour errorbar clabel set_aspect violinplot set_axis_off spines text hatch plt axis plt.bar() plt.axis import figure pyplot highlight_text pypalettes plt.subplots() xlabel ylabel title legend colorbar savefig tight_layout grid set_xlim set_ylim plot scatter hist boxplot imshow cmap alpha bins tick_params annotate quiver contour barh stackplot subplots_adjust axhline axvline semilogx semilogy loglog polar streamplot hexbin pcolor tricontour errorbar clabel set_aspect violinplot set_axis_off spines text hatch plt axis plt.bar() plt.axis import figure pyplot highlight_text pypalettes plt.subplots() xlabel ylabel title legend colorbar savefig tight_layout grid set_xlim set_ylim plot scatter hist boxplot imshow cmap alpha bins tick_params annotate quiver contour barh stackplot subplots_adjust axhline axvline semilogx semilogy loglog polar streamplot hexbin pcolor tricontour errorbar clabel set_aspect violinplot set_axis_off spines text hatch plt axis plt.bar() plt.axis import figure pyplot highlight_text pypalettes plt.subplots() xlabel ylabel title legend colorbar savefig tight_layout grid set_xlim set_ylim plot scatter hist boxplot imshow cmap alpha bins tick_params annotate quiver contour barh stackplot subplots_adjust axhline axvline semilogx semilogy loglog polar streamplot hexbin pcolor tricontour errorbar clabel set_aspect violinplot set_axis_off spines text hatch plt axis plt.bar() plt.axis import figure pyplot highlight_text pypalettes plt.subplots() xlabel ylabel title legend colorbar savefig tight_layout grid set_xlim set_ylim plot scatter hist boxplot imshow cmap alpha bins tick_params annotate quiver contour barh stackplot subplots_adjust axhline axvline semilogx semilogy loglog polar streamplot hexbin pcolor tricontour errorbar clabel set_aspect violinplot set_axis_off spines text hatch plt axis plt.bar() plt.axis import figure pyplot highlight_text pypalettes plt.subplots() xlabel ylabel title legend colorbar savefig tight_layout grid set_xlim set_ylim plot scatter hist boxplot imshow cmap alpha bins tick_params annotate quiver contour barh stackplot subplots_adjust axhline axvline semilogx semilogy loglog polar streamplot hexbin pcolor tricontour errorbar clabel set_aspect violinplot set_axis_off spines text hatch plt axis plt.bar() plt.axis import figure pyplot highlight_text pypalettes plt.subplots() xlabel ylabel title legend colorbar savefig tight_layout grid set_xlim set_ylim plot scatter hist boxplot imshow cmap alpha bins tick_params annotate quiver contour barh stackplot subplots_adjust axhline axvline semilogx semilogy loglog polar streamplot hexbin pcolor tricontour errorbar clabel set_aspect violinplot set_axis_off spines text hatch plt axis plt.bar() plt.axis import figure pyplot highlight_text pypalettes plt.subplots() xlabel ylabel title legend colorbar savefig tight_layout grid set_xlim set_ylim plot scatter hist boxplot imshow cmap alpha bins tick_params annotate quiver contour barh stackplot subplots_adjust axhline axvline semilogx semilogy loglog polar streamplot hexbin pcolor tricontour errorbar clabel set_aspect violinplot set_axis_off spines text hatch plt axis plt.bar() plt.axis import figure pyplot highlight_text pypalettes plt.subplots() xlabel ylabel title legend colorbar savefig tight_layout grid set_xlim set_ylim plot scatter hist boxplot imshow cmap alpha bins tick_params annotate quiver contour barh stackplot subplots_adjust axhline axvline semilogx semilogy loglog polar streamplot hexbin pcolor tricontour errorbar clabel set_aspect violinplot set_axis_off spines text hatch plt axis plt.bar() plt.axis import figure pyplot highlight_text pypalettes plt.subplots() xlabel ylabel title legend colorbar savefig tight_layout grid set_xlim set_ylim plot scatter hist boxplot imshow cmap alpha bins tick_params annotate quiver contour barh stackplot subplots_adjust axhline axvline semilogx semilogy loglog polar streamplot hexbin pcolor tricontour errorbar clabel set_aspect violinplot set_axis_off spines text hatch plt axis plt.bar() plt.axis import figure pyplot highlight_text pypalettes plt.subplots() xlabel ylabel title legend colorbar savefig tight_layout grid set_xlim set_ylim plot scatter hist boxplot imshow cmap alpha bins tick_params annotate quiver contour barh stackplot subplots_adjust axhline axvline semilogx semilogy loglog polar streamplot hexbin pcolor tricontour errorbar clabel set_aspect violinplot set_axis_off spines text hatch plt axis plt.bar() plt.axis import figure pyplot highlight_text pypalettes plt.subplots() xlabel ylabel title legend colorbar savefig tight_layout grid set_xlim set_ylim plot scatter hist boxplot imshow cmap alpha bins tick_params annotate quiver contour barh stackplot subplots_adjust axhline axvline semilogx semilogy loglog polar streamplot hexbin pcolor tricontour errorbar clabel set_aspect violinplot set_axis_off spines text hatch plt axis plt.bar() plt.axis import figure pyplot highlight_text pypalettes plt.subplots() xlabel ylabel title legend colorbar savefig tight_layout grid set_xlim set_ylim plot scatter hist boxplot imshow cmap alpha bins tick_params annotate quiver contour barh stackplot subplots_adjust axhline axvline semilogx semilogy loglog polar streamplot hexbin pcolor tricontour errorbar clabel set_aspect violinplot set_axis_off spines text hatch plt axis plt.bar() plt.axis import figure pyplot highlight_text pypalettes plt.subplots() xlabel ylabel title legend colorbar savefig tight_layout grid set_xlim set_ylim plot scatter hist boxplot imshow cmap alpha bins tick_params annotate quiver contour barh stackplot subplots_adjust axhline axvline semilogx semilogy loglog polar streamplot hexbin pcolor tricontour errorbar clabel set_aspect violinplot set_axis_off spines text hatch plt axis plt.bar() plt.axis import figure pyplot highlight_text pypalettes plt.subplots() xlabel ylabel title legend colorbar savefig tight_layout grid set_xlim set_ylim plot scatter hist boxplot imshow cmap alpha bins tick_params annotate quiver contour barh stackplot subplots_adjust axhline axvline semilogx semilogy loglog polar streamplot hexbin pcolor tricontour errorbar clabel set_aspect violinplot set_axis_off spines text hatch plt axis plt.bar() plt.axis import figure pyplot highlight_text pypalettes plt.subplots() xlabel ylabel title legend colorbar savefig tight_layout grid set_xlim set_ylim plot scatter hist boxplot imshow cmap alpha bins tick_params annotate quiver contour barh stackplot subplots_adjust axhline axvline semilogx semilogy loglog polar streamplot hexbin pcolor tricontour errorbar clabel set_aspect violinplot set_axis_off spines text hatch plt axis plt.bar() plt.axis import figure pyplot highlight_text pypalettes plt.subplots() xlabel ylabel title legend colorbar savefig tight_layout grid set_xlim set_ylim plot scatter hist boxplot imshow cmap alpha bins tick_params annotate quiver contour barh stackplot subplots_adjust axhline axvline semilogx semilogy loglog polar streamplot hexbin pcolor tricontour errorbar clabel set_aspect violinplot set_axis_off spines text hatch plt axis plt.bar() plt.axis import figure pyplot highlight_text pypalettes plt.subplots() xlabel ylabel title legend colorbar savefig tight_layout grid set_xlim set_ylim plot scatter hist boxplot imshow cmap alpha bins tick_params annotate quiver contour barh stackplot subplots_adjust axhline axvline semilogx semilogy loglog polar streamplot hexbin pcolor tricontour errorbar clabel set_aspect violinplot set_axis_off spines text hatch plt axis plt.bar() plt.axis import figure pyplot highlight_text pypalettes plt.subplots() xlabel ylabel title legend colorbar savefig tight_layout grid set_xlim set_ylim plot scatter hist boxplot imshow cmap alpha bins tick_params annotate quiver contour barh stackplot subplots_adjust axhline axvline semilogx semilogy loglog polar streamplot hexbin pcolor tricontour errorbar clabel set_aspect violinplot set_axis_off spines text hatch plt axis plt.bar() plt.axis import figure pyplot highlight_text pypalettes plt.subplots() xlabel ylabel title legend colorbar savefig tight_layout grid set_xlim set_ylim plot scatter hist boxplot imshow cmap alpha bins tick_params annotate quiver contour barh stackplot subplots_adjust axhline axvline semilogx semilogy loglog polar streamplot hexbin pcolor tricontour errorbar clabel set_aspect violinplot set_axis_off spines text hatch plt axis plt.bar() plt.axis import figure pyplot highlight_text pypalettes plt.subplots() xlabel ylabel title legend colorbar savefig tight_layout grid set_xlim set_ylim plot scatter hist boxplot imshow cmap alpha bins tick_params annotate quiver contour barh stackplot subplots_adjust axhline axvline semilogx semilogy loglog polar streamplot hexbin pcolor tricontour errorbar clabel set_aspect violinplot set_axis_off spines text hatch plt axis plt.bar() plt.axis import figure pyplot highlight_text pypalettes plt.subplots() xlabel ylabel title legend colorbar savefig tight_layout grid set_xlim set_ylim plot scatter hist boxplot imshow cmap alpha bins tick_params annotate quiver contour barh stackplot subplots_adjust axhline axvline semilogx semilogy loglog polar streamplot hexbin pcolor tricontour errorbar clabel set_aspect violinplot set_axis_off spines text hatch plt axis plt.bar() plt.axis import figure pyplot highlight_text pypalettes plt.subplots() xlabel ylabel title legend colorbar savefig tight_layout grid set_xlim set_ylim plot scatter hist boxplot imshow cmap alpha bins tick_params annotate quiver contour barh stackplot subplots_adjust axhline axvline semilogx semilogy loglog polar streamplot hexbin pcolor tricontour errorbar clabel set_aspect violinplot set_axis_off spines text hatch plt axis plt.bar() plt.axis import figure pyplot highlight_text pypalettes plt.subplots() xlabel ylabel title legend colorbar savefig tight_layout grid set_xlim set_ylim plot scatter hist boxplot imshow cmap alpha bins tick_params annotate quiver contour barh stackplot subplots_adjust axhline axvline semilogx semilogy loglog polar streamplot hexbin pcolor tricontour errorbar clabel set_aspect violinplot set_axis_off spines text hatch plt axis plt.bar() plt.axis import figure pyplot highlight_text pypalettes plt.subplots() xlabel ylabel title legend colorbar savefig tight_layout grid set_xlim set_ylim plot scatter hist boxplot imshow cmap alpha bins tick_params annotate quiver contour barh stackplot subplots_adjust axhline axvline semilogx semilogy loglog polar streamplot hexbin pcolor tricontour errorbar clabel set_aspect violinplot set_axis_off spines text hatch plt axis plt.bar() plt.axis import figure pyplot highlight_text pypalettes plt.subplots() xlabel ylabel title legend colorbar savefig tight_layout grid set_xlim set_ylim plot scatter hist boxplot imshow cmap alpha bins tick_params annotate quiver contour barh stackplot subplots_adjust axhline axvline semilogx semilogy loglog polar streamplot hexbin pcolor tricontour errorbar clabel set_aspect violinplot set_axis_off spines text hatch plt axis plt.bar() plt.axis import figure pyplot highlight_text pypalettes plt.subplots() xlabel ylabel title legend colorbar savefig tight_layout grid set_xlim set_ylim plot scatter hist boxplot imshow cmap alpha bins tick_params annotate quiver contour barh stackplot subplots_adjust axhline axvline semilogx semilogy loglog polar streamplot hexbin pcolor tricontour errorbar clabel set_aspect violinplot set_axis_off spines text hatch plt axis plt.bar() plt.axis import figure pyplot highlight_text pypalettes plt.subplots() xlabel ylabel title legend colorbar savefig tight_layout grid set_xlim set_ylim plot scatter hist boxplot imshow cmap alpha bins tick_params annotate quiver contour barh stackplot subplots_adjust axhline axvline semilogx semilogy loglog polar streamplot hexbin pcolor tricontour errorbar clabel set_aspect violinplot set_axis_off spines text hatch plt axis plt.bar() plt.axis import figure pyplot highlight_text pypalettes plt.subplots() xlabel ylabel title legend colorbar savefig tight_layout grid set_xlim set_ylim plot scatter hist boxplot imshow cmap alpha bins tick_params annotate quiver contour barh stackplot subplots_adjust axhline axvline semilogx semilogy loglog polar streamplot hexbin pcolor tricontour errorbar clabel set_aspect violinplot set_axis_off spines text hatch plt axis plt.bar() plt.axis import figure pyplot highlight_text pypalettes plt.subplots() xlabel ylabel title legend colorbar savefig tight_layout grid set_xlim set_ylim plot scatter hist boxplot imshow cmap alpha bins tick_params annotate quiver contour barh stackplot subplots_adjust axhline axvline semilogx semilogy loglog polar streamplot hexbin pcolor tricontour errorbar clabel set_aspect violinplot set_axis_off spines text hatch plt axis plt.bar() plt.axis import figure pyplot highlight_text pypalettes plt.subplots() xlabel ylabel title legend colorbar savefig tight_layout grid set_xlim set_ylim plot scatter hist boxplot imshow cmap alpha bins tick_params annotate quiver contour barh stackplot subplots_adjust axhline axvline semilogx semilogy loglog polar streamplot hexbin pcolor tricontour errorbar clabel set_aspect violinplot set_axis_off spines text hatch plt axis plt.bar() plt.axis import figure pyplot highlight_text pypalettes plt.subplots() xlabel ylabel title legend colorbar savefig tight_layout grid set_xlim set_ylim plot scatter hist boxplot imshow cmap alpha bins tick_params annotate quiver contour barh stackplot subplots_adjust axhline axvline semilogx semilogy loglog polar streamplot hexbin pcolor tricontour errorbar clabel set_aspect violinplot set_axis_off spines text hatch plt axis plt.bar() plt.axis import figure pyplot highlight_text pypalettes plt.subplots() xlabel ylabel title legend colorbar savefig tight_layout grid set_xlim set_ylim plot scatter hist boxplot imshow cmap alpha bins tick_params annotate quiver contour barh stackplot subplots_adjust axhline axvline semilogx semilogy loglog polar streamplot hexbin pcolor tricontour errorbar clabel set_aspect violinplot set_axis_off spines text hatch plt axis plt.bar() plt.axis import figure pyplot highlight_text pypalettes plt.subplots() xlabel ylabel title legend colorbar savefig tight_layout grid set_xlim set_ylim plot scatter hist boxplot imshow cmap alpha bins tick_params annotate quiver contour barh stackplot subplots_adjust axhline axvline semilogx semilogy loglog polar streamplot hexbin pcolor tricontour errorbar clabel set_aspect violinplot set_axis_off spines text hatch plt axis plt.bar() plt.axis import figure pyplot highlight_text pypalettes plt.subplots() xlabel ylabel title legend colorbar savefig tight_layout grid set_xlim set_ylim plot scatter hist boxplot imshow cmap alpha bins tick_params annotate quiver contour barh stackplot subplots_adjust axhline axvline semilogx semilogy loglog polar streamplot hexbin pcolor tricontour errorbar clabel set_aspect violinplot set_axis_off spines text hatch plt axis plt.bar() plt.axis import figure pyplot highlight_text pypalettes plt.subplots() xlabel ylabel title legend colorbar savefig tight_layout grid set_xlim set_ylim plot scatter hist boxplot imshow cmap alpha bins tick_params annotate quiver contour barh stackplot subplots_adjust axhline axvline semilogx semilogy loglog polar streamplot hexbin pcolor tricontour errorbar clabel set_aspect violinplot set_axis_off spines text hatch plt axis plt.bar() plt.axis import figure pyplot highlight_text pypalettes plt.subplots() xlabel ylabel title legend colorbar savefig tight_layout grid set_xlim set_ylim plot scatter hist boxplot imshow cmap alpha bins tick_params annotate quiver contour barh stackplot subplots_adjust axhline axvline semilogx semilogy loglog polar streamplot hexbin pcolor tricontour errorbar clabel set_aspect violinplot set_axis_off spines text hatch plt axis plt.bar() plt.axis import figure pyplot highlight_text pypalettes plt.subplots() xlabel ylabel title legend colorbar savefig tight_layout grid set_xlim set_ylim plot scatter hist boxplot imshow cmap alpha bins tick_params annotate quiver contour barh stackplot subplots_adjust axhline axvline semilogx semilogy loglog polar streamplot hexbin pcolor tricontour errorbar clabel set_aspect violinplot set_axis_off spines text hatch plt axis plt.bar() plt.axis import figure pyplot highlight_text pypalettes plt.subplots() xlabel ylabel title legend colorbar savefig tight_layout grid set_xlim set_ylim plot scatter hist boxplot imshow cmap alpha bins tick_params annotate quiver contour barh stackplot subplots_adjust axhline axvline semilogx semilogy loglog polar streamplot hexbin pcolor tricontour errorbar clabel set_aspect violinplot set_axis_off spines text hatch plt axis plt.bar() plt.axis import figure pyplot highlight_text pypalettes plt.subplots() xlabel ylabel title legend colorbar savefig tight_layout grid set_xlim set_ylim plot scatter hist boxplot imshow cmap alpha bins tick_params annotate quiver contour barh stackplot subplots_adjust axhline axvline semilogx semilogy loglog polar streamplot hexbin pcolor tricontour errorbar clabel set_aspect violinplot set_axis_off spines text hatch plt axis plt.bar() plt.axis import figure pyplot highlight_text pypalettes plt.subplots() xlabel ylabel title legend colorbar savefig tight_layout grid set_xlim set_ylim plot scatter hist boxplot imshow cmap alpha bins tick_params annotate quiver contour barh stackplot subplots_adjust axhline axvline semilogx semilogy loglog polar streamplot hexbin pcolor tricontour errorbar clabel set_aspect violinplot set_axis_off spines text hatch plt axis plt.bar() plt.axis import figure pyplot highlight_text pypalettes plt.subplots() xlabel ylabel title legend colorbar savefig tight_layout grid set_xlim set_ylim plot scatter hist boxplot imshow cmap alpha bins tick_params annotate quiver contour barh stackplot subplots_adjust axhline axvline semilogx semilogy loglog polar streamplot hexbin pcolor tricontour errorbar clabel set_aspect violinplot set_axis_off spines text hatch plt axis plt.bar() plt.axis import figure pyplot highlight_text pypalettes plt.subplots() xlabel ylabel title legend colorbar savefig tight_layout grid set_xlim set_ylim plot scatter hist boxplot imshow cmap alpha bins tick_params annotate quiver contour barh stackplot subplots_adjust axhline axvline semilogx semilogy loglog polar streamplot hexbin pcolor tricontour errorbar clabel set_aspect violinplot set_axis_off spines text hatch plt axis plt.bar() plt.axis import figure pyplot highlight_text pypalettes plt.subplots() xlabel ylabel title legend colorbar savefig tight_layout grid set_xlim set_ylim plot scatter hist boxplot imshow cmap alpha bins tick_params annotate quiver contour barh stackplot subplots_adjust axhline axvline semilogx semilogy loglog polar streamplot hexbin pcolor tricontour errorbar clabel set_aspect violinplot set_axis_off spines text hatch plt axis plt.bar() plt.axis import figure pyplot highlight_text pypalettes plt.subplots() xlabel ylabel title legend colorbar savefig tight_layout grid set_xlim set_ylim plot scatter hist boxplot imshow cmap alpha bins tick_params annotate quiver contour barh stackplot subplots_adjust axhline axvline semilogx semilogy loglog polar streamplot hexbin pcolor tricontour errorbar clabel set_aspect violinplot set_axis_off spines text hatch plt axis plt.bar() plt.axis import figure pyplot highlight_text pypalettes plt.subplots() xlabel ylabel title legend colorbar savefig tight_layout grid set_xlim set_ylim plot scatter hist boxplot imshow cmap alpha bins tick_params annotate quiver contour barh stackplot subplots_adjust axhline axvline semilogx semilogy loglog polar streamplot hexbin pcolor tricontour errorbar clabel set_aspect violinplot set_axis_off spines text hatch plt axis plt.bar() plt.axis import figure pyplot highlight_text pypalettes plt.subplots() xlabel ylabel title legend colorbar savefig tight_layout grid set_xlim set_ylim plot scatter hist boxplot imshow cmap alpha bins tick_params annotate quiver contour barh stackplot subplots_adjust axhline axvline semilogx semilogy loglog polar streamplot hexbin pcolor tricontour errorbar clabel set_aspect violinplot set_axis_off spines text hatch plt axis plt.bar() plt.axis import figure pyplot highlight_text pypalettes plt.subplots() xlabel ylabel title legend colorbar savefig tight_layout grid set_xlim set_ylim plot scatter hist boxplot imshow cmap alpha bins tick_params annotate quiver contour barh stackplot subplots_adjust axhline axvline semilogx semilogy loglog polar streamplot hexbin pcolor tricontour errorbar clabel set_aspect violinplot set_axis_off spines text hatch plt axis plt.bar() plt.axis import figure pyplot highlight_text pypalettes plt.subplots() xlabel ylabel title legend colorbar savefig tight_layout grid set_xlim set_ylim plot scatter hist boxplot imshow cmap alpha bins tick_params annotate quiver contour barh stackplot subplots_adjust axhline axvline semilogx semilogy loglog polar streamplot hexbin pcolor tricontour errorbar clabel set_aspect violinplot set_axis_off spines text hatch plt axis plt.bar() plt.axis import figure pyplot highlight_text pypalettes plt.subplots() xlabel ylabel title legend colorbar savefig tight_layout grid set_xlim set_ylim plot scatter hist boxplot imshow cmap alpha bins tick_params annotate quiver contour barh stackplot subplots_adjust axhline axvline semilogx semilogy loglog polar streamplot hexbin pcolor tricontour errorbar clabel set_aspect violinplot set_axis_off spines text hatch plt axis plt.bar() plt.axis import figure pyplot highlight_text pypalettes plt.subplots() xlabel ylabel title legend colorbar savefig tight_layout grid set_xlim set_ylim plot scatter hist boxplot imshow cmap alpha bins tick_params annotate quiver contour barh stackplot subplots_adjust axhline axvline semilogx semilogy loglog polar streamplot hexbin pcolor tricontour errorbar clabel set_aspect violinplot set_axis_off spines text hatch plt axis plt.bar() plt.axis import figure pyplot highlight_text pypalettes plt.subplots() xlabel ylabel title legend colorbar savefig tight_layout grid set_xlim set_ylim plot scatter hist boxplot imshow cmap alpha bins tick_params annotate quiver contour barh stackplot subplots_adjust axhline axvline semilogx semilogy loglog polar streamplot hexbin pcolor tricontour errorbar clabel set_aspect violinplot set_axis_off spines text hatch plt axis plt.bar() plt.axis import figure pyplot highlight_text pypalettes plt.subplots() xlabel ylabel title legend colorbar savefig tight_layout grid set_xlim set_ylim plot scatter hist boxplot imshow cmap alpha bins tick_params annotate quiver contour barh stackplot subplots_adjust axhline axvline semilogx semilogy loglog polar streamplot hexbin pcolor tricontour errorbar clabel set_aspect violinplot set_axis_off spines text hatch plt axis plt.bar() plt.axis import figure pyplot highlight_text pypalettes plt.subplots() xlabel ylabel title legend colorbar savefig tight_layout grid set_xlim set_ylim plot scatter hist boxplot imshow cmap alpha bins tick_params annotate quiver contour barh stackplot subplots_adjust axhline axvline semilogx semilogy loglog polar streamplot hexbin pcolor tricontour errorbar clabel set_aspect violinplot set_axis_off spines text hatch plt axis plt.bar() plt.axis import figure pyplot highlight_text pypalettes plt.subplots() xlabel ylabel title legend colorbar savefig tight_layout grid set_xlim set_ylim plot scatter hist boxplot imshow cmap alpha bins tick_params annotate quiver contour barh stackplot subplots_adjust axhline axvline semilogx semilogy loglog polar streamplot hexbin pcolor tricontour errorbar clabel set_aspect violinplot set_axis_off spines text hatch plt axis plt.bar() plt.axis import figure pyplot highlight_text pypalettes plt.subplots() xlabel ylabel title legend colorbar savefig tight_layout grid set_xlim set_ylim plot scatter hist boxplot imshow cmap alpha bins tick_params annotate quiver contour barh stackplot subplots_adjust axhline axvline semilogx semilogy loglog polar streamplot hexbin pcolor tricontour errorbar clabel set_aspect violinplot set_axis_off spines text hatch plt axis plt.bar() plt.axis import figure pyplot highlight_text pypalettes plt.subplots() xlabel ylabel title legend colorbar savefig tight_layout grid set_xlim set_ylim plot scatter hist boxplot imshow cmap alpha bins tick_params annotate quiver contour barh stackplot subplots_adjust axhline axvline semilogx semilogy loglog polar streamplot hexbin pcolor tricontour errorbar clabel set_aspect violinplot set_axis_off spines text hatch plt axis plt.bar() plt.axis import figure pyplot highlight_text pypalettes plt.subplots() xlabel ylabel title legend colorbar savefig tight_layout grid set_xlim set_ylim plot scatter hist boxplot imshow cmap alpha bins tick_params annotate quiver contour barh stackplot subplots_adjust axhline axvline semilogx semilogy loglog polar streamplot hexbin pcolor tricontour errorbar clabel set_aspect violinplot set_axis_off spines text hatch plt axis plt.bar() plt.axis import figure pyplot highlight_text pypalettes plt.subplots() xlabel ylabel title legend colorbar savefig tight_layout grid set_xlim set_ylim plot scatter hist boxplot imshow cmap alpha bins tick_params annotate quiver contour barh stackplot subplots_adjust axhline axvline semilogx semilogy loglog polar streamplot hexbin pcolor tricontour errorbar clabel set_aspect violinplot set_axis_off spines text hatch plt axis plt.bar() plt.axis import figure pyplot highlight_text pypalettes plt.subplots() xlabel ylabel title legend colorbar savefig tight_layout grid set_xlim set_ylim plot scatter hist boxplot imshow cmap alpha bins tick_params annotate quiver contour barh stackplot subplots_adjust axhline axvline semilogx semilogy loglog polar streamplot hexbin pcolor tricontour errorbar clabel set_aspect violinplot set_axis_off spines text hatch plt axis plt.bar() plt.axis import figure pyplot highlight_text pypalettes plt.subplots() xlabel ylabel title legend colorbar savefig tight_layout grid set_xlim set_ylim plot scatter hist boxplot imshow cmap alpha bins tick_params annotate quiver contour barh stackplot subplots_adjust axhline axvline semilogx semilogy loglog polar streamplot hexbin pcolor tricontour errorbar clabel set_aspect violinplot set_axis_off spines text hatch plt axis plt.bar() plt.axis import figure pyplot highlight_text pypalettes plt.subplots() xlabel ylabel title legend colorbar savefig tight_layout grid set_xlim set_ylim plot scatter hist boxplot imshow cmap alpha bins tick_params annotate quiver contour barh stackplot subplots_adjust axhline axvline semilogx semilogy loglog polar streamplot hexbin pcolor tricontour errorbar clabel set_aspect violinplot set_axis_off spines text hatch plt axis plt.bar() plt.axis import figure pyplot highlight_text pypalettes plt.subplots() xlabel ylabel title legend colorbar savefig tight_layout grid set_xlim set_ylim plot scatter hist boxplot imshow cmap alpha bins tick_params annotate quiver contour barh stackplot subplots_adjust axhline axvline semilogx semilogy loglog polar streamplot hexbin pcolor tricontour errorbar clabel set_aspect violinplot set_axis_off spines text hatch plt axis plt.bar() plt.axis import figure pyplot highlight_text pypalettes plt.subplots() xlabel ylabel title legend colorbar savefig tight_layout grid set_xlim set_ylim plot scatter hist boxplot imshow cmap alpha bins tick_params annotate quiver contour barh stackplot subplots_adjust axhline axvline semilogx semilogy loglog polar streamplot hexbin pcolor tricontour errorbar clabel set_aspect violinplot set_axis_off spines text hatch plt axis plt.bar() plt.axis import figure pyplot highlight_text pypalettes plt.subplots() xlabel ylabel title legend colorbar savefig tight_layout grid set_xlim set_ylim plot scatter hist boxplot imshow cmap alpha bins tick_params annotate quiver contour barh stackplot subplots_adjust axhline axvline semilogx semilogy loglog polar streamplot hexbin pcolor tricontour errorbar clabel set_aspect violinplot set_axis_off spines text hatch plt axis plt.bar() plt.axis import figure pyplot highlight_text pypalettes plt.subplots() xlabel ylabel title legend colorbar savefig tight_layout grid set_xlim set_ylim plot scatter hist boxplot imshow cmap alpha bins tick_params annotate quiver contour barh stackplot subplots_adjust axhline axvline semilogx semilogy loglog polar streamplot hexbin pcolor tricontour errorbar clabel set_aspect violinplot set_axis_off spines text hatch plt axis plt.bar() plt.axis import figure pyplot highlight_text pypalettes plt.subplots() xlabel ylabel title legend colorbar savefig tight_layout grid set_xlim set_ylim plot scatter hist boxplot imshow cmap alpha bins tick_params annotate quiver contour barh stackplot subplots_adjust axhline axvline semilogx semilogy loglog polar streamplot hexbin pcolor tricontour errorbar clabel set_aspect violinplot set_axis_off spines text hatch plt axis plt.bar() plt.axis import figure pyplot highlight_text pypalettes plt.subplots() xlabel ylabel title legend colorbar savefig tight_layout grid set_xlim set_ylim plot scatter hist boxplot imshow cmap alpha bins tick_params annotate quiver contour barh stackplot subplots_adjust axhline axvline semilogx semilogy loglog polar streamplot hexbin pcolor tricontour errorbar clabel set_aspect violinplot set_axis_off spines text hatch plt axis plt.bar() plt.axis import figure pyplot highlight_text pypalettes plt.subplots() xlabel ylabel title legend colorbar savefig tight_layout grid set_xlim set_ylim plot scatter hist boxplot imshow cmap alpha bins tick_params annotate quiver contour barh stackplot subplots_adjust axhline axvline semilogx semilogy loglog polar streamplot hexbin pcolor tricontour errorbar clabel set_aspect violinplot set_axis_off spines text hatch plt axis plt.bar() plt.axis import figure pyplot highlight_text pypalettes plt.subplots() xlabel ylabel title legend colorbar savefig tight_layout grid set_xlim set_ylim plot scatter hist boxplot imshow cmap alpha bins tick_params annotate quiver contour barh stackplot subplots_adjust axhline axvline semilogx semilogy loglog polar streamplot hexbin pcolor tricontour errorbar clabel set_aspect violinplot set_axis_off spines text hatch plt axis plt.bar() plt.axis import figure pyplot highlight_text pypalettes plt.subplots() xlabel ylabel title legend colorbar savefig tight_layout grid set_xlim set_ylim plot scatter hist boxplot imshow cmap alpha bins tick_params annotate quiver contour barh stackplot subplots_adjust axhline axvline semilogx semilogy loglog polar streamplot hexbin pcolor tricontour errorbar clabel set_aspect violinplot set_axis_off spines text hatch plt axis plt.bar() plt.axis import figure pyplot highlight_text pypalettes plt.subplots() xlabel ylabel title legend colorbar savefig tight_layout grid set_xlim set_ylim plot scatter hist boxplot imshow cmap alpha bins tick_params annotate quiver contour barh stackplot subplots_adjust axhline axvline semilogx semilogy loglog polar streamplot hexbin pcolor tricontour errorbar clabel set_aspect violinplot set_axis_off spines text hatch plt axis plt.bar() plt.axis import figure pyplot highlight_text pypalettes plt.subplots() xlabel ylabel title legend colorbar savefig tight_layout grid set_xlim set_ylim plot scatter hist boxplot imshow cmap alpha bins tick_params annotate quiver contour barh stackplot subplots_adjust axhline axvline semilogx semilogy loglog polar streamplot hexbin pcolor tricontour errorbar clabel set_aspect violinplot set_axis_off spines text hatch plt axis plt.bar() plt.axis import figure pyplot highlight_text pypalettes plt.subplots() xlabel ylabel title legend colorbar savefig tight_layout grid set_xlim set_ylim plot scatter hist boxplot imshow cmap alpha bins tick_params annotate quiver contour barh stackplot subplots_adjust axhline axvline semilogx semilogy loglog polar streamplot hexbin pcolor tricontour errorbar clabel set_aspect violinplot set_axis_off spines text hatch plt axis plt.bar() plt.axis import figure pyplot highlight_text pypalettes plt.subplots() xlabel ylabel title legend colorbar savefig tight_layout grid set_xlim set_ylim plot scatter hist boxplot imshow cmap alpha bins tick_params annotate quiver contour barh stackplot subplots_adjust axhline axvline semilogx semilogy loglog polar streamplot hexbin pcolor tricontour errorbar clabel set_aspect violinplot set_axis_off spines text hatch plt axis plt.bar() plt.axis import figure pyplot highlight_text pypalettes plt.subplots() xlabel ylabel title legend colorbar savefig tight_layout grid set_xlim set_ylim plot scatter hist boxplot imshow cmap alpha bins tick_params annotate quiver contour barh stackplot subplots_adjust axhline axvline semilogx semilogy loglog polar streamplot hexbin pcolor tricontour errorbar clabel set_aspect violinplot set_axis_off spines text hatch plt axis plt.bar() plt.axis import figure pyplot highlight_text pypalettes plt.subplots() xlabel ylabel title legend colorbar savefig tight_layout grid set_xlim set_ylim plot scatter hist boxplot imshow cmap alpha bins tick_params annotate quiver contour barh stackplot subplots_adjust axhline axvline semilogx semilogy loglog polar streamplot hexbin pcolor tricontour errorbar clabel set_aspect violinplot set_axis_off spines text hatch plt axis plt.bar() plt.axis import figure pyplot highlight_text pypalettes plt.subplots() xlabel ylabel title legend colorbar savefig tight_layout grid set_xlim set_ylim plot scatter hist boxplot imshow cmap alpha bins tick_params annotate quiver contour barh stackplot subplots_adjust axhline axvline semilogx semilogy loglog polar streamplot hexbin pcolor tricontour errorbar clabel set_aspect violinplot set_axis_off spines text hatch plt axis plt.bar() plt.axis import figure pyplot highlight_text pypalettes plt.subplots() xlabel ylabel title legend colorbar savefig tight_layout grid set_xlim set_ylim plot scatter hist boxplot imshow cmap alpha bins tick_params annotate quiver contour barh stackplot subplots_adjust axhline axvline semilogx semilogy loglog polar streamplot hexbin pcolor tricontour errorbar clabel set_aspect violinplot set_axis_off spines text hatch plt axis plt.bar() plt.axis import figure pyplot highlight_text pypalettes plt.subplots() xlabel ylabel title legend colorbar savefig tight_layout grid set_xlim set_ylim plot scatter hist boxplot imshow cmap alpha bins tick_params annotate quiver contour barh stackplot subplots_adjust axhline axvline semilogx semilogy loglog polar streamplot hexbin pcolor tricontour errorbar clabel set_aspect violinplot set_axis_off spines text hatch plt axis plt.bar() plt.axis import figure pyplot highlight_text pypalettes plt.subplots() xlabel ylabel title legend colorbar savefig tight_layout grid set_xlim set_ylim plot scatter hist boxplot imshow cmap alpha bins tick_params annotate quiver contour barh stackplot subplots_adjust axhline axvline semilogx semilogy loglog polar streamplot hexbin pcolor tricontour errorbar clabel set_aspect violinplot set_axis_off spines text hatch plt axis plt.bar() plt.axis import figure pyplot highlight_text pypalettes plt.subplots() xlabel ylabel title legend colorbar savefig tight_layout grid set_xlim set_ylim plot scatter hist boxplot imshow cmap alpha bins tick_params annotate quiver contour barh stackplot subplots_adjust axhline axvline semilogx semilogy loglog polar streamplot hexbin pcolor tricontour errorbar clabel set_aspect violinplot set_axis_off spines text hatch plt axis plt.bar() plt.axis import figure pyplot highlight_text pypalettes plt.subplots() xlabel ylabel title legend colorbar savefig tight_layout grid set_xlim set_ylim plot scatter hist boxplot imshow cmap alpha bins tick_params annotate quiver contour barh stackplot subplots_adjust axhline axvline semilogx semilogy loglog polar streamplot hexbin pcolor tricontour errorbar clabel set_aspect violinplot set_axis_off spines text hatch plt axis plt.bar() plt.axis import figure pyplot highlight_text pypalettes plt.subplots() xlabel ylabel title legend colorbar savefig tight_layout grid set_xlim set_ylim plot scatter hist boxplot imshow cmap alpha bins tick_params annotate quiver contour barh stackplot subplots_adjust axhline axvline semilogx semilogy loglog polar streamplot hexbin pcolor tricontour errorbar clabel set_aspect violinplot set_axis_off spines text hatch plt axis plt.bar() plt.axis import figure pyplot highlight_text pypalettes plt.subplots() xlabel ylabel title legend colorbar savefig tight_layout grid set_xlim set_ylim plot scatter hist boxplot imshow cmap alpha bins tick_params annotate quiver contour barh stackplot subplots_adjust axhline axvline semilogx semilogy loglog polar streamplot hexbin pcolor tricontour errorbar clabel set_aspect violinplot set_axis_off spines text hatch plt axis plt.bar() plt.axis import figure pyplot highlight_text pypalettes plt.subplots() xlabel ylabel title legend colorbar savefig tight_layout grid set_xlim set_ylim plot scatter hist boxplot imshow cmap alpha bins tick_params annotate quiver contour barh stackplot subplots_adjust axhline axvline semilogx semilogy loglog polar streamplot hexbin pcolor tricontour errorbar clabel set_aspect violinplot set_axis_off spines text hatch plt axis plt.bar() plt.axis import figure pyplot highlight_text pypalettes plt.subplots() xlabel ylabel title legend colorbar savefig tight_layout grid set_xlim set_ylim plot scatter hist boxplot imshow cmap alpha bins tick_params annotate quiver contour barh stackplot subplots_adjust axhline axvline semilogx semilogy loglog polar streamplot hexbin pcolor tricontour errorbar clabel set_aspect violinplot set_axis_off spines text hatch plt axis plt.bar() plt.axis import figure pyplot highlight_text pypalettes plt.subplots() xlabel ylabel title legend colorbar savefig tight_layout grid set_xlim set_ylim plot scatter hist boxplot imshow cmap alpha bins tick_params annotate quiver contour barh stackplot subplots_adjust axhline axvline semilogx semilogy loglog polar streamplot hexbin pcolor tricontour errorbar clabel set_aspect violinplot set_axis_off spines text hatch plt axis plt.bar() plt.axis import figure pyplot highlight_text pypalettes plt.subplots() xlabel ylabel title legend colorbar savefig tight_layout grid set_xlim set_ylim plot scatter hist boxplot imshow cmap alpha bins tick_params annotate quiver contour barh stackplot subplots_adjust axhline axvline semilogx semilogy loglog polar streamplot hexbin pcolor tricontour errorbar clabel set_aspect violinplot set_axis_off spines text hatch plt axis plt.bar() plt.axis import figure pyplot highlight_text pypalettes plt.subplots() xlabel ylabel title legend colorbar savefig tight_layout grid set_xlim set_ylim plot scatter hist boxplot imshow cmap alpha bins tick_params annotate quiver contour barh stackplot subplots_adjust axhline axvline semilogx semilogy loglog polar streamplot hexbin pcolor tricontour errorbar clabel set_aspect violinplot set_axis_off spines text hatch plt axis plt.bar() plt.axis import figure pyplot highlight_text pypalettes plt.subplots() xlabel ylabel title legend colorbar savefig tight_layout grid set_xlim set_ylim plot scatter hist boxplot imshow cmap alpha bins tick_params annotate quiver contour barh stackplot subplots_adjust axhline axvline semilogx semilogy loglog polar streamplot hexbin pcolor tricontour errorbar clabel set_aspect violinplot set_axis_off spines text hatch plt axis plt.bar() plt.axis import figure pyplot highlight_text pypalettes plt.subplots() xlabel ylabel title legend colorbar savefig tight_layout grid set_xlim set_ylim plot scatter hist boxplot imshow cmap alpha bins tick_params annotate quiver contour barh stackplot subplots_adjust axhline axvline semilogx semilogy loglog polar streamplot hexbin pcolor tricontour errorbar clabel set_aspect violinplot set_axis_off spines text hatch plt axis plt.bar() plt.axis import figure pyplot highlight_text pypalettes plt.subplots() xlabel ylabel title legend colorbar savefig tight_layout grid set_xlim set_ylim plot scatter hist boxplot imshow cmap alpha bins tick_params annotate quiver contour barh stackplot subplots_adjust axhline axvline semilogx semilogy loglog polar streamplot hexbin pcolor tricontour errorbar clabel set_aspect violinplot set_axis_off spines text hatch plt axis plt.bar() plt.axis import figure pyplot highlight_text pypalettes plt.subplots() xlabel ylabel title legend colorbar savefig tight_layout grid set_xlim set_ylim plot scatter hist boxplot imshow cmap alpha bins tick_params annotate quiver contour barh stackplot subplots_adjust axhline axvline semilogx semilogy loglog polar streamplot hexbin pcolor tricontour errorbar clabel set_aspect violinplot set_axis_off spines text hatch plt axis plt.bar() plt.axis import figure pyplot highlight_text pypalettes plt.subplots() xlabel ylabel title legend colorbar savefig tight_layout grid set_xlim set_ylim plot scatter hist boxplot imshow cmap alpha bins tick_params annotate quiver contour barh stackplot subplots_adjust axhline axvline semilogx semilogy loglog polar streamplot hexbin pcolor tricontour errorbar clabel set_aspect violinplot set_axis_off spines text hatch plt axis plt.bar() plt.axis import figure pyplot highlight_text pypalettes plt.subplots() xlabel ylabel title legend colorbar savefig tight_layout grid set_xlim set_ylim plot scatter hist boxplot imshow cmap alpha bins tick_params annotate quiver contour barh stackplot subplots_adjust axhline axvline semilogx semilogy loglog polar streamplot hexbin pcolor tricontour errorbar clabel set_aspect violinplot set_axis_off spines text hatch plt axis plt.bar() plt.axis import figure pyplot highlight_text pypalettes plt.subplots() xlabel ylabel title legend colorbar savefig tight_layout grid set_xlim set_ylim plot scatter hist boxplot imshow cmap alpha bins tick_params annotate quiver contour barh stackplot subplots_adjust axhline axvline semilogx semilogy loglog polar streamplot hexbin pcolor tricontour errorbar clabel set_aspect violinplot set_axis_off spines text hatch plt axis plt.bar() plt.axis import figure pyplot highlight_text pypalettes plt.subplots() xlabel ylabel title legend colorbar savefig tight_layout grid set_xlim set_ylim plot scatter hist boxplot imshow cmap alpha bins tick_params annotate quiver contour barh stackplot subplots_adjust axhline axvline semilogx semilogy loglog polar streamplot hexbin pcolor tricontour errorbar clabel set_aspect violinplot set_axis_off spines text hatch plt axis plt.bar() plt.axis import figure pyplot highlight_text pypalettes plt.subplots() xlabel ylabel title legend colorbar savefig tight_layout grid set_xlim set_ylim plot scatter hist boxplot imshow cmap alpha bins tick_params annotate quiver contour barh stackplot subplots_adjust axhline axvline semilogx semilogy loglog polar streamplot hexbin pcolor tricontour errorbar clabel set_aspect violinplot set_axis_off spines text hatch plt axis plt.bar() plt.axis import figure pyplot highlight_text pypalettes plt.subplots() xlabel ylabel title legend colorbar savefig tight_layout grid set_xlim set_ylim plot scatter hist boxplot imshow cmap alpha bins tick_params annotate quiver contour barh stackplot subplots_adjust axhline axvline semilogx semilogy loglog polar streamplot hexbin pcolor tricontour errorbar clabel set_aspect violinplot set_axis_off spines text hatch plt axis plt.bar() plt.axis import figure pyplot highlight_text pypalettes plt.subplots() xlabel ylabel title legend colorbar savefig tight_layout grid set_xlim set_ylim plot scatter hist boxplot imshow cmap alpha bins tick_params annotate quiver contour barh stackplot subplots_adjust axhline axvline semilogx semilogy loglog polar streamplot hexbin pcolor tricontour errorbar clabel set_aspect violinplot set_axis_off spines text hatch plt axis plt.bar() plt.axis import figure pyplot highlight_text pypalettes plt.subplots() xlabel ylabel title legend colorbar savefig tight_layout grid set_xlim set_ylim plot scatter hist boxplot imshow cmap alpha bins tick_params annotate quiver contour barh stackplot subplots_adjust axhline axvline semilogx semilogy loglog polar streamplot hexbin pcolor tricontour errorbar clabel set_aspect violinplot set_axis_off spines text hatch plt axis plt.bar() plt.axis import figure pyplot highlight_text pypalettes plt.subplots() xlabel ylabel title legend colorbar savefig tight_layout grid set_xlim set_ylim plot scatter hist boxplot imshow cmap alpha bins tick_params annotate quiver contour barh stackplot subplots_adjust axhline axvline semilogx semilogy loglog polar streamplot hexbin pcolor tricontour errorbar clabel set_aspect violinplot set_axis_off spines text hatch plt axis plt.bar() plt.axis import figure pyplot highlight_text pypalettes plt.subplots() xlabel ylabel title legend colorbar savefig tight_layout grid set_xlim set_ylim plot scatter hist boxplot imshow cmap alpha bins tick_params annotate quiver contour barh stackplot subplots_adjust axhline axvline semilogx semilogy loglog polar streamplot hexbin pcolor tricontour errorbar clabel set_aspect violinplot set_axis_off spines text hatch plt axis plt.bar() plt.axis import figure pyplot highlight_text pypalettes plt.subplots() xlabel ylabel title legend colorbar savefig tight_layout grid set_xlim set_ylim plot scatter hist boxplot imshow cmap alpha bins tick_params annotate quiver contour barh stackplot subplots_adjust axhline axvline semilogx semilogy loglog polar streamplot hexbin pcolor tricontour errorbar clabel set_aspect violinplot set_axis_off spines text hatch plt axis plt.bar() plt.axis import figure pyplot highlight_text pypalettes plt.subplots() xlabel ylabel title legend colorbar savefig tight_layout grid set_xlim set_ylim plot scatter hist boxplot imshow cmap alpha bins tick_params annotate quiver contour barh stackplot subplots_adjust axhline axvline semilogx semilogy loglog polar streamplot hexbin pcolor tricontour errorbar clabel set_aspect violinplot set_axis_off spines text hatch plt axis plt.bar() plt.axis import figure pyplot highlight_text pypalettes plt.subplots() xlabel ylabel title legend colorbar savefig tight_layout grid set_xlim set_ylim plot scatter hist boxplot imshow cmap alpha bins tick_params annotate quiver contour barh stackplot subplots_adjust axhline axvline semilogx semilogy loglog polar streamplot hexbin pcolor tricontour errorbar clabel set_aspect violinplot set_axis_off spines text hatch plt axis plt.bar() plt.axis import figure pyplot highlight_text pypalettes plt.subplots() xlabel ylabel title legend colorbar savefig tight_layout grid set_xlim set_ylim plot scatter hist boxplot imshow cmap alpha bins tick_params annotate quiver contour barh stackplot subplots_adjust axhline axvline semilogx semilogy loglog polar streamplot hexbin pcolor tricontour errorbar clabel set_aspect violinplot set_axis_off spines text hatch plt axis plt.bar() plt.axis import figure pyplot highlight_text pypalettes plt.subplots() xlabel ylabel title legend colorbar savefig tight_layout grid set_xlim set_ylim plot scatter hist boxplot imshow cmap alpha bins tick_params annotate quiver contour barh stackplot subplots_adjust axhline axvline semilogx semilogy loglog polar streamplot hexbin pcolor tricontour errorbar clabel set_aspect violinplot set_axis_off spines text hatch plt axis plt.bar() plt.axis import figure pyplot highlight_text pypalettes plt.subplots() xlabel ylabel title legend colorbar savefig tight_layout grid set_xlim set_ylim plot scatter hist boxplot imshow cmap alpha bins tick_params annotate quiver contour barh stackplot subplots_adjust axhline axvline semilogx semilogy loglog polar streamplot hexbin pcolor tricontour errorbar clabel set_aspect violinplot set_axis_off spines text hatch plt axis plt.bar() plt.axis import figure pyplot highlight_text pypalettes plt.subplots() xlabel ylabel title legend colorbar savefig tight_layout grid set_xlim set_ylim plot scatter hist boxplot imshow cmap alpha bins tick_params annotate quiver contour barh stackplot subplots_adjust axhline axvline semilogx semilogy loglog polar streamplot hexbin pcolor tricontour errorbar clabel set_aspect violinplot set_axis_off spines text hatch plt axis plt.bar() plt.axis import figure pyplot highlight_text pypalettes plt.subplots() xlabel ylabel title legend colorbar savefig tight_layout grid set_xlim set_ylim plot scatter hist boxplot imshow cmap alpha bins tick_params annotate quiver contour barh stackplot subplots_adjust axhline axvline semilogx semilogy loglog polar streamplot hexbin pcolor tricontour errorbar clabel set_aspect violinplot set_axis_off spines text hatch plt axis plt.bar() plt.axis import figure pyplot highlight_text pypalettes plt.subplots() xlabel ylabel title legend colorbar savefig tight_layout grid set_xlim set_ylim plot scatter hist boxplot imshow cmap alpha bins tick_params annotate quiver contour barh stackplot subplots_adjust axhline axvline semilogx semilogy loglog polar streamplot hexbin pcolor tricontour errorbar clabel set_aspect violinplot set_axis_off spines text hatch plt axis plt.bar() plt.axis import figure pyplot highlight_text pypalettes plt.subplots() xlabel ylabel title legend colorbar savefig tight_layout grid set_xlim set_ylim plot scatter hist boxplot imshow cmap alpha bins tick_params annotate quiver contour barh stackplot subplots_adjust axhline axvline semilogx semilogy loglog polar streamplot hexbin pcolor tricontour errorbar clabel set_aspect violinplot set_axis_off spines text hatch plt axis plt.bar() plt.axis import figure pyplot highlight_text pypalettes plt.subplots() xlabel ylabel title legend colorbar savefig tight_layout grid set_xlim set_ylim plot scatter hist boxplot imshow cmap alpha bins tick_params annotate quiver contour barh stackplot subplots_adjust axhline axvline semilogx semilogy loglog polar streamplot hexbin pcolor tricontour errorbar clabel set_aspect violinplot set_axis_off spines text hatch plt axis plt.bar() plt.axis import figure pyplot highlight_text pypalettes plt.subplots() xlabel ylabel title legend colorbar savefig tight_layout grid set_xlim set_ylim plot scatter hist boxplot imshow cmap alpha bins tick_params annotate quiver contour barh stackplot subplots_adjust axhline axvline semilogx semilogy loglog polar streamplot hexbin pcolor tricontour errorbar clabel set_aspect violinplot set_axis_off spines text hatch plt axis plt.bar() plt.axis import figure pyplot highlight_text pypalettes plt.subplots() xlabel ylabel title legend colorbar savefig tight_layout grid set_xlim set_ylim plot scatter hist boxplot imshow cmap alpha bins tick_params annotate quiver contour barh stackplot subplots_adjust axhline axvline semilogx semilogy loglog polar streamplot hexbin pcolor tricontour errorbar clabel set_aspect violinplot set_axis_off spines text hatch plt axis plt.bar() plt.axis import figure pyplot highlight_text pypalettes plt.subplots() xlabel ylabel title legend colorbar savefig tight_layout grid set_xlim set_ylim plot scatter hist boxplot imshow cmap alpha bins tick_params annotate quiver contour barh stackplot subplots_adjust axhline axvline semilogx semilogy loglog polar streamplot hexbin pcolor tricontour errorbar clabel set_aspect violinplot set_axis_off spines text hatch plt axis plt.bar() plt.axis import figure pyplot highlight_text pypalettes plt.subplots() xlabel ylabel title legend colorbar savefig tight_layout grid set_xlim set_ylim plot scatter hist boxplot imshow cmap alpha bins tick_params annotate quiver contour barh stackplot subplots_adjust axhline axvline semilogx semilogy loglog polar streamplot hexbin pcolor tricontour errorbar clabel set_aspect violinplot set_axis_off spines text hatch plt axis plt.bar() plt.axis import figure pyplot highlight_text pypalettes plt.subplots() xlabel ylabel title legend colorbar savefig tight_layout grid set_xlim set_ylim plot scatter hist boxplot imshow cmap alpha bins tick_params annotate quiver contour barh stackplot subplots_adjust axhline axvline semilogx semilogy loglog polar streamplot hexbin pcolor tricontour errorbar clabel set_aspect violinplot set_axis_off spines text hatch plt axis plt.bar() plt.axis import figure pyplot highlight_text pypalettes plt.subplots() xlabel ylabel title legend colorbar savefig tight_layout grid set_xlim set_ylim plot scatter hist boxplot imshow cmap alpha bins tick_params annotate quiver contour barh stackplot subplots_adjust axhline axvline semilogx semilogy loglog polar streamplot hexbin pcolor tricontour errorbar clabel set_aspect violinplot set_axis_off spines text hatch plt axis plt.bar() plt.axis import figure pyplot highlight_text pypalettes plt.subplots() xlabel ylabel title legend colorbar savefig tight_layout grid set_xlim set_ylim plot scatter hist boxplot imshow cmap alpha bins tick_params annotate quiver contour barh stackplot subplots_adjust axhline axvline semilogx semilogy loglog polar streamplot hexbin pcolor tricontour errorbar clabel set_aspect violinplot set_axis_off spines text hatch plt axis plt.bar() plt.axis import figure pyplot highlight_text pypalettes plt.subplots() xlabel ylabel title legend colorbar savefig tight_layout grid set_xlim set_ylim plot scatter hist boxplot imshow cmap alpha bins tick_params annotate quiver contour barh stackplot subplots_adjust axhline axvline semilogx semilogy loglog polar streamplot hexbin pcolor tricontour errorbar clabel set_aspect violinplot set_axis_off spines text hatch plt axis plt.bar() plt.axis import figure pyplot highlight_text pypalettes plt.subplots() xlabel ylabel title legend colorbar savefig tight_layout grid set_xlim set_ylim plot scatter hist boxplot imshow cmap alpha bins tick_params annotate quiver contour barh stackplot subplots_adjust axhline axvline semilogx semilogy loglog polar streamplot hexbin pcolor tricontour errorbar clabel set_aspect violinplot set_axis_off spines text hatch plt axis plt.bar() plt.axis import figure pyplot highlight_text pypalettes plt.subplots() xlabel ylabel title legend colorbar savefig tight_layout grid set_xlim set_ylim plot scatter hist boxplot imshow cmap alpha bins tick_params annotate quiver contour barh stackplot subplots_adjust axhline axvline semilogx semilogy loglog polar streamplot hexbin pcolor tricontour errorbar clabel set_aspect violinplot set_axis_off spines text hatch plt axis plt.bar() plt.axis import figure pyplot highlight_text pypalettes plt.subplots() xlabel ylabel title legend colorbar savefig tight_layout grid set_xlim set_ylim plot scatter hist boxplot imshow cmap alpha bins tick_params annotate quiver contour barh stackplot subplots_adjust axhline axvline semilogx semilogy loglog polar streamplot hexbin pcolor tricontour errorbar clabel set_aspect violinplot set_axis_off spines text hatch plt axis plt.bar() plt.axis import figure pyplot highlight_text pypalettes plt.subplots() xlabel ylabel title legend colorbar savefig tight_layout grid set_xlim set_ylim plot scatter hist boxplot imshow cmap alpha bins tick_params annotate quiver contour barh stackplot subplots_adjust axhline axvline semilogx semilogy loglog polar streamplot hexbin pcolor tricontour errorbar clabel set_aspect violinplot set_axis_off spines text hatch plt axis plt.bar() plt.axis import figure pyplot highlight_text pypalettes plt.subplots() xlabel ylabel title legend colorbar savefig tight_layout grid set_xlim set_ylim plot scatter hist boxplot imshow cmap alpha bins tick_params annotate quiver contour barh stackplot subplots_adjust axhline axvline semilogx semilogy loglog polar streamplot hexbin pcolor tricontour errorbar clabel set_aspect violinplot set_axis_off spines text hatch plt axis plt.bar() plt.axis import figure pyplot highlight_text pypalettes plt.subplots() xlabel ylabel title legend colorbar savefig tight_layout grid set_xlim set_ylim plot scatter hist boxplot imshow cmap alpha bins tick_params annotate quiver contour barh stackplot subplots_adjust axhline axvline semilogx semilogy loglog polar streamplot hexbin pcolor tricontour errorbar clabel set_aspect violinplot set_axis_off spines text hatch plt axis plt.bar() plt.axis import figure pyplot highlight_text pypalettes plt.subplots() xlabel ylabel title legend colorbar savefig tight_layout grid set_xlim set_ylim plot scatter hist boxplot imshow cmap alpha bins tick_params annotate quiver contour barh stackplot subplots_adjust axhline axvline semilogx semilogy loglog polar streamplot hexbin pcolor tricontour errorbar clabel set_aspect violinplot set_axis_off spines text hatch plt axis plt.bar() plt.axis import figure pyplot highlight_text pypalettes plt.subplots() xlabel ylabel title legend colorbar savefig tight_layout grid set_xlim set_ylim plot scatter hist boxplot imshow cmap alpha bins tick_params annotate quiver contour barh stackplot subplots_adjust axhline axvline semilogx semilogy loglog polar streamplot hexbin pcolor tricontour errorbar clabel set_aspect violinplot set_axis_off spines text hatch plt axis plt.bar() plt.axis import figure pyplot highlight_text pypalettes plt.subplots() xlabel ylabel title legend colorbar savefig tight_layout grid set_xlim set_ylim plot scatter hist boxplot imshow cmap alpha bins tick_params annotate quiver contour barh stackplot subplots_adjust axhline axvline semilogx semilogy loglog polar streamplot hexbin pcolor tricontour errorbar clabel set_aspect violinplot set_axis_off spines text hatch plt axis plt.bar() plt.axis import figure pyplot highlight_text pypalettes plt.subplots() xlabel ylabel title legend colorbar savefig tight_layout grid set_xlim set_ylim plot scatter hist boxplot imshow cmap alpha bins tick_params annotate quiver contour barh stackplot subplots_adjust axhline axvline semilogx semilogy loglog polar streamplot hexbin pcolor tricontour errorbar clabel set_aspect violinplot set_axis_off spines text hatch plt axis plt.bar() plt.axis import figure pyplot highlight_text pypalettes plt.subplots() xlabel ylabel title legend colorbar savefig tight_layout grid set_xlim set_ylim plot scatter hist boxplot imshow cmap alpha bins tick_params annotate quiver contour barh stackplot subplots_adjust axhline axvline semilogx semilogy loglog polar streamplot hexbin pcolor tricontour errorbar clabel set_aspect violinplot set_axis_off spines text hatch plt axis plt.bar() plt.axis import figure pyplot highlight_text pypalettes plt.subplots() xlabel ylabel title legend colorbar savefig tight_layout grid set_xlim set_ylim plot scatter hist boxplot imshow cmap alpha bins tick_params annotate quiver contour barh stackplot subplots_adjust axhline axvline semilogx semilogy loglog polar streamplot hexbin pcolor tricontour errorbar clabel set_aspect violinplot set_axis_off spines text hatch plt axis plt.bar() plt.axis import figure pyplot highlight_text pypalettes plt.subplots() xlabel ylabel title legend colorbar savefig tight_layout grid set_xlim set_ylim plot scatter hist boxplot imshow cmap alpha bins tick_params annotate quiver contour barh stackplot subplots_adjust axhline axvline semilogx semilogy loglog polar streamplot hexbin pcolor tricontour errorbar clabel set_aspect violinplot set_axis_off spines text hatch plt axis plt.bar() plt.axis import figure pyplot highlight_text pypalettes plt.subplots() xlabel ylabel title legend colorbar savefig tight_layout grid set_xlim set_ylim plot scatter hist boxplot imshow cmap alpha bins tick_params annotate quiver contour barh stackplot subplots_adjust axhline axvline semilogx semilogy loglog polar streamplot hexbin pcolor tricontour errorbar clabel set_aspect violinplot set_axis_off spines text hatch plt axis plt.bar() plt.axis import figure pyplot highlight_text pypalettes plt.subplots() xlabel ylabel title legend colorbar savefig tight_layout grid set_xlim set_ylim plot scatter hist boxplot imshow cmap alpha bins tick_params annotate quiver contour barh stackplot subplots_adjust axhline axvline semilogx semilogy loglog polar streamplot hexbin pcolor tricontour errorbar clabel set_aspect violinplot set_axis_off spines text hatch plt axis plt.bar() plt.axis import figure pyplot highlight_text pypalettes plt.subplots() xlabel ylabel title legend colorbar savefig tight_layout grid set_xlim set_ylim plot scatter hist boxplot imshow cmap alpha bins tick_params annotate quiver contour barh stackplot subplots_adjust axhline axvline semilogx semilogy loglog polar streamplot hexbin pcolor tricontour errorbar clabel set_aspect violinplot set_axis_off spines text hatch plt axis plt.bar() plt.axis import figure pyplot highlight_text pypalettes plt.subplots() xlabel ylabel title legend colorbar savefig tight_layout grid set_xlim set_ylim plot scatter hist boxplot imshow cmap alpha bins tick_params annotate quiver contour barh stackplot subplots_adjust axhline axvline semilogx semilogy loglog polar streamplot hexbin pcolor tricontour errorbar clabel set_aspect violinplot set_axis_off spines text hatch plt axis plt.bar() plt.axis import figure pyplot highlight_text pypalettes plt.subplots() xlabel ylabel title legend colorbar savefig tight_layout grid set_xlim set_ylim plot scatter hist boxplot imshow cmap alpha bins tick_params annotate quiver contour barh stackplot subplots_adjust axhline axvline semilogx semilogy loglog polar streamplot hexbin pcolor tricontour errorbar clabel set_aspect violinplot set_axis_off spines text hatch plt axis plt.bar() plt.axis import figure pyplot highlight_text pypalettes plt.subplots() xlabel ylabel title legend colorbar savefig tight_layout grid set_xlim set_ylim plot scatter hist boxplot imshow cmap alpha bins tick_params annotate quiver contour barh stackplot subplots_adjust axhline axvline semilogx semilogy loglog polar streamplot hexbin pcolor tricontour errorbar clabel set_aspect violinplot set_axis_off spines text hatch plt axis plt.bar() plt.axis import figure pyplot highlight_text pypalettes plt.subplots() xlabel ylabel title legend colorbar savefig tight_layout grid set_xlim set_ylim plot scatter hist boxplot imshow cmap alpha bins tick_params annotate quiver contour barh stackplot subplots_adjust axhline axvline semilogx semilogy loglog polar streamplot hexbin pcolor tricontour errorbar clabel set_aspect violinplot set_axis_off spines text hatch plt axis plt.bar() plt.axis import figure pyplot highlight_text pypalettes plt.subplots() xlabel ylabel title legend colorbar savefig tight_layout grid set_xlim set_ylim plot scatter hist boxplot imshow cmap alpha bins tick_params annotate quiver contour barh stackplot subplots_adjust axhline axvline semilogx semilogy loglog polar streamplot hexbin pcolor tricontour errorbar clabel set_aspect violinplot set_axis_off spines text hatch plt axis plt.bar() plt.axis import figure pyplot highlight_text pypalettes plt.subplots() xlabel ylabel title legend colorbar savefig tight_layout grid set_xlim set_ylim plot scatter hist boxplot imshow cmap alpha bins tick_params annotate quiver contour barh stackplot subplots_adjust axhline axvline semilogx semilogy loglog polar streamplot hexbin pcolor tricontour errorbar clabel set_aspect violinplot set_axis_off spines text hatch plt axis plt.bar() plt.axis import figure pyplot highlight_text pypalettes plt.subplots() xlabel ylabel title legend colorbar savefig tight_layout grid set_xlim set_ylim plot scatter hist boxplot imshow cmap alpha bins tick_params annotate quiver contour barh stackplot subplots_adjust axhline axvline semilogx semilogy loglog polar streamplot hexbin pcolor tricontour errorbar clabel set_aspect violinplot set_axis_off spines text hatch plt axis plt.bar() plt.axis import figure pyplot highlight_text pypalettes plt.subplots() xlabel ylabel title legend colorbar savefig tight_layout grid set_xlim set_ylim plot scatter hist boxplot imshow cmap alpha bins tick_params annotate quiver contour barh stackplot subplots_adjust axhline axvline semilogx semilogy loglog polar streamplot hexbin pcolor tricontour errorbar clabel set_aspect violinplot set_axis_off spines text hatch plt axis plt.bar() plt.axis import figure pyplot highlight_text pypalettes plt.subplots() xlabel ylabel title legend colorbar savefig tight_layout grid set_xlim set_ylim plot scatter hist boxplot imshow cmap alpha bins tick_params annotate quiver contour barh stackplot subplots_adjust axhline axvline semilogx semilogy loglog polar streamplot hexbin pcolor tricontour errorbar clabel set_aspect violinplot set_axis_off spines text hatch plt axis plt.bar() plt.axis import figure pyplot highlight_text pypalettes plt.subplots() xlabel ylabel title legend colorbar savefig tight_layout grid set_xlim set_ylim plot scatter hist boxplot imshow cmap alpha bins tick_params annotate quiver contour barh stackplot subplots_adjust axhline axvline semilogx semilogy loglog polar streamplot hexbin pcolor tricontour errorbar clabel set_aspect violinplot set_axis_off spines text hatch plt axis plt.bar() plt.axis import figure pyplot highlight_text pypalettes plt.subplots() xlabel ylabel title legend colorbar savefig tight_layout grid set_xlim set_ylim plot scatter hist boxplot imshow cmap alpha bins tick_params annotate quiver contour barh stackplot subplots_adjust axhline axvline semilogx semilogy loglog polar streamplot hexbin pcolor tricontour errorbar clabel set_aspect violinplot set_axis_off spines text hatch plt axis plt.bar() plt.axis import figure pyplot highlight_text pypalettes plt.subplots() xlabel ylabel title legend colorbar savefig tight_layout grid set_xlim set_ylim plot scatter hist boxplot imshow cmap alpha bins tick_params annotate quiver contour barh stackplot subplots_adjust axhline axvline semilogx semilogy loglog polar streamplot hexbin pcolor tricontour errorbar clabel set_aspect violinplot set_axis_off spines text hatch plt axis plt.bar() plt.axis import figure pyplot highlight_text pypalettes plt.subplots() xlabel ylabel title legend colorbar savefig tight_layout grid set_xlim set_ylim plot scatter hist boxplot imshow cmap alpha bins tick_params annotate quiver contour barh stackplot subplots_adjust axhline axvline semilogx semilogy loglog polar streamplot hexbin pcolor tricontour errorbar clabel set_aspect violinplot set_axis_off spines text hatch plt axis plt.bar() plt.axis import figure pyplot highlight_text pypalettes plt.subplots() xlabel ylabel title legend colorbar savefig tight_layout grid set_xlim set_ylim plot scatter hist boxplot imshow cmap alpha bins tick_params annotate quiver contour barh stackplot subplots_adjust axhline axvline semilogx semilogy loglog polar streamplot hexbin pcolor tricontour errorbar clabel set_aspect violinplot set_axis_off spines text hatch plt axis plt.bar() plt.axis import figure pyplot highlight_text pypalettes plt.subplots() xlabel ylabel title legend colorbar savefig tight_layout grid set_xlim set_ylim plot scatter hist boxplot imshow cmap alpha bins tick_params annotate quiver contour barh stackplot subplots_adjust axhline axvline semilogx semilogy loglog polar streamplot hexbin pcolor tricontour errorbar clabel set_aspect violinplot set_axis_off spines text hatch plt axis plt.bar() plt.axis import figure pyplot highlight_text pypalettes plt.subplots() xlabel ylabel title legend colorbar savefig tight_layout grid set_xlim set_ylim plot scatter hist boxplot imshow cmap alpha bins tick_params annotate quiver contour barh stackplot subplots_adjust axhline axvline semilogx semilogy loglog polar streamplot hexbin pcolor tricontour errorbar clabel set_aspect violinplot set_axis_off spines text hatch plt axis plt.bar() plt.axis import figure pyplot highlight_text pypalettes plt.subplots() xlabel ylabel title legend colorbar savefig tight_layout grid set_xlim set_ylim plot scatter hist boxplot imshow cmap alpha bins tick_params annotate quiver contour barh stackplot subplots_adjust axhline axvline semilogx semilogy loglog polar streamplot hexbin pcolor tricontour errorbar clabel set_aspect violinplot set_axis_off spines text hatch plt axis plt.bar() plt.axis import figure pyplot highlight_text pypalettes plt.subplots() xlabel ylabel title legend colorbar savefig tight_layout grid set_xlim set_ylim plot scatter hist boxplot imshow cmap alpha bins tick_params annotate quiver contour barh stackplot subplots_adjust axhline axvline semilogx semilogy loglog polar streamplot hexbin pcolor tricontour errorbar clabel set_aspect violinplot set_axis_off spines text hatch plt axis plt.bar() plt.axis import figure pyplot highlight_text pypalettes plt.subplots() xlabel ylabel title legend colorbar savefig tight_layout grid set_xlim set_ylim plot scatter hist boxplot imshow cmap alpha bins tick_params annotate quiver contour barh stackplot subplots_adjust axhline axvline semilogx semilogy loglog polar streamplot hexbin pcolor tricontour errorbar clabel set_aspect violinplot set_axis_off spines text hatch plt axis plt.bar() plt.axis import figure pyplot highlight_text pypalettes plt.subplots() xlabel ylabel title legend colorbar savefig tight_layout grid set_xlim set_ylim plot scatter hist boxplot imshow cmap alpha bins tick_params annotate quiver contour barh stackplot subplots_adjust axhline axvline semilogx semilogy loglog polar streamplot hexbin pcolor tricontour errorbar clabel set_aspect violinplot set_axis_off spines text hatch plt axis plt.bar() plt.axis import figure pyplot highlight_text pypalettes plt.subplots() xlabel ylabel title legend colorbar savefig tight_layout grid set_xlim set_ylim plot scatter hist boxplot imshow cmap alpha bins tick_params annotate quiver contour barh stackplot subplots_adjust axhline axvline semilogx semilogy loglog polar streamplot hexbin pcolor tricontour errorbar clabel set_aspect violinplot set_axis_off spines text hatch plt axis plt.bar() plt.axis import figure pyplot highlight_text pypalettes plt.subplots() xlabel ylabel title legend colorbar savefig tight_layout grid set_xlim set_ylim plot scatter hist boxplot imshow cmap alpha bins tick_params annotate quiver contour barh stackplot subplots_adjust axhline axvline semilogx semilogy loglog polar streamplot hexbin pcolor tricontour errorbar clabel set_aspect violinplot set_axis_off spines text hatch plt axis plt.bar() plt.axis import figure pyplot highlight_text pypalettes plt.subplots() xlabel ylabel title legend colorbar savefig tight_layout grid set_xlim set_ylim plot scatter hist boxplot imshow cmap alpha bins tick_params annotate quiver contour barh stackplot subplots_adjust axhline axvline semilogx semilogy loglog polar streamplot hexbin pcolor tricontour errorbar clabel set_aspect violinplot set_axis_off spines text hatch plt axis plt.bar() plt.axis import figure pyplot highlight_text pypalettes plt.subplots() xlabel ylabel title legend colorbar savefig tight_layout grid set_xlim set_ylim plot scatter hist boxplot imshow cmap alpha bins tick_params annotate quiver contour barh stackplot subplots_adjust axhline axvline semilogx semilogy loglog polar streamplot hexbin pcolor tricontour errorbar clabel set_aspect violinplot set_axis_off spines text hatch plt axis plt.bar() plt.axis import figure pyplot highlight_text pypalettes plt.subplots() xlabel ylabel title legend colorbar savefig tight_layout grid set_xlim set_ylim plot scatter hist boxplot imshow cmap alpha bins tick_params annotate quiver contour barh stackplot subplots_adjust axhline axvline semilogx semilogy loglog polar streamplot hexbin pcolor tricontour errorbar clabel set_aspect violinplot set_axis_off spines text hatch plt axis plt.bar() plt.axis import figure pyplot highlight_text pypalettes plt.subplots() xlabel ylabel title legend colorbar savefig tight_layout grid set_xlim set_ylim plot scatter hist boxplot imshow cmap alpha bins tick_params annotate quiver contour barh stackplot subplots_adjust axhline axvline semilogx semilogy loglog polar streamplot hexbin pcolor tricontour errorbar clabel set_aspect violinplot set_axis_off spines text hatch plt axis plt.bar() plt.axis import figure pyplot highlight_text pypalettes plt.subplots() xlabel ylabel title legend colorbar savefig tight_layout grid set_xlim set_ylim plot scatter hist boxplot imshow cmap alpha bins tick_params annotate quiver contour barh stackplot subplots_adjust axhline axvline semilogx semilogy loglog polar streamplot hexbin pcolor tricontour errorbar clabel set_aspect violinplot set_axis_off spines text hatch plt axis plt.bar() plt.axis import figure pyplot highlight_text pypalettes plt.subplots() xlabel ylabel title legend colorbar savefig tight_layout grid set_xlim set_ylim plot scatter hist boxplot imshow cmap alpha bins tick_params annotate quiver contour barh stackplot subplots_adjust axhline axvline semilogx semilogy loglog polar streamplot hexbin pcolor tricontour errorbar clabel set_aspect violinplot set_axis_off spines text hatch plt axis plt.bar() plt.axis import figure pyplot highlight_text pypalettes plt.subplots() xlabel ylabel title legend colorbar savefig tight_layout grid set_xlim set_ylim plot scatter hist boxplot imshow cmap alpha bins tick_params annotate quiver contour barh stackplot subplots_adjust axhline axvline semilogx semilogy loglog polar streamplot hexbin pcolor tricontour errorbar clabel set_aspect violinplot set_axis_off spines text hatch plt axis plt.bar() plt.axis import figure pyplot highlight_text pypalettes plt.subplots() xlabel ylabel title legend colorbar savefig tight_layout grid set_xlim set_ylim plot scatter hist boxplot imshow cmap alpha bins tick_params annotate quiver contour barh stackplot subplots_adjust axhline axvline semilogx semilogy loglog polar streamplot hexbin pcolor tricontour errorbar clabel set_aspect violinplot set_axis_off spines text hatch plt axis plt.bar() plt.axis import figure pyplot highlight_text pypalettes plt.subplots() xlabel ylabel title legend colorbar savefig tight_layout grid set_xlim set_ylim plot scatter hist boxplot imshow cmap alpha bins tick_params annotate quiver contour barh stackplot subplots_adjust axhline axvline semilogx semilogy loglog polar streamplot hexbin pcolor tricontour errorbar clabel set_aspect violinplot set_axis_off spines text hatch plt axis plt.bar() plt.axis import figure pyplot highlight_text pypalettes plt.subplots() xlabel ylabel title legend colorbar savefig tight_layout grid set_xlim set_ylim plot scatter hist boxplot imshow cmap alpha bins tick_params annotate quiver contour barh stackplot subplots_adjust axhline axvline semilogx semilogy loglog polar streamplot hexbin pcolor tricontour errorbar clabel set_aspect violinplot set_axis_off spines text hatch plt axis plt.bar() plt.axis import figure pyplot highlight_text pypalettes plt.subplots() xlabel ylabel title legend colorbar savefig tight_layout grid set_xlim set_ylim plot scatter hist boxplot imshow cmap alpha bins tick_params annotate quiver contour barh stackplot subplots_adjust axhline axvline semilogx semilogy loglog polar streamplot hexbin pcolor tricontour errorbar clabel set_aspect violinplot set_axis_off spines text hatch plt axis plt.bar() plt.axis import figure pyplot highlight_text pypalettes plt.subplots() xlabel ylabel title legend colorbar savefig tight_layout grid set_xlim set_ylim plot scatter hist boxplot imshow cmap alpha bins tick_params annotate quiver contour barh stackplot subplots_adjust axhline axvline semilogx semilogy loglog polar streamplot hexbin pcolor tricontour errorbar clabel set_aspect violinplot set_axis_off spines text hatch plt axis plt.bar() plt.axis import figure pyplot highlight_text pypalettes plt.subplots() xlabel ylabel title legend colorbar savefig tight_layout grid set_xlim set_ylim plot scatter hist boxplot imshow cmap alpha bins tick_params annotate quiver contour barh stackplot subplots_adjust axhline axvline semilogx semilogy loglog polar streamplot hexbin pcolor tricontour errorbar clabel set_aspect violinplot set_axis_off spines text hatch plt axis plt.bar() plt.axis import figure pyplot highlight_text pypalettes plt.subplots() xlabel ylabel title legend colorbar savefig tight_layout grid set_xlim set_ylim plot scatter hist boxplot imshow cmap alpha bins tick_params annotate quiver contour barh stackplot subplots_adjust axhline axvline semilogx semilogy loglog polar streamplot hexbin pcolor tricontour errorbar clabel set_aspect violinplot set_axis_off spines text hatch plt axis plt.bar() plt.axis import figure pyplot highlight_text pypalettes plt.subplots() xlabel ylabel title legend colorbar savefig tight_layout grid set_xlim set_ylim plot scatter hist boxplot imshow cmap alpha bins tick_params annotate quiver contour barh stackplot subplots_adjust axhline axvline semilogx semilogy loglog polar streamplot hexbin pcolor tricontour errorbar clabel set_aspect violinplot set_axis_off spines text hatch plt axis plt.bar() plt.axis import figure pyplot highlight_text pypalettes plt.subplots() xlabel ylabel title legend colorbar savefig tight_layout grid set_xlim set_ylim plot scatter hist boxplot imshow cmap alpha bins tick_params annotate quiver contour barh stackplot subplots_adjust axhline axvline semilogx semilogy loglog polar streamplot hexbin pcolor tricontour errorbar clabel set_aspect violinplot set_axis_off spines text hatch plt axis plt.bar() plt.axis import figure pyplot highlight_text pypalettes plt.subplots() xlabel ylabel title legend colorbar savefig tight_layout grid set_xlim set_ylim plot scatter hist boxplot imshow cmap alpha bins tick_params annotate quiver contour barh stackplot subplots_adjust axhline axvline semilogx semilogy loglog polar streamplot hexbin pcolor tricontour errorbar clabel set_aspect violinplot set_axis_off spines text hatch plt axis plt.bar() plt.axis import figure pyplot highlight_text pypalettes plt.subplots() xlabel ylabel title legend colorbar savefig tight_layout grid set_xlim set_ylim plot scatter hist boxplot imshow cmap alpha bins tick_params annotate quiver contour barh stackplot subplots_adjust axhline axvline semilogx semilogy loglog polar streamplot hexbin pcolor tricontour errorbar clabel set_aspect violinplot set_axis_off spines text hatch plt axis plt.bar() plt.axis import figure pyplot highlight_text pypalettes plt.subplots() xlabel ylabel title legend colorbar savefig tight_layout grid set_xlim set_ylim plot scatter hist boxplot imshow cmap alpha bins tick_params annotate quiver contour barh stackplot subplots_adjust axhline axvline semilogx semilogy loglog polar streamplot hexbin pcolor tricontour errorbar clabel set_aspect violinplot set_axis_off spines text hatch plt axis plt.bar() plt.axis import figure pyplot highlight_text pypalettes plt.subplots() xlabel ylabel title legend colorbar savefig tight_layout grid set_xlim set_ylim plot scatter hist boxplot imshow cmap alpha bins tick_params annotate quiver contour barh stackplot subplots_adjust axhline axvline semilogx semilogy loglog polar streamplot hexbin pcolor tricontour errorbar clabel set_aspect violinplot set_axis_off spines text hatch plt axis plt.bar() plt.axis import figure pyplot highlight_text pypalettes plt.subplots() xlabel ylabel title legend colorbar savefig tight_layout grid set_xlim set_ylim plot scatter hist boxplot imshow cmap alpha bins tick_params annotate quiver contour barh stackplot subplots_adjust axhline axvline semilogx semilogy loglog polar streamplot hexbin pcolor tricontour errorbar clabel set_aspect violinplot set_axis_off spines text hatch plt axis plt.bar() plt.axis import figure pyplot highlight_text pypalettes plt.subplots() xlabel ylabel title legend colorbar savefig tight_layout grid set_xlim set_ylim plot scatter hist boxplot imshow cmap alpha bins tick_params annotate quiver contour barh stackplot subplots_adjust axhline axvline semilogx semilogy loglog polar streamplot hexbin pcolor tricontour errorbar clabel set_aspect violinplot set_axis_off spines text hatch plt axis plt.bar() plt.axis import figure pyplot highlight_text pypalettes plt.subplots() xlabel ylabel title legend colorbar savefig tight_layout grid set_xlim set_ylim plot scatter hist boxplot imshow cmap alpha bins tick_params annotate quiver contour barh stackplot subplots_adjust axhline axvline semilogx semilogy loglog polar streamplot hexbin pcolor tricontour errorbar clabel set_aspect violinplot set_axis_off spines text hatch plt axis plt.bar() plt.axis import figure pyplot highlight_text pypalettes plt.subplots() xlabel ylabel title legend colorbar savefig tight_layout grid set_xlim set_ylim plot scatter hist boxplot imshow cmap alpha bins tick_params annotate quiver contour barh stackplot subplots_adjust axhline axvline semilogx semilogy loglog polar streamplot hexbin pcolor tricontour errorbar clabel set_aspect violinplot set_axis_off spines text hatch plt axis plt.bar() plt.axis import figure pyplot highlight_text pypalettes plt.subplots() xlabel ylabel title legend colorbar savefig tight_layout grid set_xlim set_ylim plot scatter hist boxplot imshow cmap alpha bins tick_params annotate quiver contour barh stackplot subplots_adjust axhline axvline semilogx semilogy loglog polar streamplot hexbin pcolor tricontour errorbar clabel set_aspect violinplot set_axis_off spines text hatch plt axis plt.bar() plt.axis import figure pyplot highlight_text pypalettes plt.subplots() xlabel ylabel title legend colorbar savefig tight_layout grid set_xlim set_ylim plot scatter hist boxplot imshow cmap alpha bins tick_params annotate quiver contour barh stackplot subplots_adjust axhline axvline semilogx semilogy loglog polar streamplot hexbin pcolor tricontour errorbar clabel set_aspect violinplot set_axis_off spines text hatch plt axis plt.bar() plt.axis import figure pyplot highlight_text pypalettes plt.subplots() xlabel ylabel title legend colorbar savefig tight_layout grid set_xlim set_ylim plot scatter hist boxplot imshow cmap alpha bins tick_params annotate quiver contour barh stackplot subplots_adjust axhline axvline semilogx semilogy loglog polar streamplot hexbin pcolor tricontour errorbar clabel set_aspect violinplot set_axis_off spines text hatch plt axis plt.bar() plt.axis import figure pyplot highlight_text pypalettes plt.subplots() xlabel ylabel title legend colorbar savefig tight_layout grid set_xlim set_ylim plot scatter hist boxplot imshow cmap alpha bins tick_params annotate quiver contour barh stackplot subplots_adjust axhline axvline semilogx semilogy loglog polar streamplot hexbin pcolor tricontour errorbar clabel set_aspect violinplot set_axis_off spines text hatch plt axis plt.bar() plt.axis import figure pyplot highlight_text pypalettes plt.subplots() xlabel ylabel title legend colorbar savefig tight_layout grid set_xlim set_ylim plot scatter hist boxplot imshow cmap alpha bins tick_params annotate quiver contour barh stackplot subplots_adjust axhline axvline semilogx semilogy loglog polar streamplot hexbin pcolor tricontour errorbar clabel set_aspect violinplot set_axis_off spines text hatch plt axis plt.bar() plt.axis import figure pyplot highlight_text pypalettes plt.subplots() xlabel ylabel title legend colorbar savefig tight_layout grid set_xlim set_ylim plot scatter hist boxplot imshow cmap alpha bins tick_params annotate quiver contour barh stackplot subplots_adjust axhline axvline semilogx semilogy loglog polar streamplot hexbin pcolor tricontour errorbar clabel set_aspect violinplot set_axis_off spines text hatch plt axis plt.bar() plt.axis import figure pyplot highlight_text pypalettes plt.subplots() xlabel ylabel title legend colorbar savefig tight_layout grid set_xlim set_ylim plot scatter hist boxplot imshow cmap alpha bins tick_params annotate quiver contour barh stackplot subplots_adjust axhline axvline semilogx semilogy loglog polar streamplot hexbin pcolor tricontour errorbar clabel set_aspect violinplot set_axis_off spines text hatch plt axis plt.bar() plt.axis import figure pyplot highlight_text pypalettes plt.subplots() xlabel ylabel title legend colorbar savefig tight_layout grid set_xlim set_ylim plot scatter hist boxplot imshow cmap alpha bins tick_params annotate quiver contour barh stackplot subplots_adjust axhline axvline semilogx semilogy loglog polar streamplot hexbin pcolor tricontour errorbar clabel set_aspect violinplot set_axis_off spines text hatch plt axis plt.bar() plt.axis import figure pyplot highlight_text pypalettes plt.subplots() xlabel ylabel title legend colorbar savefig tight_layout grid set_xlim set_ylim plot scatter hist boxplot imshow cmap alpha bins tick_params annotate quiver contour barh stackplot subplots_adjust axhline axvline semilogx semilogy loglog polar streamplot hexbin pcolor tricontour errorbar clabel set_aspect violinplot set_axis_off spines text hatch plt axis plt.bar() plt.axis import figure pyplot highlight_text pypalettes plt.subplots() xlabel ylabel title legend colorbar savefig tight_layout grid set_xlim set_ylim plot scatter hist boxplot imshow cmap alpha bins tick_params annotate quiver contour barh stackplot subplots_adjust axhline axvline semilogx semilogy loglog polar streamplot hexbin pcolor tricontour errorbar clabel set_aspect violinplot set_axis_off spines text hatch plt axis plt.bar() plt.axis import figure pyplot highlight_text pypalettes plt.subplots() xlabel ylabel title legend colorbar savefig tight_layout grid set_xlim set_ylim plot scatter hist boxplot imshow cmap alpha bins tick_params annotate quiver contour barh stackplot subplots_adjust axhline axvline semilogx semilogy loglog polar streamplot hexbin pcolor tricontour errorbar clabel set_aspect violinplot set_axis_off spines text hatch plt axis plt.bar() plt.axis import figure pyplot highlight_text pypalettes plt.subplots() xlabel ylabel title legend colorbar savefig tight_layout grid set_xlim set_ylim plot scatter hist boxplot imshow cmap alpha bins tick_params annotate quiver contour barh stackplot subplots_adjust axhline axvline semilogx semilogy loglog polar streamplot hexbin pcolor tricontour errorbar clabel set_aspect violinplot set_axis_off spines text hatch plt axis plt.bar() plt.axis import figure pyplot highlight_text pypalettes plt.subplots() xlabel ylabel title legend colorbar savefig tight_layout grid set_xlim set_ylim plot scatter hist boxplot imshow cmap alpha bins tick_params annotate quiver contour barh stackplot subplots_adjust axhline axvline semilogx semilogy loglog polar streamplot hexbin pcolor tricontour errorbar clabel set_aspect violinplot set_axis_off spines text hatch plt axis plt.bar() plt.axis import figure pyplot highlight_text pypalettes plt.subplots() xlabel ylabel title legend colorbar savefig tight_layout grid set_xlim set_ylim plot scatter hist boxplot imshow cmap alpha bins tick_params annotate quiver contour barh stackplot subplots_adjust axhline axvline semilogx semilogy loglog polar streamplot hexbin pcolor tricontour errorbar clabel set_aspect violinplot set_axis_off spines text hatch plt axis plt.bar() plt.axis import figure pyplot highlight_text pypalettes plt.subplots() xlabel ylabel title legend colorbar savefig tight_layout grid set_xlim set_ylim plot scatter hist boxplot imshow cmap alpha bins tick_params annotate quiver contour barh stackplot subplots_adjust axhline axvline semilogx semilogy loglog polar streamplot hexbin pcolor tricontour errorbar clabel set_aspect violinplot set_axis_off spines text hatch plt axis plt.bar() plt.axis import figure pyplot highlight_text pypalettes plt.subplots() xlabel ylabel title legend colorbar savefig tight_layout grid set_xlim set_ylim plot scatter hist boxplot imshow cmap alpha bins tick_params annotate quiver contour barh stackplot subplots_adjust axhline axvline semilogx semilogy loglog polar streamplot hexbin pcolor tricontour errorbar clabel set_aspect violinplot set_axis_off spines text hatch plt axis plt.bar() plt.axis import figure pyplot highlight_text pypalettes plt.subplots() xlabel ylabel title legend colorbar savefig tight_layout grid set_xlim set_ylim plot scatter hist boxplot imshow cmap alpha bins tick_params annotate quiver contour barh stackplot subplots_adjust axhline axvline semilogx semilogy loglog polar streamplot hexbin pcolor tricontour errorbar clabel set_aspect violinplot set_axis_off spines text hatch plt axis plt.bar() plt.axis import figure pyplot highlight_text pypalettes plt.subplots() xlabel ylabel title legend colorbar savefig tight_layout grid set_xlim set_ylim plot scatter hist boxplot imshow cmap alpha bins tick_params annotate quiver contour barh stackplot subplots_adjust axhline axvline semilogx semilogy loglog polar streamplot hexbin pcolor tricontour errorbar clabel set_aspect violinplot set_axis_off spines text hatch plt axis plt.bar() plt.axis import figure pyplot highlight_text pypalettes plt.subplots() xlabel ylabel title legend colorbar savefig tight_layout grid set_xlim set_ylim plot scatter hist boxplot imshow cmap alpha bins tick_params annotate quiver contour barh stackplot subplots_adjust axhline axvline semilogx semilogy loglog polar streamplot hexbin pcolor tricontour errorbar clabel set_aspect violinplot set_axis_off spines text hatch plt axis plt.bar() plt.axis import figure pyplot highlight_text pypalettes plt.subplots() xlabel ylabel title legend colorbar savefig tight_layout grid set_xlim set_ylim plot scatter hist boxplot imshow cmap alpha bins tick_params annotate quiver contour barh stackplot subplots_adjust axhline axvline semilogx semilogy loglog polar streamplot hexbin pcolor tricontour errorbar clabel set_aspect violinplot set_axis_off spines text hatch plt axis plt.bar() plt.axis import figure pyplot highlight_text pypalettes plt.subplots() xlabel ylabel title legend colorbar savefig tight_layout grid set_xlim set_ylim plot scatter hist boxplot imshow cmap alpha bins tick_params annotate quiver contour barh stackplot subplots_adjust axhline axvline semilogx semilogy loglog polar streamplot hexbin pcolor tricontour errorbar clabel set_aspect violinplot set_axis_off spines text hatch plt axis plt.bar() plt.axis import figure pyplot highlight_text pypalettes plt.subplots() xlabel ylabel title legend colorbar savefig tight_layout grid set_xlim set_ylim plot scatter hist boxplot imshow cmap alpha bins tick_params annotate quiver contour barh stackplot subplots_adjust axhline axvline semilogx semilogy loglog polar streamplot hexbin pcolor tricontour errorbar clabel set_aspect violinplot set_axis_off spines text hatch
plt axis plt.bar() plt.axis import figure pyplot highlight_text pypalettes plt.subplots() xlabel ylabel title legend colorbar savefig tight_layout grid set_xlim set_ylim plot scatter hist boxplot imshow cmap alpha bins tick_params annotate quiver contour barh stackplot subplots_adjust axhline axvline semilogx semilogy loglog polar streamplot hexbin pcolor tricontour errorbar clabel set_aspect violinplot set_axis_off spines text hatch plt axis plt.bar() plt.axis import figure pyplot highlight_text pypalettes plt.subplots() xlabel ylabel title legend colorbar savefig tight_layout grid set_xlim set_ylim plot scatter hist boxplot imshow cmap alpha bins tick_params annotate quiver contour barh stackplot subplots_adjust axhline axvline semilogx semilogy loglog polar streamplot hexbin pcolor tricontour errorbar clabel set_aspect violinplot set_axis_off spines text hatch plt axis plt.bar() plt.axis import figure pyplot highlight_text pypalettes plt.subplots() xlabel ylabel title legend colorbar savefig tight_layout grid set_xlim set_ylim plot scatter hist boxplot imshow cmap alpha bins tick_params annotate quiver contour barh stackplot subplots_adjust axhline axvline semilogx semilogy loglog polar streamplot hexbin pcolor tricontour errorbar clabel set_aspect violinplot set_axis_off spines text hatch plt axis plt.bar() plt.axis import figure pyplot highlight_text pypalettes plt.subplots() xlabel ylabel title legend colorbar savefig tight_layout grid set_xlim set_ylim plot scatter hist boxplot imshow cmap alpha bins tick_params annotate quiver contour barh stackplot subplots_adjust axhline axvline semilogx semilogy loglog polar streamplot hexbin pcolor tricontour errorbar clabel set_aspect violinplot set_axis_off spines text hatch plt axis plt.bar() plt.axis import figure pyplot highlight_text pypalettes plt.subplots() xlabel ylabel title legend colorbar savefig tight_layout grid set_xlim set_ylim plot scatter hist boxplot imshow cmap alpha bins tick_params annotate quiver contour barh stackplot subplots_adjust axhline axvline semilogx semilogy loglog polar streamplot hexbin pcolor tricontour errorbar clabel set_aspect violinplot set_axis_off spines text hatch plt axis plt.bar() plt.axis import figure pyplot highlight_text pypalettes plt.subplots() xlabel ylabel title legend colorbar savefig tight_layout grid set_xlim set_ylim plot scatter hist boxplot imshow cmap alpha bins tick_params annotate quiver contour barh stackplot subplots_adjust axhline axvline semilogx semilogy loglog polar streamplot hexbin pcolor tricontour errorbar clabel set_aspect violinplot set_axis_off spines text hatch plt axis plt.bar() plt.axis import figure pyplot highlight_text pypalettes plt.subplots() xlabel ylabel title legend colorbar savefig tight_layout grid set_xlim set_ylim plot scatter hist boxplot imshow cmap alpha bins tick_params annotate quiver contour barh stackplot subplots_adjust axhline axvline semilogx semilogy loglog polar streamplot hexbin pcolor tricontour errorbar clabel set_aspect violinplot set_axis_off spines text hatch plt axis plt.bar() plt.axis import figure pyplot highlight_text pypalettes plt.subplots() xlabel ylabel title legend colorbar savefig tight_layout grid set_xlim set_ylim plot scatter hist boxplot imshow cmap alpha bins tick_params annotate quiver contour barh stackplot subplots_adjust axhline axvline semilogx semilogy loglog polar streamplot hexbin pcolor tricontour errorbar clabel set_aspect violinplot set_axis_off spines text hatch plt axis plt.bar() plt.axis import figure pyplot highlight_text pypalettes plt.subplots() xlabel ylabel title legend colorbar savefig tight_layout grid set_xlim set_ylim plot scatter hist boxplot imshow cmap alpha bins tick_params annotate quiver contour barh stackplot subplots_adjust axhline axvline semilogx semilogy loglog polar streamplot hexbin pcolor tricontour errorbar clabel set_aspect violinplot set_axis_off spines text hatch plt axis plt.bar() plt.axis import figure pyplot highlight_text pypalettes plt.subplots() xlabel ylabel title legend colorbar savefig tight_layout grid set_xlim set_ylim plot scatter hist boxplot imshow cmap alpha bins tick_params annotate quiver contour barh stackplot subplots_adjust axhline axvline semilogx semilogy loglog polar streamplot hexbin pcolor tricontour errorbar clabel set_aspect violinplot set_axis_off spines text hatch plt axis plt.bar() plt.axis import figure pyplot highlight_text pypalettes plt.subplots() xlabel ylabel title legend colorbar savefig tight_layout grid set_xlim set_ylim plot scatter hist boxplot imshow cmap alpha bins tick_params annotate quiver contour barh stackplot subplots_adjust axhline axvline semilogx semilogy loglog polar streamplot hexbin pcolor tricontour errorbar clabel set_aspect violinplot set_axis_off spines text hatch plt axis plt.bar() plt.axis import figure pyplot highlight_text pypalettes plt.subplots() xlabel ylabel title legend colorbar savefig tight_layout grid set_xlim set_ylim plot scatter hist boxplot imshow cmap alpha bins tick_params annotate quiver contour barh stackplot subplots_adjust axhline axvline semilogx semilogy loglog polar streamplot hexbin pcolor tricontour errorbar clabel set_aspect violinplot set_axis_off spines text hatch plt axis plt.bar() plt.axis import figure pyplot highlight_text pypalettes plt.subplots() xlabel ylabel title legend colorbar savefig tight_layout grid set_xlim set_ylim plot scatter hist boxplot imshow cmap alpha bins tick_params annotate quiver contour barh stackplot subplots_adjust axhline axvline semilogx semilogy loglog polar streamplot hexbin pcolor tricontour errorbar clabel set_aspect violinplot set_axis_off spines text hatch plt axis plt.bar() plt.axis import figure pyplot highlight_text pypalettes plt.subplots() xlabel ylabel title legend colorbar savefig tight_layout grid set_xlim set_ylim plot scatter hist boxplot imshow cmap alpha bins tick_params annotate quiver contour barh stackplot subplots_adjust axhline axvline semilogx semilogy loglog polar streamplot hexbin pcolor tricontour errorbar clabel set_aspect violinplot set_axis_off spines text hatch plt axis plt.bar() plt.axis import figure pyplot highlight_text pypalettes plt.subplots() xlabel ylabel title legend colorbar savefig tight_layout grid set_xlim set_ylim plot scatter hist boxplot imshow cmap alpha bins tick_params annotate quiver contour barh stackplot subplots_adjust axhline axvline semilogx semilogy loglog polar streamplot hexbin pcolor tricontour errorbar clabel set_aspect violinplot set_axis_off spines text hatch plt axis plt.bar() plt.axis import figure pyplot highlight_text pypalettes plt.subplots() xlabel ylabel title legend colorbar savefig tight_layout grid set_xlim set_ylim plot scatter hist boxplot imshow cmap alpha bins tick_params annotate quiver contour barh stackplot subplots_adjust axhline axvline semilogx semilogy loglog polar streamplot hexbin pcolor tricontour errorbar clabel set_aspect violinplot set_axis_off spines text hatch plt axis plt.bar() plt.axis import figure pyplot highlight_text pypalettes plt.subplots() xlabel ylabel title legend colorbar savefig tight_layout grid set_xlim set_ylim plot scatter hist boxplot imshow cmap alpha bins tick_params annotate quiver contour barh stackplot subplots_adjust axhline axvline semilogx semilogy loglog polar streamplot hexbin pcolor tricontour errorbar clabel set_aspect violinplot set_axis_off spines text hatch plt axis plt.bar() plt.axis import figure pyplot highlight_text pypalettes plt.subplots() xlabel ylabel title legend colorbar savefig tight_layout grid set_xlim set_ylim plot scatter hist boxplot imshow cmap alpha bins tick_params annotate quiver contour barh stackplot subplots_adjust axhline axvline semilogx semilogy loglog polar streamplot hexbin pcolor tricontour errorbar clabel set_aspect violinplot set_axis_off spines text hatch plt axis plt.bar() plt.axis import figure pyplot highlight_text pypalettes plt.subplots() xlabel ylabel title legend colorbar savefig tight_layout grid set_xlim set_ylim plot scatter hist boxplot imshow cmap alpha bins tick_params annotate quiver contour barh stackplot subplots_adjust axhline axvline semilogx semilogy loglog polar streamplot hexbin pcolor tricontour errorbar clabel set_aspect violinplot set_axis_off spines text hatch plt axis plt.bar() plt.axis import figure pyplot highlight_text pypalettes plt.subplots() xlabel ylabel title legend colorbar savefig tight_layout grid set_xlim set_ylim plot scatter hist boxplot imshow cmap alpha bins tick_params annotate quiver contour barh stackplot subplots_adjust axhline axvline semilogx semilogy loglog polar streamplot hexbin pcolor tricontour errorbar clabel set_aspect violinplot set_axis_off spines text hatch plt axis plt.bar() plt.axis import figure pyplot highlight_text pypalettes plt.subplots() xlabel ylabel title legend colorbar savefig tight_layout grid set_xlim set_ylim plot scatter hist boxplot imshow cmap alpha bins tick_params annotate quiver contour barh stackplot subplots_adjust axhline axvline semilogx semilogy loglog polar streamplot hexbin pcolor tricontour errorbar clabel set_aspect violinplot set_axis_off spines text hatch plt axis plt.bar() plt.axis import figure pyplot highlight_text pypalettes plt.subplots() xlabel ylabel title legend colorbar savefig tight_layout grid set_xlim set_ylim plot scatter hist boxplot imshow cmap alpha bins tick_params annotate quiver contour barh stackplot subplots_adjust axhline axvline semilogx semilogy loglog polar streamplot hexbin pcolor tricontour errorbar clabel set_aspect violinplot set_axis_off spines text hatch plt axis plt.bar() plt.axis import figure pyplot highlight_text pypalettes plt.subplots() xlabel ylabel title legend colorbar savefig tight_layout grid set_xlim set_ylim plot scatter hist boxplot imshow cmap alpha bins tick_params annotate quiver contour barh stackplot subplots_adjust axhline axvline semilogx semilogy loglog polar streamplot hexbin pcolor tricontour errorbar clabel set_aspect violinplot set_axis_off spines text hatch plt axis plt.bar() plt.axis import figure pyplot highlight_text pypalettes plt.subplots() xlabel ylabel title legend colorbar savefig tight_layout grid set_xlim set_ylim plot scatter hist boxplot imshow cmap alpha bins tick_params annotate quiver contour barh stackplot subplots_adjust axhline axvline semilogx semilogy loglog polar streamplot hexbin pcolor tricontour errorbar clabel set_aspect violinplot set_axis_off spines text hatch plt axis plt.bar() plt.axis import figure pyplot highlight_text pypalettes plt.subplots() xlabel ylabel title legend colorbar savefig tight_layout grid set_xlim set_ylim plot scatter hist boxplot imshow cmap alpha bins tick_params annotate quiver contour barh stackplot subplots_adjust axhline axvline semilogx semilogy loglog polar streamplot hexbin pcolor tricontour errorbar clabel set_aspect violinplot set_axis_off spines text hatch plt axis plt.bar() plt.axis import figure pyplot highlight_text pypalettes plt.subplots() xlabel ylabel title legend colorbar savefig tight_layout grid set_xlim set_ylim plot scatter hist boxplot imshow cmap alpha bins tick_params annotate quiver contour barh stackplot subplots_adjust axhline axvline semilogx semilogy loglog polar streamplot hexbin pcolor tricontour errorbar clabel set_aspect violinplot set_axis_off spines text hatch plt axis plt.bar() plt.axis import figure pyplot highlight_text pypalettes plt.subplots() xlabel ylabel title legend colorbar savefig tight_layout grid set_xlim set_ylim plot scatter hist boxplot imshow cmap alpha bins tick_params annotate quiver contour barh stackplot subplots_adjust axhline axvline semilogx semilogy loglog polar streamplot hexbin pcolor tricontour errorbar clabel set_aspect violinplot set_axis_off spines text hatch plt axis plt.bar() plt.axis import figure pyplot highlight_text pypalettes plt.subplots() xlabel ylabel title legend colorbar savefig tight_layout grid set_xlim set_ylim plot scatter hist boxplot imshow cmap alpha bins tick_params annotate quiver contour barh stackplot subplots_adjust axhline axvline semilogx semilogy loglog polar streamplot hexbin pcolor tricontour errorbar clabel set_aspect violinplot set_axis_off spines text hatch plt axis plt.bar() plt.axis import figure pyplot highlight_text pypalettes plt.subplots() xlabel ylabel title legend colorbar savefig tight_layout grid set_xlim set_ylim plot scatter hist boxplot imshow cmap alpha bins tick_params annotate quiver contour barh stackplot subplots_adjust axhline axvline semilogx semilogy loglog polar streamplot hexbin pcolor tricontour errorbar clabel set_aspect violinplot set_axis_off spines text hatch plt axis plt.bar() plt.axis import figure pyplot highlight_text pypalettes plt.subplots() xlabel ylabel title legend colorbar savefig tight_layout grid set_xlim set_ylim plot scatter hist boxplot imshow cmap alpha bins tick_params annotate quiver contour barh stackplot subplots_adjust axhline axvline semilogx semilogy loglog polar streamplot hexbin pcolor tricontour errorbar clabel set_aspect violinplot set_axis_off spines text hatch plt axis plt.bar() plt.axis import figure pyplot highlight_text pypalettes plt.subplots() xlabel ylabel title legend colorbar savefig tight_layout grid set_xlim set_ylim plot scatter hist boxplot imshow cmap alpha bins tick_params annotate quiver contour barh stackplot subplots_adjust axhline axvline semilogx semilogy loglog polar streamplot hexbin pcolor tricontour errorbar clabel set_aspect violinplot set_axis_off spines text hatch plt axis plt.bar() plt.axis import figure pyplot highlight_text pypalettes plt.subplots() xlabel ylabel title legend colorbar savefig tight_layout grid set_xlim set_ylim plot scatter hist boxplot imshow cmap alpha bins tick_params annotate quiver contour barh stackplot subplots_adjust axhline axvline semilogx semilogy loglog polar streamplot hexbin pcolor tricontour errorbar clabel set_aspect violinplot set_axis_off spines text hatch plt axis plt.bar() plt.axis import figure pyplot highlight_text pypalettes plt.subplots() xlabel ylabel title legend colorbar savefig tight_layout grid set_xlim set_ylim plot scatter hist boxplot imshow cmap alpha bins tick_params annotate quiver contour barh stackplot subplots_adjust axhline axvline semilogx semilogy loglog polar streamplot hexbin pcolor tricontour errorbar clabel set_aspect violinplot set_axis_off spines text hatch plt axis plt.bar() plt.axis import figure pyplot highlight_text pypalettes plt.subplots() xlabel ylabel title legend colorbar savefig tight_layout grid set_xlim set_ylim plot scatter hist boxplot imshow cmap alpha bins tick_params annotate quiver contour barh stackplot subplots_adjust axhline axvline semilogx semilogy loglog polar streamplot hexbin pcolor tricontour errorbar clabel set_aspect violinplot set_axis_off spines text hatch plt axis plt.bar() plt.axis import figure pyplot highlight_text pypalettes plt.subplots() xlabel ylabel title legend colorbar savefig tight_layout grid set_xlim set_ylim plot scatter hist boxplot imshow cmap alpha bins tick_params annotate quiver contour barh stackplot subplots_adjust axhline axvline semilogx semilogy loglog polar streamplot hexbin pcolor tricontour errorbar clabel set_aspect violinplot set_axis_off spines text hatch plt axis plt.bar() plt.axis import figure pyplot highlight_text pypalettes plt.subplots() xlabel ylabel title legend colorbar savefig tight_layout grid set_xlim set_ylim plot scatter hist boxplot imshow cmap alpha bins tick_params annotate quiver contour barh stackplot subplots_adjust axhline axvline semilogx semilogy loglog polar streamplot hexbin pcolor tricontour errorbar clabel set_aspect violinplot set_axis_off spines text hatch plt axis plt.bar() plt.axis import figure pyplot highlight_text pypalettes plt.subplots() xlabel ylabel title legend colorbar savefig tight_layout grid set_xlim set_ylim plot scatter hist boxplot imshow cmap alpha bins tick_params annotate quiver contour barh stackplot subplots_adjust axhline axvline semilogx semilogy loglog polar streamplot hexbin pcolor tricontour errorbar clabel set_aspect violinplot set_axis_off spines text hatch plt axis plt.bar() plt.axis import figure pyplot highlight_text pypalettes plt.subplots() xlabel ylabel title legend colorbar savefig tight_layout grid set_xlim set_ylim plot scatter hist boxplot imshow cmap alpha bins tick_params annotate quiver contour barh stackplot subplots_adjust axhline axvline semilogx semilogy loglog polar streamplot hexbin pcolor tricontour errorbar clabel set_aspect violinplot set_axis_off spines text hatch plt axis plt.bar() plt.axis import figure pyplot highlight_text pypalettes plt.subplots() xlabel ylabel title legend colorbar savefig tight_layout grid set_xlim set_ylim plot scatter hist boxplot imshow cmap alpha bins tick_params annotate quiver contour barh stackplot subplots_adjust axhline axvline semilogx semilogy loglog polar streamplot hexbin pcolor tricontour errorbar clabel set_aspect violinplot set_axis_off spines text hatch plt axis plt.bar() plt.axis import figure pyplot highlight_text pypalettes plt.subplots() xlabel ylabel title legend colorbar savefig tight_layout grid set_xlim set_ylim plot scatter hist boxplot imshow cmap alpha bins tick_params annotate quiver contour barh stackplot subplots_adjust axhline axvline semilogx semilogy loglog polar streamplot hexbin pcolor tricontour errorbar clabel set_aspect violinplot set_axis_off spines text hatch plt axis plt.bar() plt.axis import figure pyplot highlight_text pypalettes plt.subplots() xlabel ylabel title legend colorbar savefig tight_layout grid set_xlim set_ylim plot scatter hist boxplot imshow cmap alpha bins tick_params annotate quiver contour barh stackplot subplots_adjust axhline axvline semilogx semilogy loglog polar streamplot hexbin pcolor tricontour errorbar clabel set_aspect violinplot set_axis_off spines text hatch plt axis plt.bar() plt.axis import figure pyplot highlight_text pypalettes plt.subplots() xlabel ylabel title legend colorbar savefig tight_layout grid set_xlim set_ylim plot scatter hist boxplot imshow cmap alpha bins tick_params annotate quiver contour barh stackplot subplots_adjust axhline axvline semilogx semilogy loglog polar streamplot hexbin pcolor tricontour errorbar clabel set_aspect violinplot set_axis_off spines text hatch plt axis plt.bar() plt.axis import figure pyplot highlight_text pypalettes plt.subplots() xlabel ylabel title legend colorbar savefig tight_layout grid set_xlim set_ylim plot scatter hist boxplot imshow cmap alpha bins tick_params annotate quiver contour barh stackplot subplots_adjust axhline axvline semilogx semilogy loglog polar streamplot hexbin pcolor tricontour errorbar clabel set_aspect violinplot set_axis_off spines text hatch plt axis plt.bar() plt.axis import figure pyplot highlight_text pypalettes plt.subplots() xlabel ylabel title legend colorbar savefig tight_layout grid set_xlim set_ylim plot scatter hist boxplot imshow cmap alpha bins tick_params annotate quiver contour barh stackplot subplots_adjust axhline axvline semilogx semilogy loglog polar streamplot hexbin pcolor tricontour errorbar clabel set_aspect violinplot set_axis_off spines text hatch plt axis plt.bar() plt.axis import figure pyplot highlight_text pypalettes plt.subplots() xlabel ylabel title legend colorbar savefig tight_layout grid set_xlim set_ylim plot scatter hist boxplot imshow cmap alpha bins tick_params annotate quiver contour barh stackplot subplots_adjust axhline axvline semilogx semilogy loglog polar streamplot hexbin pcolor tricontour errorbar clabel set_aspect violinplot set_axis_off spines text hatch plt axis plt.bar() plt.axis import figure pyplot highlight_text pypalettes plt.subplots() xlabel ylabel title legend colorbar savefig tight_layout grid set_xlim set_ylim plot scatter hist boxplot imshow cmap alpha bins tick_params annotate quiver contour barh stackplot subplots_adjust axhline axvline semilogx semilogy loglog polar streamplot hexbin pcolor tricontour errorbar clabel set_aspect violinplot set_axis_off spines text hatch plt axis plt.bar() plt.axis import figure pyplot highlight_text pypalettes plt.subplots() xlabel ylabel title legend colorbar savefig tight_layout grid set_xlim set_ylim plot scatter hist boxplot imshow cmap alpha bins tick_params annotate quiver contour barh stackplot subplots_adjust axhline axvline semilogx semilogy loglog polar streamplot hexbin pcolor tricontour errorbar clabel set_aspect violinplot set_axis_off spines text hatch plt axis plt.bar() plt.axis import figure pyplot highlight_text pypalettes plt.subplots() xlabel ylabel title legend colorbar savefig tight_layout grid set_xlim set_ylim plot scatter hist boxplot imshow cmap alpha bins tick_params annotate quiver contour barh stackplot subplots_adjust axhline axvline semilogx semilogy loglog polar streamplot hexbin pcolor tricontour errorbar clabel set_aspect violinplot set_axis_off spines text hatch plt axis plt.bar() plt.axis import figure pyplot highlight_text pypalettes plt.subplots() xlabel ylabel title legend colorbar savefig tight_layout grid set_xlim set_ylim plot scatter hist boxplot imshow cmap alpha bins tick_params annotate quiver contour barh stackplot subplots_adjust axhline axvline semilogx semilogy loglog polar streamplot hexbin pcolor tricontour errorbar clabel set_aspect violinplot set_axis_off spines text hatch plt axis plt.bar() plt.axis import figure pyplot highlight_text pypalettes plt.subplots() xlabel ylabel title legend colorbar savefig tight_layout grid set_xlim set_ylim plot scatter hist boxplot imshow cmap alpha bins tick_params annotate quiver contour barh stackplot subplots_adjust axhline axvline semilogx semilogy loglog polar streamplot hexbin pcolor tricontour errorbar clabel set_aspect violinplot set_axis_off spines text hatch plt axis plt.bar() plt.axis import figure pyplot highlight_text pypalettes plt.subplots() xlabel ylabel title legend colorbar savefig tight_layout grid set_xlim set_ylim plot scatter hist boxplot imshow cmap alpha bins tick_params annotate quiver contour barh stackplot subplots_adjust axhline axvline semilogx semilogy loglog polar streamplot hexbin pcolor tricontour errorbar clabel set_aspect violinplot set_axis_off spines text hatch plt axis plt.bar() plt.axis import figure pyplot highlight_text pypalettes plt.subplots() xlabel ylabel title legend colorbar savefig tight_layout grid set_xlim set_ylim plot scatter hist boxplot imshow cmap alpha bins tick_params annotate quiver contour barh stackplot subplots_adjust axhline axvline semilogx semilogy loglog polar streamplot hexbin pcolor tricontour errorbar clabel set_aspect violinplot set_axis_off spines text hatch plt axis plt.bar() plt.axis import figure pyplot highlight_text pypalettes plt.subplots() xlabel ylabel title legend colorbar savefig tight_layout grid set_xlim set_ylim plot scatter hist boxplot imshow cmap alpha bins tick_params annotate quiver contour barh stackplot subplots_adjust axhline axvline semilogx semilogy loglog polar streamplot hexbin pcolor tricontour errorbar clabel set_aspect violinplot set_axis_off spines text hatch plt axis plt.bar() plt.axis import figure pyplot highlight_text pypalettes plt.subplots() xlabel ylabel title legend colorbar savefig tight_layout grid set_xlim set_ylim plot scatter hist boxplot imshow cmap alpha bins tick_params annotate quiver contour barh stackplot subplots_adjust axhline axvline semilogx semilogy loglog polar streamplot hexbin pcolor tricontour errorbar clabel set_aspect violinplot set_axis_off spines text hatch plt axis plt.bar() plt.axis import figure pyplot highlight_text pypalettes plt.subplots() xlabel ylabel title legend colorbar savefig tight_layout grid set_xlim set_ylim plot scatter hist boxplot imshow cmap alpha bins tick_params annotate quiver contour barh stackplot subplots_adjust axhline axvline semilogx semilogy loglog polar streamplot hexbin pcolor tricontour errorbar clabel set_aspect violinplot set_axis_off spines text hatch plt axis plt.bar() plt.axis import figure pyplot highlight_text pypalettes plt.subplots() xlabel ylabel title legend colorbar savefig tight_layout grid set_xlim set_ylim plot scatter hist boxplot imshow cmap alpha bins tick_params annotate quiver contour barh stackplot subplots_adjust axhline axvline semilogx semilogy loglog polar streamplot hexbin pcolor tricontour errorbar clabel set_aspect violinplot set_axis_off spines text hatch plt axis plt.bar() plt.axis import figure pyplot highlight_text pypalettes plt.subplots() xlabel ylabel title legend colorbar savefig tight_layout grid set_xlim set_ylim plot scatter hist boxplot imshow cmap alpha bins tick_params annotate quiver contour barh stackplot subplots_adjust axhline axvline semilogx semilogy loglog polar streamplot hexbin pcolor tricontour errorbar clabel set_aspect violinplot set_axis_off spines text hatch plt axis plt.bar() plt.axis import figure pyplot highlight_text pypalettes plt.subplots() xlabel ylabel title legend colorbar savefig tight_layout grid set_xlim set_ylim plot scatter hist boxplot imshow cmap alpha bins tick_params annotate quiver contour barh stackplot subplots_adjust axhline axvline semilogx semilogy loglog polar streamplot hexbin pcolor tricontour errorbar clabel set_aspect violinplot set_axis_off spines text hatch plt axis plt.bar() plt.axis import figure pyplot highlight_text pypalettes plt.subplots() xlabel ylabel title legend colorbar savefig tight_layout grid set_xlim set_ylim plot scatter hist boxplot imshow cmap alpha bins tick_params annotate quiver contour barh stackplot subplots_adjust axhline axvline semilogx semilogy loglog polar streamplot hexbin pcolor tricontour errorbar clabel set_aspect violinplot set_axis_off spines text hatch plt axis plt.bar() plt.axis import figure pyplot highlight_text pypalettes plt.subplots() xlabel ylabel title legend colorbar savefig tight_layout grid set_xlim set_ylim plot scatter hist boxplot imshow cmap alpha bins tick_params annotate quiver contour barh stackplot subplots_adjust axhline axvline semilogx semilogy loglog polar streamplot hexbin pcolor tricontour errorbar clabel set_aspect violinplot set_axis_off spines text hatch plt axis plt.bar() plt.axis import figure pyplot highlight_text pypalettes plt.subplots() xlabel ylabel title legend colorbar savefig tight_layout grid set_xlim set_ylim plot scatter hist boxplot imshow cmap alpha bins tick_params annotate quiver contour barh stackplot subplots_adjust axhline axvline semilogx semilogy loglog polar streamplot hexbin pcolor tricontour errorbar clabel set_aspect violinplot set_axis_off spines text hatch plt axis plt.bar() plt.axis import figure pyplot highlight_text pypalettes plt.subplots() xlabel ylabel title legend colorbar savefig tight_layout grid set_xlim set_ylim plot scatter hist boxplot imshow cmap alpha bins tick_params annotate quiver contour barh stackplot subplots_adjust axhline axvline semilogx semilogy loglog polar streamplot hexbin pcolor tricontour errorbar clabel set_aspect violinplot set_axis_off spines text hatch plt axis plt.bar() plt.axis import figure pyplot highlight_text pypalettes plt.subplots() xlabel ylabel title legend colorbar savefig tight_layout grid set_xlim set_ylim plot scatter hist boxplot imshow cmap alpha bins tick_params annotate quiver contour barh stackplot subplots_adjust axhline axvline semilogx semilogy loglog polar streamplot hexbin pcolor tricontour errorbar clabel set_aspect violinplot set_axis_off spines text hatch plt axis plt.bar() plt.axis import figure pyplot highlight_text pypalettes plt.subplots() xlabel ylabel title legend colorbar savefig tight_layout grid set_xlim set_ylim plot scatter hist boxplot imshow cmap alpha bins tick_params annotate quiver contour barh stackplot subplots_adjust axhline axvline semilogx semilogy loglog polar streamplot hexbin pcolor tricontour errorbar clabel set_aspect violinplot set_axis_off spines text hatch plt axis plt.bar() plt.axis import figure pyplot highlight_text pypalettes plt.subplots() xlabel ylabel title legend colorbar savefig tight_layout grid set_xlim set_ylim plot scatter hist boxplot imshow cmap alpha bins tick_params annotate quiver contour barh stackplot subplots_adjust axhline axvline semilogx semilogy loglog polar streamplot hexbin pcolor tricontour errorbar clabel set_aspect violinplot set_axis_off spines text hatch plt axis plt.bar() plt.axis import figure pyplot highlight_text pypalettes plt.subplots() xlabel ylabel title legend colorbar savefig tight_layout grid set_xlim set_ylim plot scatter hist boxplot imshow cmap alpha bins tick_params annotate quiver contour barh stackplot subplots_adjust axhline axvline semilogx semilogy loglog polar streamplot hexbin pcolor tricontour errorbar clabel set_aspect violinplot set_axis_off spines text hatch plt axis plt.bar() plt.axis import figure pyplot highlight_text pypalettes plt.subplots() xlabel ylabel title legend colorbar savefig tight_layout grid set_xlim set_ylim plot scatter hist boxplot imshow cmap alpha bins tick_params annotate quiver contour barh stackplot subplots_adjust axhline axvline semilogx semilogy loglog polar streamplot hexbin pcolor tricontour errorbar clabel set_aspect violinplot set_axis_off spines text hatch plt axis plt.bar() plt.axis import figure pyplot highlight_text pypalettes plt.subplots() xlabel ylabel title legend colorbar savefig tight_layout grid set_xlim set_ylim plot scatter hist boxplot imshow cmap alpha bins tick_params annotate quiver contour barh stackplot subplots_adjust axhline axvline semilogx semilogy loglog polar streamplot hexbin pcolor tricontour errorbar clabel set_aspect violinplot set_axis_off spines text hatch plt axis plt.bar() plt.axis import figure pyplot highlight_text pypalettes plt.subplots() xlabel ylabel title legend colorbar savefig tight_layout grid set_xlim set_ylim plot scatter hist boxplot imshow cmap alpha bins tick_params annotate quiver contour barh stackplot subplots_adjust axhline axvline semilogx semilogy loglog polar streamplot hexbin pcolor tricontour errorbar clabel set_aspect violinplot set_axis_off spines text hatch plt axis plt.bar() plt.axis import figure pyplot highlight_text pypalettes plt.subplots() xlabel ylabel title legend colorbar savefig tight_layout grid set_xlim set_ylim plot scatter hist boxplot imshow cmap alpha bins tick_params annotate quiver contour barh stackplot subplots_adjust axhline axvline semilogx semilogy loglog polar streamplot hexbin pcolor tricontour errorbar clabel set_aspect violinplot set_axis_off spines text hatch plt axis plt.bar() plt.axis import figure pyplot highlight_text pypalettes plt.subplots() xlabel ylabel title legend colorbar savefig tight_layout grid set_xlim set_ylim plot scatter hist boxplot imshow cmap alpha bins tick_params annotate quiver contour barh stackplot subplots_adjust axhline axvline semilogx semilogy loglog polar streamplot hexbin pcolor tricontour errorbar clabel set_aspect violinplot set_axis_off spines text hatch plt axis plt.bar() plt.axis import figure pyplot highlight_text pypalettes plt.subplots() xlabel ylabel title legend colorbar savefig tight_layout grid set_xlim set_ylim plot scatter hist boxplot imshow cmap alpha bins tick_params annotate quiver contour barh stackplot subplots_adjust axhline axvline semilogx semilogy loglog polar streamplot hexbin pcolor tricontour errorbar clabel set_aspect violinplot set_axis_off spines text hatch plt axis plt.bar() plt.axis import figure pyplot highlight_text pypalettes plt.subplots() xlabel ylabel title legend colorbar savefig tight_layout grid set_xlim set_ylim plot scatter hist boxplot imshow cmap alpha bins tick_params annotate quiver contour barh stackplot subplots_adjust axhline axvline semilogx semilogy loglog polar streamplot hexbin pcolor tricontour errorbar clabel set_aspect violinplot set_axis_off spines text hatch plt axis plt.bar() plt.axis import figure pyplot highlight_text pypalettes plt.subplots() xlabel ylabel title legend colorbar savefig tight_layout grid set_xlim set_ylim plot scatter hist boxplot imshow cmap alpha bins tick_params annotate quiver contour barh stackplot subplots_adjust axhline axvline semilogx semilogy loglog polar streamplot hexbin pcolor tricontour errorbar clabel set_aspect violinplot set_axis_off spines text hatch plt axis plt.bar() plt.axis import figure pyplot highlight_text pypalettes plt.subplots() xlabel ylabel title legend colorbar savefig tight_layout grid set_xlim set_ylim plot scatter hist boxplot imshow cmap alpha bins tick_params annotate quiver contour barh stackplot subplots_adjust axhline axvline semilogx semilogy loglog polar streamplot hexbin pcolor tricontour errorbar clabel set_aspect violinplot set_axis_off spines text hatch plt axis plt.bar() plt.axis import figure pyplot highlight_text pypalettes plt.subplots() xlabel ylabel title legend colorbar savefig tight_layout grid set_xlim set_ylim plot scatter hist boxplot imshow cmap alpha bins tick_params annotate quiver contour barh stackplot subplots_adjust axhline axvline semilogx semilogy loglog polar streamplot hexbin pcolor tricontour errorbar clabel set_aspect violinplot set_axis_off spines text hatch plt axis plt.bar() plt.axis import figure pyplot highlight_text pypalettes plt.subplots() xlabel ylabel title legend colorbar savefig tight_layout grid set_xlim set_ylim plot scatter hist boxplot imshow cmap alpha bins tick_params annotate quiver contour barh stackplot subplots_adjust axhline axvline semilogx semilogy loglog polar streamplot hexbin pcolor tricontour errorbar clabel set_aspect violinplot set_axis_off spines text hatch plt axis plt.bar() plt.axis import figure pyplot highlight_text pypalettes plt.subplots() xlabel ylabel title legend colorbar savefig tight_layout grid set_xlim set_ylim plot scatter hist boxplot imshow cmap alpha bins tick_params annotate quiver contour barh stackplot subplots_adjust axhline axvline semilogx semilogy loglog polar streamplot hexbin pcolor tricontour errorbar clabel set_aspect violinplot set_axis_off spines text hatch plt axis plt.bar() plt.axis import figure pyplot highlight_text pypalettes plt.subplots() xlabel ylabel title legend colorbar savefig tight_layout grid set_xlim set_ylim plot scatter hist boxplot imshow cmap alpha bins tick_params annotate quiver contour barh stackplot subplots_adjust axhline axvline semilogx semilogy loglog polar streamplot hexbin pcolor tricontour errorbar clabel set_aspect violinplot set_axis_off spines text hatch plt axis plt.bar() plt.axis import figure pyplot highlight_text pypalettes plt.subplots() xlabel ylabel title legend colorbar savefig tight_layout grid set_xlim set_ylim plot scatter hist boxplot imshow cmap alpha bins tick_params annotate quiver contour barh stackplot subplots_adjust axhline axvline semilogx semilogy loglog polar streamplot hexbin pcolor tricontour errorbar clabel set_aspect violinplot set_axis_off spines text hatch plt axis plt.bar() plt.axis import figure pyplot highlight_text pypalettes plt.subplots() xlabel ylabel title legend colorbar savefig tight_layout grid set_xlim set_ylim plot scatter hist boxplot imshow cmap alpha bins tick_params annotate quiver contour barh stackplot subplots_adjust axhline axvline semilogx semilogy loglog polar streamplot hexbin pcolor tricontour errorbar clabel set_aspect violinplot set_axis_off spines text hatch plt axis plt.bar() plt.axis import figure pyplot highlight_text pypalettes plt.subplots() xlabel ylabel title legend colorbar savefig tight_layout grid set_xlim set_ylim plot scatter hist boxplot imshow cmap alpha bins tick_params annotate quiver contour barh stackplot subplots_adjust axhline axvline semilogx semilogy loglog polar streamplot hexbin pcolor tricontour errorbar clabel set_aspect violinplot set_axis_off spines text hatch plt axis plt.bar() plt.axis import figure pyplot highlight_text pypalettes plt.subplots() xlabel ylabel title legend colorbar savefig tight_layout grid set_xlim set_ylim plot scatter hist boxplot imshow cmap alpha bins tick_params annotate quiver contour barh stackplot subplots_adjust axhline axvline semilogx semilogy loglog polar streamplot hexbin pcolor tricontour errorbar clabel set_aspect violinplot set_axis_off spines text hatch plt axis plt.bar() plt.axis import figure pyplot highlight_text pypalettes plt.subplots() xlabel ylabel title legend colorbar savefig tight_layout grid set_xlim set_ylim plot scatter hist boxplot imshow cmap alpha bins tick_params annotate quiver contour barh stackplot subplots_adjust axhline axvline semilogx semilogy loglog polar streamplot hexbin pcolor tricontour errorbar clabel set_aspect violinplot set_axis_off spines text hatch plt axis plt.bar() plt.axis import figure pyplot highlight_text pypalettes plt.subplots() xlabel ylabel title legend colorbar savefig tight_layout grid set_xlim set_ylim plot scatter hist boxplot imshow cmap alpha bins tick_params annotate quiver contour barh stackplot subplots_adjust axhline axvline semilogx semilogy loglog polar streamplot hexbin pcolor tricontour errorbar clabel set_aspect violinplot set_axis_off spines text hatch plt axis plt.bar() plt.axis import figure pyplot highlight_text pypalettes plt.subplots() xlabel ylabel title legend colorbar savefig tight_layout grid set_xlim set_ylim plot scatter hist boxplot imshow cmap alpha bins tick_params annotate quiver contour barh stackplot subplots_adjust axhline axvline semilogx semilogy loglog polar streamplot hexbin pcolor tricontour errorbar clabel set_aspect violinplot set_axis_off spines text hatch plt axis plt.bar() plt.axis import figure pyplot highlight_text pypalettes plt.subplots() xlabel ylabel title legend colorbar savefig tight_layout grid set_xlim set_ylim plot scatter hist boxplot imshow cmap alpha bins tick_params annotate quiver contour barh stackplot subplots_adjust axhline axvline semilogx semilogy loglog polar streamplot hexbin pcolor tricontour errorbar clabel set_aspect violinplot set_axis_off spines text hatch plt axis plt.bar() plt.axis import figure pyplot highlight_text pypalettes plt.subplots() xlabel ylabel title legend colorbar savefig tight_layout grid set_xlim set_ylim plot scatter hist boxplot imshow cmap alpha bins tick_params annotate quiver contour barh stackplot subplots_adjust axhline axvline semilogx semilogy loglog polar streamplot hexbin pcolor tricontour errorbar clabel set_aspect violinplot set_axis_off spines text hatch plt axis plt.bar() plt.axis import figure pyplot highlight_text pypalettes plt.subplots() xlabel ylabel title legend colorbar savefig tight_layout grid set_xlim set_ylim plot scatter hist boxplot imshow cmap alpha bins tick_params annotate quiver contour barh stackplot subplots_adjust axhline axvline semilogx semilogy loglog polar streamplot hexbin pcolor tricontour errorbar clabel set_aspect violinplot set_axis_off spines text hatch plt axis plt.bar() plt.axis import figure pyplot highlight_text pypalettes plt.subplots() xlabel ylabel title legend colorbar savefig tight_layout grid set_xlim set_ylim plot scatter hist boxplot imshow cmap alpha bins tick_params annotate quiver contour barh stackplot subplots_adjust axhline axvline semilogx semilogy loglog polar streamplot hexbin pcolor tricontour errorbar clabel set_aspect violinplot set_axis_off spines text hatch plt axis plt.bar() plt.axis import figure pyplot highlight_text pypalettes plt.subplots() xlabel ylabel title legend colorbar savefig tight_layout grid set_xlim set_ylim plot scatter hist boxplot imshow cmap alpha bins tick_params annotate quiver contour barh stackplot subplots_adjust axhline axvline semilogx semilogy loglog polar streamplot hexbin pcolor tricontour errorbar clabel set_aspect violinplot set_axis_off spines text hatch plt axis plt.bar() plt.axis import figure pyplot highlight_text pypalettes plt.subplots() xlabel ylabel title legend colorbar savefig tight_layout grid set_xlim set_ylim plot scatter hist boxplot imshow cmap alpha bins tick_params annotate quiver contour barh stackplot subplots_adjust axhline axvline semilogx semilogy loglog polar streamplot hexbin pcolor tricontour errorbar clabel set_aspect violinplot set_axis_off spines text hatch plt axis plt.bar() plt.axis import figure pyplot highlight_text pypalettes plt.subplots() xlabel ylabel title legend colorbar savefig tight_layout grid set_xlim set_ylim plot scatter hist boxplot imshow cmap alpha bins tick_params annotate quiver contour barh stackplot subplots_adjust axhline axvline semilogx semilogy loglog polar streamplot hexbin pcolor tricontour errorbar clabel set_aspect violinplot set_axis_off spines text hatch plt axis plt.bar() plt.axis import figure pyplot highlight_text pypalettes plt.subplots() xlabel ylabel title legend colorbar savefig tight_layout grid set_xlim set_ylim plot scatter hist boxplot imshow cmap alpha bins tick_params annotate quiver contour barh stackplot subplots_adjust axhline axvline semilogx semilogy loglog polar streamplot hexbin pcolor tricontour errorbar clabel set_aspect violinplot set_axis_off spines text hatch plt axis plt.bar() plt.axis import figure pyplot highlight_text pypalettes plt.subplots() xlabel ylabel title legend colorbar savefig tight_layout grid set_xlim set_ylim plot scatter hist boxplot imshow cmap alpha bins tick_params annotate quiver contour barh stackplot subplots_adjust axhline axvline semilogx semilogy loglog polar streamplot hexbin pcolor tricontour errorbar clabel set_aspect violinplot set_axis_off spines text hatch plt axis plt.bar() plt.axis import figure pyplot highlight_text pypalettes plt.subplots() xlabel ylabel title legend colorbar savefig tight_layout grid set_xlim set_ylim plot scatter hist boxplot imshow cmap alpha bins tick_params annotate quiver contour barh stackplot subplots_adjust axhline axvline semilogx semilogy loglog polar streamplot hexbin pcolor tricontour errorbar clabel set_aspect violinplot set_axis_off spines text hatch plt axis plt.bar() plt.axis import figure pyplot highlight_text pypalettes plt.subplots() xlabel ylabel title legend colorbar savefig tight_layout grid set_xlim set_ylim plot scatter hist boxplot imshow cmap alpha bins tick_params annotate quiver contour barh stackplot subplots_adjust axhline axvline semilogx semilogy loglog polar streamplot hexbin pcolor tricontour errorbar clabel set_aspect violinplot set_axis_off spines text hatch plt axis plt.bar() plt.axis import figure pyplot highlight_text pypalettes plt.subplots() xlabel ylabel title legend colorbar savefig tight_layout grid set_xlim set_ylim plot scatter hist boxplot imshow cmap alpha bins tick_params annotate quiver contour barh stackplot subplots_adjust axhline axvline semilogx semilogy loglog polar streamplot hexbin pcolor tricontour errorbar clabel set_aspect violinplot set_axis_off spines text hatch plt axis plt.bar() plt.axis import figure pyplot highlight_text pypalettes plt.subplots() xlabel ylabel title legend colorbar savefig tight_layout grid set_xlim set_ylim plot scatter hist boxplot imshow cmap alpha bins tick_params annotate quiver contour barh stackplot subplots_adjust axhline axvline semilogx semilogy loglog polar streamplot hexbin pcolor tricontour errorbar clabel set_aspect violinplot set_axis_off spines text hatch plt axis plt.bar() plt.axis import figure pyplot highlight_text pypalettes plt.subplots() xlabel ylabel title legend colorbar savefig tight_layout grid set_xlim set_ylim plot scatter hist boxplot imshow cmap alpha bins tick_params annotate quiver contour barh stackplot subplots_adjust axhline axvline semilogx semilogy loglog polar streamplot hexbin pcolor tricontour errorbar clabel set_aspect violinplot set_axis_off spines text hatch plt axis plt.bar() plt.axis import figure pyplot highlight_text pypalettes plt.subplots() xlabel ylabel title legend colorbar savefig tight_layout grid set_xlim set_ylim plot scatter hist boxplot imshow cmap alpha bins tick_params annotate quiver contour barh stackplot subplots_adjust axhline axvline semilogx semilogy loglog polar streamplot hexbin pcolor tricontour errorbar clabel set_aspect violinplot set_axis_off spines text hatch plt axis plt.bar() plt.axis import figure pyplot highlight_text pypalettes plt.subplots() xlabel ylabel title legend colorbar savefig tight_layout grid set_xlim set_ylim plot scatter hist boxplot imshow cmap alpha bins tick_params annotate quiver contour barh stackplot subplots_adjust axhline axvline semilogx semilogy loglog polar streamplot hexbin pcolor tricontour errorbar clabel set_aspect violinplot set_axis_off spines text hatch plt axis plt.bar() plt.axis import figure pyplot highlight_text pypalettes plt.subplots() xlabel ylabel title legend colorbar savefig tight_layout grid set_xlim set_ylim plot scatter hist boxplot imshow cmap alpha bins tick_params annotate quiver contour barh stackplot subplots_adjust axhline axvline semilogx semilogy loglog polar streamplot hexbin pcolor tricontour errorbar clabel set_aspect violinplot set_axis_off spines text hatch plt axis plt.bar() plt.axis import figure pyplot highlight_text pypalettes plt.subplots() xlabel ylabel title legend colorbar savefig tight_layout grid set_xlim set_ylim plot scatter hist boxplot imshow cmap alpha bins tick_params annotate quiver contour barh stackplot subplots_adjust axhline axvline semilogx semilogy loglog polar streamplot hexbin pcolor tricontour errorbar clabel set_aspect violinplot set_axis_off spines text hatch plt axis plt.bar() plt.axis import figure pyplot highlight_text pypalettes plt.subplots() xlabel ylabel title legend colorbar savefig tight_layout grid set_xlim set_ylim plot scatter hist boxplot imshow cmap alpha bins tick_params annotate quiver contour barh stackplot subplots_adjust axhline axvline semilogx semilogy loglog polar streamplot hexbin pcolor tricontour errorbar clabel set_aspect violinplot set_axis_off spines text hatch plt axis plt.bar() plt.axis import figure pyplot highlight_text pypalettes plt.subplots() xlabel ylabel title legend colorbar savefig tight_layout grid set_xlim set_ylim plot scatter hist boxplot imshow cmap alpha bins tick_params annotate quiver contour barh stackplot subplots_adjust axhline axvline semilogx semilogy loglog polar streamplot hexbin pcolor tricontour errorbar clabel set_aspect violinplot set_axis_off spines text hatch plt axis plt.bar() plt.axis import figure pyplot highlight_text pypalettes plt.subplots() xlabel ylabel title legend colorbar savefig tight_layout grid set_xlim set_ylim plot scatter hist boxplot imshow cmap alpha bins tick_params annotate quiver contour barh stackplot subplots_adjust axhline axvline semilogx semilogy loglog polar streamplot hexbin pcolor tricontour errorbar clabel set_aspect violinplot set_axis_off spines text hatch plt axis plt.bar() plt.axis import figure pyplot highlight_text pypalettes plt.subplots() xlabel ylabel title legend colorbar savefig tight_layout grid set_xlim set_ylim plot scatter hist boxplot imshow cmap alpha bins tick_params annotate quiver contour barh stackplot subplots_adjust axhline axvline semilogx semilogy loglog polar streamplot hexbin pcolor tricontour errorbar clabel set_aspect violinplot set_axis_off spines text hatch plt axis plt.bar() plt.axis import figure pyplot highlight_text pypalettes plt.subplots() xlabel ylabel title legend colorbar savefig tight_layout grid set_xlim set_ylim plot scatter hist boxplot imshow cmap alpha bins tick_params annotate quiver contour barh stackplot subplots_adjust axhline axvline semilogx semilogy loglog polar streamplot hexbin pcolor tricontour errorbar clabel set_aspect violinplot set_axis_off spines text hatch plt axis plt.bar() plt.axis import figure pyplot highlight_text pypalettes plt.subplots() xlabel ylabel title legend colorbar savefig tight_layout grid set_xlim set_ylim plot scatter hist boxplot imshow cmap alpha bins tick_params annotate quiver contour barh stackplot subplots_adjust axhline axvline semilogx semilogy loglog polar streamplot hexbin pcolor tricontour errorbar clabel set_aspect violinplot set_axis_off spines text hatch plt axis plt.bar() plt.axis import figure pyplot highlight_text pypalettes plt.subplots() xlabel ylabel title legend colorbar savefig tight_layout grid set_xlim set_ylim plot scatter hist boxplot imshow cmap alpha bins tick_params annotate quiver contour barh stackplot subplots_adjust axhline axvline semilogx semilogy loglog polar streamplot hexbin pcolor tricontour errorbar clabel set_aspect violinplot set_axis_off spines text hatch plt axis plt.bar() plt.axis import figure pyplot highlight_text pypalettes plt.subplots() xlabel ylabel title legend colorbar savefig tight_layout grid set_xlim set_ylim plot scatter hist boxplot imshow cmap alpha bins tick_params annotate quiver contour barh stackplot subplots_adjust axhline axvline semilogx semilogy loglog polar streamplot hexbin pcolor tricontour errorbar clabel set_aspect violinplot set_axis_off spines text hatch plt axis plt.bar() plt.axis import figure pyplot highlight_text pypalettes plt.subplots() xlabel ylabel title legend colorbar savefig tight_layout grid set_xlim set_ylim plot scatter hist boxplot imshow cmap alpha bins tick_params annotate quiver contour barh stackplot subplots_adjust axhline axvline semilogx semilogy loglog polar streamplot hexbin pcolor tricontour errorbar clabel set_aspect violinplot set_axis_off spines text hatch plt axis plt.bar() plt.axis import figure pyplot highlight_text pypalettes plt.subplots() xlabel ylabel title legend colorbar savefig tight_layout grid set_xlim set_ylim plot scatter hist boxplot imshow cmap alpha bins tick_params annotate quiver contour barh stackplot subplots_adjust axhline axvline semilogx semilogy loglog polar streamplot hexbin pcolor tricontour errorbar clabel set_aspect violinplot set_axis_off spines text hatch plt axis plt.bar() plt.axis import figure pyplot highlight_text pypalettes plt.subplots() xlabel ylabel title legend colorbar savefig tight_layout grid set_xlim set_ylim plot scatter hist boxplot imshow cmap alpha bins tick_params annotate quiver contour barh stackplot subplots_adjust axhline axvline semilogx semilogy loglog polar streamplot hexbin pcolor tricontour errorbar clabel set_aspect violinplot set_axis_off spines text hatch plt axis plt.bar() plt.axis import figure pyplot highlight_text pypalettes plt.subplots() xlabel ylabel title legend colorbar savefig tight_layout grid set_xlim set_ylim plot scatter hist boxplot imshow cmap alpha bins tick_params annotate quiver contour barh stackplot subplots_adjust axhline axvline semilogx semilogy loglog polar streamplot hexbin pcolor tricontour errorbar clabel set_aspect violinplot set_axis_off spines text hatch plt axis plt.bar() plt.axis import figure pyplot highlight_text pypalettes plt.subplots() xlabel ylabel title legend colorbar savefig tight_layout grid set_xlim set_ylim plot scatter hist boxplot imshow cmap alpha bins tick_params annotate quiver contour barh stackplot subplots_adjust axhline axvline semilogx semilogy loglog polar streamplot hexbin pcolor tricontour errorbar clabel set_aspect violinplot set_axis_off spines text hatch plt axis plt.bar() plt.axis import figure pyplot highlight_text pypalettes plt.subplots() xlabel ylabel title legend colorbar savefig tight_layout grid set_xlim set_ylim plot scatter hist boxplot imshow cmap alpha bins tick_params annotate quiver contour barh stackplot subplots_adjust axhline axvline semilogx semilogy loglog polar streamplot hexbin pcolor tricontour errorbar clabel set_aspect violinplot set_axis_off spines text hatch plt axis plt.bar() plt.axis import figure pyplot highlight_text pypalettes plt.subplots() xlabel ylabel title legend colorbar savefig tight_layout grid set_xlim set_ylim plot scatter hist boxplot imshow cmap alpha bins tick_params annotate quiver contour barh stackplot subplots_adjust axhline axvline semilogx semilogy loglog polar streamplot hexbin pcolor tricontour errorbar clabel set_aspect violinplot set_axis_off spines text hatch plt axis plt.bar() plt.axis import figure pyplot highlight_text pypalettes plt.subplots() xlabel ylabel title legend colorbar savefig tight_layout grid set_xlim set_ylim plot scatter hist boxplot imshow cmap alpha bins tick_params annotate quiver contour barh stackplot subplots_adjust axhline axvline semilogx semilogy loglog polar streamplot hexbin pcolor tricontour errorbar clabel set_aspect violinplot set_axis_off spines text hatch plt axis plt.bar() plt.axis import figure pyplot highlight_text pypalettes plt.subplots() xlabel ylabel title legend colorbar savefig tight_layout grid set_xlim set_ylim plot scatter hist boxplot imshow cmap alpha bins tick_params annotate quiver contour barh stackplot subplots_adjust axhline axvline semilogx semilogy loglog polar streamplot hexbin pcolor tricontour errorbar clabel set_aspect violinplot set_axis_off spines text hatch plt axis plt.bar() plt.axis import figure pyplot highlight_text pypalettes plt.subplots() xlabel ylabel title legend colorbar savefig tight_layout grid set_xlim set_ylim plot scatter hist boxplot imshow cmap alpha bins tick_params annotate quiver contour barh stackplot subplots_adjust axhline axvline semilogx semilogy loglog polar streamplot hexbin pcolor tricontour errorbar clabel set_aspect violinplot set_axis_off spines text hatch plt axis plt.bar() plt.axis import figure pyplot highlight_text pypalettes plt.subplots() xlabel ylabel title legend colorbar savefig tight_layout grid set_xlim set_ylim plot scatter hist boxplot imshow cmap alpha bins tick_params annotate quiver contour barh stackplot subplots_adjust axhline axvline semilogx semilogy loglog polar streamplot hexbin pcolor tricontour errorbar clabel set_aspect violinplot set_axis_off spines text hatch plt axis plt.bar() plt.axis import figure pyplot highlight_text pypalettes plt.subplots() xlabel ylabel title legend colorbar savefig tight_layout grid set_xlim set_ylim plot scatter hist boxplot imshow cmap alpha bins tick_params annotate quiver contour barh stackplot subplots_adjust axhline axvline semilogx semilogy loglog polar streamplot hexbin pcolor tricontour errorbar clabel set_aspect violinplot set_axis_off spines text hatch plt axis plt.bar() plt.axis import figure pyplot highlight_text pypalettes plt.subplots() xlabel ylabel title legend colorbar savefig tight_layout grid set_xlim set_ylim plot scatter hist boxplot imshow cmap alpha bins tick_params annotate quiver contour barh stackplot subplots_adjust axhline axvline semilogx semilogy loglog polar streamplot hexbin pcolor tricontour errorbar clabel set_aspect violinplot set_axis_off spines text hatch plt axis plt.bar() plt.axis import figure pyplot highlight_text pypalettes plt.subplots() xlabel ylabel title legend colorbar savefig tight_layout grid set_xlim set_ylim plot scatter hist boxplot imshow cmap alpha bins tick_params annotate quiver contour barh stackplot subplots_adjust axhline axvline semilogx semilogy loglog polar streamplot hexbin pcolor tricontour errorbar clabel set_aspect violinplot set_axis_off spines text hatch plt axis plt.bar() plt.axis import figure pyplot highlight_text pypalettes plt.subplots() xlabel ylabel title legend colorbar savefig tight_layout grid set_xlim set_ylim plot scatter hist boxplot imshow cmap alpha bins tick_params annotate quiver contour barh stackplot subplots_adjust axhline axvline semilogx semilogy loglog polar streamplot hexbin pcolor tricontour errorbar clabel set_aspect violinplot set_axis_off spines text hatch plt axis plt.bar() plt.axis import figure pyplot highlight_text pypalettes plt.subplots() xlabel ylabel title legend colorbar savefig tight_layout grid set_xlim set_ylim plot scatter hist boxplot imshow cmap alpha bins tick_params annotate quiver contour barh stackplot subplots_adjust axhline axvline semilogx semilogy loglog polar streamplot hexbin pcolor tricontour errorbar clabel set_aspect violinplot set_axis_off spines text hatch plt axis plt.bar() plt.axis import figure pyplot highlight_text pypalettes plt.subplots() xlabel ylabel title legend colorbar savefig tight_layout grid set_xlim set_ylim plot scatter hist boxplot imshow cmap alpha bins tick_params annotate quiver contour barh stackplot subplots_adjust axhline axvline semilogx semilogy loglog polar streamplot hexbin pcolor tricontour errorbar clabel set_aspect violinplot set_axis_off spines text hatch plt axis plt.bar() plt.axis import figure pyplot highlight_text pypalettes plt.subplots() xlabel ylabel title legend colorbar savefig tight_layout grid set_xlim set_ylim plot scatter hist boxplot imshow cmap alpha bins tick_params annotate quiver contour barh stackplot subplots_adjust axhline axvline semilogx semilogy loglog polar streamplot hexbin pcolor tricontour errorbar clabel set_aspect violinplot set_axis_off spines text hatch plt axis plt.bar() plt.axis import figure pyplot highlight_text pypalettes plt.subplots() xlabel ylabel title legend colorbar savefig tight_layout grid set_xlim set_ylim plot scatter hist boxplot imshow cmap alpha bins tick_params annotate quiver contour barh stackplot subplots_adjust axhline axvline semilogx semilogy loglog polar streamplot hexbin pcolor tricontour errorbar clabel set_aspect violinplot set_axis_off spines text hatch plt axis plt.bar() plt.axis import figure pyplot highlight_text pypalettes plt.subplots() xlabel ylabel title legend colorbar savefig tight_layout grid set_xlim set_ylim plot scatter hist boxplot imshow cmap alpha bins tick_params annotate quiver contour barh stackplot subplots_adjust axhline axvline semilogx semilogy loglog polar streamplot hexbin pcolor tricontour errorbar clabel set_aspect violinplot set_axis_off spines text hatch plt axis plt.bar() plt.axis import figure pyplot highlight_text pypalettes plt.subplots() xlabel ylabel title legend colorbar savefig tight_layout grid set_xlim set_ylim plot scatter hist boxplot imshow cmap alpha bins tick_params annotate quiver contour barh stackplot subplots_adjust axhline axvline semilogx semilogy loglog polar streamplot hexbin pcolor tricontour errorbar clabel set_aspect violinplot set_axis_off spines text hatch plt axis plt.bar() plt.axis import figure pyplot highlight_text pypalettes plt.subplots() xlabel ylabel title legend colorbar savefig tight_layout grid set_xlim set_ylim plot scatter hist boxplot imshow cmap alpha bins tick_params annotate quiver contour barh stackplot subplots_adjust axhline axvline semilogx semilogy loglog polar streamplot hexbin pcolor tricontour errorbar clabel set_aspect violinplot set_axis_off spines text hatch plt axis plt.bar() plt.axis import figure pyplot highlight_text pypalettes plt.subplots() xlabel ylabel title legend colorbar savefig tight_layout grid set_xlim set_ylim plot scatter hist boxplot imshow cmap alpha bins tick_params annotate quiver contour barh stackplot subplots_adjust axhline axvline semilogx semilogy loglog polar streamplot hexbin pcolor tricontour errorbar clabel set_aspect violinplot set_axis_off spines text hatch plt axis plt.bar() plt.axis import figure pyplot highlight_text pypalettes plt.subplots() xlabel ylabel title legend colorbar savefig tight_layout grid set_xlim set_ylim plot scatter hist boxplot imshow cmap alpha bins tick_params annotate quiver contour barh stackplot subplots_adjust axhline axvline semilogx semilogy loglog polar streamplot hexbin pcolor tricontour errorbar clabel set_aspect violinplot set_axis_off spines text hatch plt axis plt.bar() plt.axis import figure pyplot highlight_text pypalettes plt.subplots() xlabel ylabel title legend colorbar savefig tight_layout grid set_xlim set_ylim plot scatter hist boxplot imshow cmap alpha bins tick_params annotate quiver contour barh stackplot subplots_adjust axhline axvline semilogx semilogy loglog polar streamplot hexbin pcolor tricontour errorbar clabel set_aspect violinplot set_axis_off spines text hatch plt axis plt.bar() plt.axis import figure pyplot highlight_text pypalettes plt.subplots() xlabel ylabel title legend colorbar savefig tight_layout grid set_xlim set_ylim plot scatter hist boxplot imshow cmap alpha bins tick_params annotate quiver contour barh stackplot subplots_adjust axhline axvline semilogx semilogy loglog polar streamplot hexbin pcolor tricontour errorbar clabel set_aspect violinplot set_axis_off spines text hatch plt axis plt.bar() plt.axis import figure pyplot highlight_text pypalettes plt.subplots() xlabel ylabel title legend colorbar savefig tight_layout grid set_xlim set_ylim plot scatter hist boxplot imshow cmap alpha bins tick_params annotate quiver contour barh stackplot subplots_adjust axhline axvline semilogx semilogy loglog polar streamplot hexbin pcolor tricontour errorbar clabel set_aspect violinplot set_axis_off spines text hatch plt axis plt.bar() plt.axis import figure pyplot highlight_text pypalettes plt.subplots() xlabel ylabel title legend colorbar savefig tight_layout grid set_xlim set_ylim plot scatter hist boxplot imshow cmap alpha bins tick_params annotate quiver contour barh stackplot subplots_adjust axhline axvline semilogx semilogy loglog polar streamplot hexbin pcolor tricontour errorbar clabel set_aspect violinplot set_axis_off spines text hatch plt axis plt.bar() plt.axis import figure pyplot highlight_text pypalettes plt.subplots() xlabel ylabel title legend colorbar savefig tight_layout grid set_xlim set_ylim plot scatter hist boxplot imshow cmap alpha bins tick_params annotate quiver contour barh stackplot subplots_adjust axhline axvline semilogx semilogy loglog polar streamplot hexbin pcolor tricontour errorbar clabel set_aspect violinplot set_axis_off spines text hatch plt axis plt.bar() plt.axis import figure pyplot highlight_text pypalettes plt.subplots() xlabel ylabel title legend colorbar savefig tight_layout grid set_xlim set_ylim plot scatter hist boxplot imshow cmap alpha bins tick_params annotate quiver contour barh stackplot subplots_adjust axhline axvline semilogx semilogy loglog polar streamplot hexbin pcolor tricontour errorbar clabel set_aspect violinplot set_axis_off spines text hatch plt axis plt.bar() plt.axis import figure pyplot highlight_text pypalettes plt.subplots() xlabel ylabel title legend colorbar savefig tight_layout grid set_xlim set_ylim plot scatter hist boxplot imshow cmap alpha bins tick_params annotate quiver contour barh stackplot subplots_adjust axhline axvline semilogx semilogy loglog polar streamplot hexbin pcolor tricontour errorbar clabel set_aspect violinplot set_axis_off spines text hatch plt axis plt.bar() plt.axis import figure pyplot highlight_text pypalettes plt.subplots() xlabel ylabel title legend colorbar savefig tight_layout grid set_xlim set_ylim plot scatter hist boxplot imshow cmap alpha bins tick_params annotate quiver contour barh stackplot subplots_adjust axhline axvline semilogx semilogy loglog polar streamplot hexbin pcolor tricontour errorbar clabel set_aspect violinplot set_axis_off spines text hatch plt axis plt.bar() plt.axis import figure pyplot highlight_text pypalettes plt.subplots() xlabel ylabel title legend colorbar savefig tight_layout grid set_xlim set_ylim plot scatter hist boxplot imshow cmap alpha bins tick_params annotate quiver contour barh stackplot subplots_adjust axhline axvline semilogx semilogy loglog polar streamplot hexbin pcolor tricontour errorbar clabel set_aspect violinplot set_axis_off spines text hatch plt axis plt.bar() plt.axis import figure pyplot highlight_text pypalettes plt.subplots() xlabel ylabel title legend colorbar savefig tight_layout grid set_xlim set_ylim plot scatter hist boxplot imshow cmap alpha bins tick_params annotate quiver contour barh stackplot subplots_adjust axhline axvline semilogx semilogy loglog polar streamplot hexbin pcolor tricontour errorbar clabel set_aspect violinplot set_axis_off spines text hatch plt axis plt.bar() plt.axis import figure pyplot highlight_text pypalettes plt.subplots() xlabel ylabel title legend colorbar savefig tight_layout grid set_xlim set_ylim plot scatter hist boxplot imshow cmap alpha bins tick_params annotate quiver contour barh stackplot subplots_adjust axhline axvline semilogx semilogy loglog polar streamplot hexbin pcolor tricontour errorbar clabel set_aspect violinplot set_axis_off spines text hatch plt axis plt.bar() plt.axis import figure pyplot highlight_text pypalettes plt.subplots() xlabel ylabel title legend colorbar savefig tight_layout grid set_xlim set_ylim plot scatter hist boxplot imshow cmap alpha bins tick_params annotate quiver contour barh stackplot subplots_adjust axhline axvline semilogx semilogy loglog polar streamplot hexbin pcolor tricontour errorbar clabel set_aspect violinplot set_axis_off spines text hatch plt axis plt.bar() plt.axis import figure pyplot highlight_text pypalettes plt.subplots() xlabel ylabel title legend colorbar savefig tight_layout grid set_xlim set_ylim plot scatter hist boxplot imshow cmap alpha bins tick_params annotate quiver contour barh stackplot subplots_adjust axhline axvline semilogx semilogy loglog polar streamplot hexbin pcolor tricontour errorbar clabel set_aspect violinplot set_axis_off spines text hatch plt axis plt.bar() plt.axis import figure pyplot highlight_text pypalettes plt.subplots() xlabel ylabel title legend colorbar savefig tight_layout grid set_xlim set_ylim plot scatter hist boxplot imshow cmap alpha bins tick_params annotate quiver contour barh stackplot subplots_adjust axhline axvline semilogx semilogy loglog polar streamplot hexbin pcolor tricontour errorbar clabel set_aspect violinplot set_axis_off spines text hatch plt axis plt.bar() plt.axis import figure pyplot highlight_text pypalettes plt.subplots() xlabel ylabel title legend colorbar savefig tight_layout grid set_xlim set_ylim plot scatter hist boxplot imshow cmap alpha bins tick_params annotate quiver contour barh stackplot subplots_adjust axhline axvline semilogx semilogy loglog polar streamplot hexbin pcolor tricontour errorbar clabel set_aspect violinplot set_axis_off spines text hatch plt axis plt.bar() plt.axis import figure pyplot highlight_text pypalettes plt.subplots() xlabel ylabel title legend colorbar savefig tight_layout grid set_xlim set_ylim plot scatter hist boxplot imshow cmap alpha bins tick_params annotate quiver contour barh stackplot subplots_adjust axhline axvline semilogx semilogy loglog polar streamplot hexbin pcolor tricontour errorbar clabel set_aspect violinplot set_axis_off spines text hatch plt axis plt.bar() plt.axis import figure pyplot highlight_text pypalettes plt.subplots() xlabel ylabel title legend colorbar savefig tight_layout grid set_xlim set_ylim plot scatter hist boxplot imshow cmap alpha bins tick_params annotate quiver contour barh stackplot subplots_adjust axhline axvline semilogx semilogy loglog polar streamplot hexbin pcolor tricontour errorbar clabel set_aspect violinplot set_axis_off spines text hatch plt axis plt.bar() plt.axis import figure pyplot highlight_text pypalettes plt.subplots() xlabel ylabel title legend colorbar savefig tight_layout grid set_xlim set_ylim plot scatter hist boxplot imshow cmap alpha bins tick_params annotate quiver contour barh stackplot subplots_adjust axhline axvline semilogx semilogy loglog polar streamplot hexbin pcolor tricontour errorbar clabel set_aspect violinplot set_axis_off spines text hatch plt axis plt.bar() plt.axis import figure pyplot highlight_text pypalettes plt.subplots() xlabel ylabel title legend colorbar savefig tight_layout grid set_xlim set_ylim plot scatter hist boxplot imshow cmap alpha bins tick_params annotate quiver contour barh stackplot subplots_adjust axhline axvline semilogx semilogy loglog polar streamplot hexbin pcolor tricontour errorbar clabel set_aspect violinplot set_axis_off spines text hatch plt axis plt.bar() plt.axis import figure pyplot highlight_text pypalettes plt.subplots() xlabel ylabel title legend colorbar savefig tight_layout grid set_xlim set_ylim plot scatter hist boxplot imshow cmap alpha bins tick_params annotate quiver contour barh stackplot subplots_adjust axhline axvline semilogx semilogy loglog polar streamplot hexbin pcolor tricontour errorbar clabel set_aspect violinplot set_axis_off spines text hatch plt axis plt.bar() plt.axis import figure pyplot highlight_text pypalettes plt.subplots() xlabel ylabel title legend colorbar savefig tight_layout grid set_xlim set_ylim plot scatter hist boxplot imshow cmap alpha bins tick_params annotate quiver contour barh stackplot subplots_adjust axhline axvline semilogx semilogy loglog polar streamplot hexbin pcolor tricontour errorbar clabel set_aspect violinplot set_axis_off spines text hatch plt axis plt.bar() plt.axis import figure pyplot highlight_text pypalettes plt.subplots() xlabel ylabel title legend colorbar savefig tight_layout grid set_xlim set_ylim plot scatter hist boxplot imshow cmap alpha bins tick_params annotate quiver contour barh stackplot subplots_adjust axhline axvline semilogx semilogy loglog polar streamplot hexbin pcolor tricontour errorbar clabel set_aspect violinplot set_axis_off spines text hatch plt axis plt.bar() plt.axis import figure pyplot highlight_text pypalettes plt.subplots() xlabel ylabel title legend colorbar savefig tight_layout grid set_xlim set_ylim plot scatter hist boxplot imshow cmap alpha bins tick_params annotate quiver contour barh stackplot subplots_adjust axhline axvline semilogx semilogy loglog polar streamplot hexbin pcolor tricontour errorbar clabel set_aspect violinplot set_axis_off spines text hatch plt axis plt.bar() plt.axis import figure pyplot highlight_text pypalettes plt.subplots() xlabel ylabel title legend colorbar savefig tight_layout grid set_xlim set_ylim plot scatter hist boxplot imshow cmap alpha bins tick_params annotate quiver contour barh stackplot subplots_adjust axhline axvline semilogx semilogy loglog polar streamplot hexbin pcolor tricontour errorbar clabel set_aspect violinplot set_axis_off spines text hatch plt axis plt.bar() plt.axis import figure pyplot highlight_text pypalettes plt.subplots() xlabel ylabel title legend colorbar savefig tight_layout grid set_xlim set_ylim plot scatter hist boxplot imshow cmap alpha bins tick_params annotate quiver contour barh stackplot subplots_adjust axhline axvline semilogx semilogy loglog polar streamplot hexbin pcolor tricontour errorbar clabel set_aspect violinplot set_axis_off spines text hatch plt axis plt.bar() plt.axis import figure pyplot highlight_text pypalettes plt.subplots() xlabel ylabel title legend colorbar savefig tight_layout grid set_xlim set_ylim plot scatter hist boxplot imshow cmap alpha bins tick_params annotate quiver contour barh stackplot subplots_adjust axhline axvline semilogx semilogy loglog polar streamplot hexbin pcolor tricontour errorbar clabel set_aspect violinplot set_axis_off spines text hatch plt axis plt.bar() plt.axis import figure pyplot highlight_text pypalettes plt.subplots() xlabel ylabel title legend colorbar savefig tight_layout grid set_xlim set_ylim plot scatter hist boxplot imshow cmap alpha bins tick_params annotate quiver contour barh stackplot subplots_adjust axhline axvline semilogx semilogy loglog polar streamplot hexbin pcolor tricontour errorbar clabel set_aspect violinplot set_axis_off spines text hatch plt axis plt.bar() plt.axis import figure pyplot highlight_text pypalettes plt.subplots() xlabel ylabel title legend colorbar savefig tight_layout grid set_xlim set_ylim plot scatter hist boxplot imshow cmap alpha bins tick_params annotate quiver contour barh stackplot subplots_adjust axhline axvline semilogx semilogy loglog polar streamplot hexbin pcolor tricontour errorbar clabel set_aspect violinplot set_axis_off spines text hatch plt axis plt.bar() plt.axis import figure pyplot highlight_text pypalettes plt.subplots() xlabel ylabel title legend colorbar savefig tight_layout grid set_xlim set_ylim plot scatter hist boxplot imshow cmap alpha bins tick_params annotate quiver contour barh stackplot subplots_adjust axhline axvline semilogx semilogy loglog polar streamplot hexbin pcolor tricontour errorbar clabel set_aspect violinplot set_axis_off spines text hatch plt axis plt.bar() plt.axis import figure pyplot highlight_text pypalettes plt.subplots() xlabel ylabel title legend colorbar savefig tight_layout grid set_xlim set_ylim plot scatter hist boxplot imshow cmap alpha bins tick_params annotate quiver contour barh stackplot subplots_adjust axhline axvline semilogx semilogy loglog polar streamplot hexbin pcolor tricontour errorbar clabel set_aspect violinplot set_axis_off spines text hatch plt axis plt.bar() plt.axis import figure pyplot highlight_text pypalettes plt.subplots() xlabel ylabel title legend colorbar savefig tight_layout grid set_xlim set_ylim plot scatter hist boxplot imshow cmap alpha bins tick_params annotate quiver contour barh stackplot subplots_adjust axhline axvline semilogx semilogy loglog polar streamplot hexbin pcolor tricontour errorbar clabel set_aspect violinplot set_axis_off spines text hatch plt axis plt.bar() plt.axis import figure pyplot highlight_text pypalettes plt.subplots() xlabel ylabel title legend colorbar savefig tight_layout grid set_xlim set_ylim plot scatter hist boxplot imshow cmap alpha bins tick_params annotate quiver contour barh stackplot subplots_adjust axhline axvline semilogx semilogy loglog polar streamplot hexbin pcolor tricontour errorbar clabel set_aspect violinplot set_axis_off spines text hatch plt axis plt.bar() plt.axis import figure pyplot highlight_text pypalettes plt.subplots() xlabel ylabel title legend colorbar savefig tight_layout grid set_xlim set_ylim plot scatter hist boxplot imshow cmap alpha bins tick_params annotate quiver contour barh stackplot subplots_adjust axhline axvline semilogx semilogy loglog polar streamplot hexbin pcolor tricontour errorbar clabel set_aspect violinplot set_axis_off spines text hatch plt axis plt.bar() plt.axis import figure pyplot highlight_text pypalettes plt.subplots() xlabel ylabel title legend colorbar savefig tight_layout grid set_xlim set_ylim plot scatter hist boxplot imshow cmap alpha bins tick_params annotate quiver contour barh stackplot subplots_adjust axhline axvline semilogx semilogy loglog polar streamplot hexbin pcolor tricontour errorbar clabel set_aspect violinplot set_axis_off spines text hatch plt axis plt.bar() plt.axis import figure pyplot highlight_text pypalettes plt.subplots() xlabel ylabel title legend colorbar savefig tight_layout grid set_xlim set_ylim plot scatter hist boxplot imshow cmap alpha bins tick_params annotate quiver contour barh stackplot subplots_adjust axhline axvline semilogx semilogy loglog polar streamplot hexbin pcolor tricontour errorbar clabel set_aspect violinplot set_axis_off spines text hatch plt axis plt.bar() plt.axis import figure pyplot highlight_text pypalettes plt.subplots() xlabel ylabel title legend colorbar savefig tight_layout grid set_xlim set_ylim plot scatter hist boxplot imshow cmap alpha bins tick_params annotate quiver contour barh stackplot subplots_adjust axhline axvline semilogx semilogy loglog polar streamplot hexbin pcolor tricontour errorbar clabel set_aspect violinplot set_axis_off spines text hatch plt axis plt.bar() plt.axis import figure pyplot highlight_text pypalettes plt.subplots() xlabel ylabel title legend colorbar savefig tight_layout grid set_xlim set_ylim plot scatter hist boxplot imshow cmap alpha bins tick_params annotate quiver contour barh stackplot subplots_adjust axhline axvline semilogx semilogy loglog polar streamplot hexbin pcolor tricontour errorbar clabel set_aspect violinplot set_axis_off spines text hatch plt axis plt.bar() plt.axis import figure pyplot highlight_text pypalettes plt.subplots() xlabel ylabel title legend colorbar savefig tight_layout grid set_xlim set_ylim plot scatter hist boxplot imshow cmap alpha bins tick_params annotate quiver contour barh stackplot subplots_adjust axhline axvline semilogx semilogy loglog polar streamplot hexbin pcolor tricontour errorbar clabel set_aspect violinplot set_axis_off spines text hatch plt axis plt.bar() plt.axis import figure pyplot highlight_text pypalettes plt.subplots() xlabel ylabel title legend colorbar savefig tight_layout grid set_xlim set_ylim plot scatter hist boxplot imshow cmap alpha bins tick_params annotate quiver contour barh stackplot subplots_adjust axhline axvline semilogx semilogy loglog polar streamplot hexbin pcolor tricontour errorbar clabel set_aspect violinplot set_axis_off spines text hatch plt axis plt.bar() plt.axis import figure pyplot highlight_text pypalettes plt.subplots() xlabel ylabel title legend colorbar savefig tight_layout grid set_xlim set_ylim plot scatter hist boxplot imshow cmap alpha bins tick_params annotate quiver contour barh stackplot subplots_adjust axhline axvline semilogx semilogy loglog polar streamplot hexbin pcolor tricontour errorbar clabel set_aspect violinplot set_axis_off spines text hatch plt axis plt.bar() plt.axis import figure pyplot highlight_text pypalettes plt.subplots() xlabel ylabel title legend colorbar savefig tight_layout grid set_xlim set_ylim plot scatter hist boxplot imshow cmap alpha bins tick_params annotate quiver contour barh stackplot subplots_adjust axhline axvline semilogx semilogy loglog polar streamplot hexbin pcolor tricontour errorbar clabel set_aspect violinplot set_axis_off spines text hatch plt axis plt.bar() plt.axis import figure pyplot highlight_text pypalettes plt.subplots() xlabel ylabel title legend colorbar savefig tight_layout grid set_xlim set_ylim plot scatter hist boxplot imshow cmap alpha bins tick_params annotate quiver contour barh stackplot subplots_adjust axhline axvline semilogx semilogy loglog polar streamplot hexbin pcolor tricontour errorbar clabel set_aspect violinplot set_axis_off spines text hatch plt axis plt.bar() plt.axis import figure pyplot highlight_text pypalettes plt.subplots() xlabel ylabel title legend colorbar savefig tight_layout grid set_xlim set_ylim plot scatter hist boxplot imshow cmap alpha bins tick_params annotate quiver contour barh stackplot subplots_adjust axhline axvline semilogx semilogy loglog polar streamplot hexbin pcolor tricontour errorbar clabel set_aspect violinplot set_axis_off spines text hatch plt axis plt.bar() plt.axis import figure pyplot highlight_text pypalettes plt.subplots() xlabel ylabel title legend colorbar savefig tight_layout grid set_xlim set_ylim plot scatter hist boxplot imshow cmap alpha bins tick_params annotate quiver contour barh stackplot subplots_adjust axhline axvline semilogx semilogy loglog polar streamplot hexbin pcolor tricontour errorbar clabel set_aspect violinplot set_axis_off spines text hatch plt axis plt.bar() plt.axis import figure pyplot highlight_text pypalettes plt.subplots() xlabel ylabel title legend colorbar savefig tight_layout grid set_xlim set_ylim plot scatter hist boxplot imshow cmap alpha bins tick_params annotate quiver contour barh stackplot subplots_adjust axhline axvline semilogx semilogy loglog polar streamplot hexbin pcolor tricontour errorbar clabel set_aspect violinplot set_axis_off spines text hatch plt axis plt.bar() plt.axis import figure pyplot highlight_text pypalettes plt.subplots() xlabel ylabel title legend colorbar savefig tight_layout grid set_xlim set_ylim plot scatter hist boxplot imshow cmap alpha bins tick_params annotate quiver contour barh stackplot subplots_adjust axhline axvline semilogx semilogy loglog polar streamplot hexbin pcolor tricontour errorbar clabel set_aspect violinplot set_axis_off spines text hatch plt axis plt.bar() plt.axis import figure pyplot highlight_text pypalettes plt.subplots() xlabel ylabel title legend colorbar savefig tight_layout grid set_xlim set_ylim plot scatter hist boxplot imshow cmap alpha bins tick_params annotate quiver contour barh stackplot subplots_adjust axhline axvline semilogx semilogy loglog polar streamplot hexbin pcolor tricontour errorbar clabel set_aspect violinplot set_axis_off spines text hatch plt axis plt.bar() plt.axis import figure pyplot highlight_text pypalettes plt.subplots() xlabel ylabel title legend colorbar savefig tight_layout grid set_xlim set_ylim plot scatter hist boxplot imshow cmap alpha bins tick_params annotate quiver contour barh stackplot subplots_adjust axhline axvline semilogx semilogy loglog polar streamplot hexbin pcolor tricontour errorbar clabel set_aspect violinplot set_axis_off spines text hatch plt axis plt.bar() plt.axis import figure pyplot highlight_text pypalettes plt.subplots() xlabel ylabel title legend colorbar savefig tight_layout grid set_xlim set_ylim plot scatter hist boxplot imshow cmap alpha bins tick_params annotate quiver contour barh stackplot subplots_adjust axhline axvline semilogx semilogy loglog polar streamplot hexbin pcolor tricontour errorbar clabel set_aspect violinplot set_axis_off spines text hatch plt axis plt.bar() plt.axis import figure pyplot highlight_text pypalettes plt.subplots() xlabel ylabel title legend colorbar savefig tight_layout grid set_xlim set_ylim plot scatter hist boxplot imshow cmap alpha bins tick_params annotate quiver contour barh stackplot subplots_adjust axhline axvline semilogx semilogy loglog polar streamplot hexbin pcolor tricontour errorbar clabel set_aspect violinplot set_axis_off spines text hatch plt axis plt.bar() plt.axis import figure pyplot highlight_text pypalettes plt.subplots() xlabel ylabel title legend colorbar savefig tight_layout grid set_xlim set_ylim plot scatter hist boxplot imshow cmap alpha bins tick_params annotate quiver contour barh stackplot subplots_adjust axhline axvline semilogx semilogy loglog polar streamplot hexbin pcolor tricontour errorbar clabel set_aspect violinplot set_axis_off spines text hatch plt axis plt.bar() plt.axis import figure pyplot highlight_text pypalettes plt.subplots() xlabel ylabel title legend colorbar savefig tight_layout grid set_xlim set_ylim plot scatter hist boxplot imshow cmap alpha bins tick_params annotate quiver contour barh stackplot subplots_adjust axhline axvline semilogx semilogy loglog polar streamplot hexbin pcolor tricontour errorbar clabel set_aspect violinplot set_axis_off spines text hatch plt axis plt.bar() plt.axis import figure pyplot highlight_text pypalettes plt.subplots() xlabel ylabel title legend colorbar savefig tight_layout grid set_xlim set_ylim plot scatter hist boxplot imshow cmap alpha bins tick_params annotate quiver contour barh stackplot subplots_adjust axhline axvline semilogx semilogy loglog polar streamplot hexbin pcolor tricontour errorbar clabel set_aspect violinplot set_axis_off spines text hatch plt axis plt.bar() plt.axis import figure pyplot highlight_text pypalettes plt.subplots() xlabel ylabel title legend colorbar savefig tight_layout grid set_xlim set_ylim plot scatter hist boxplot imshow cmap alpha bins tick_params annotate quiver contour barh stackplot subplots_adjust axhline axvline semilogx semilogy loglog polar streamplot hexbin pcolor tricontour errorbar clabel set_aspect violinplot set_axis_off spines text hatch plt axis plt.bar() plt.axis import figure pyplot highlight_text pypalettes plt.subplots() xlabel ylabel title legend colorbar savefig tight_layout grid set_xlim set_ylim plot scatter hist boxplot imshow cmap alpha bins tick_params annotate quiver contour barh stackplot subplots_adjust axhline axvline semilogx semilogy loglog polar streamplot hexbin pcolor tricontour errorbar clabel set_aspect violinplot set_axis_off spines text hatch plt axis plt.bar() plt.axis import figure pyplot highlight_text pypalettes plt.subplots() xlabel ylabel title legend colorbar savefig tight_layout grid set_xlim set_ylim plot scatter hist boxplot imshow cmap alpha bins tick_params annotate quiver contour barh stackplot subplots_adjust axhline axvline semilogx semilogy loglog polar streamplot hexbin pcolor tricontour errorbar clabel set_aspect violinplot set_axis_off spines text hatch plt axis plt.bar() plt.axis import figure pyplot highlight_text pypalettes plt.subplots() xlabel ylabel title legend colorbar savefig tight_layout grid set_xlim set_ylim plot scatter hist boxplot imshow cmap alpha bins tick_params annotate quiver contour barh stackplot subplots_adjust axhline axvline semilogx semilogy loglog polar streamplot hexbin pcolor tricontour errorbar clabel set_aspect violinplot set_axis_off spines text hatch plt axis plt.bar() plt.axis import figure pyplot highlight_text pypalettes plt.subplots() xlabel ylabel title legend colorbar savefig tight_layout grid set_xlim set_ylim plot scatter hist boxplot imshow cmap alpha bins tick_params annotate quiver contour barh stackplot subplots_adjust axhline axvline semilogx semilogy loglog polar streamplot hexbin pcolor tricontour errorbar clabel set_aspect violinplot set_axis_off spines text hatch plt axis plt.bar() plt.axis import figure pyplot highlight_text pypalettes plt.subplots() xlabel ylabel title legend colorbar savefig tight_layout grid set_xlim set_ylim plot scatter hist boxplot imshow cmap alpha bins tick_params annotate quiver contour barh stackplot subplots_adjust axhline axvline semilogx semilogy loglog polar streamplot hexbin pcolor tricontour errorbar clabel set_aspect violinplot set_axis_off spines text hatch plt axis plt.bar() plt.axis import figure pyplot highlight_text pypalettes plt.subplots() xlabel ylabel title legend colorbar savefig tight_layout grid set_xlim set_ylim plot scatter hist boxplot imshow cmap alpha bins tick_params annotate quiver contour barh stackplot subplots_adjust axhline axvline semilogx semilogy loglog polar streamplot hexbin pcolor tricontour errorbar clabel set_aspect violinplot set_axis_off spines text hatch plt axis plt.bar() plt.axis import figure pyplot highlight_text pypalettes plt.subplots() xlabel ylabel title legend colorbar savefig tight_layout grid set_xlim set_ylim plot scatter hist boxplot imshow cmap alpha bins tick_params annotate quiver contour barh stackplot subplots_adjust axhline axvline semilogx semilogy loglog polar streamplot hexbin pcolor tricontour errorbar clabel set_aspect violinplot set_axis_off spines text hatch plt axis plt.bar() plt.axis import figure pyplot highlight_text pypalettes plt.subplots() xlabel ylabel title legend colorbar savefig tight_layout grid set_xlim set_ylim plot scatter hist boxplot imshow cmap alpha bins tick_params annotate quiver contour barh stackplot subplots_adjust axhline axvline semilogx semilogy loglog polar streamplot hexbin pcolor tricontour errorbar clabel set_aspect violinplot set_axis_off spines text hatch plt axis plt.bar() plt.axis import figure pyplot highlight_text pypalettes plt.subplots() xlabel ylabel title legend colorbar savefig tight_layout grid set_xlim set_ylim plot scatter hist boxplot imshow cmap alpha bins tick_params annotate quiver contour barh stackplot subplots_adjust axhline axvline semilogx semilogy loglog polar streamplot hexbin pcolor tricontour errorbar clabel set_aspect violinplot set_axis_off spines text hatch plt axis plt.bar() plt.axis import figure pyplot highlight_text pypalettes plt.subplots() xlabel ylabel title legend colorbar savefig tight_layout grid set_xlim set_ylim plot scatter hist boxplot imshow cmap alpha bins tick_params annotate quiver contour barh stackplot subplots_adjust axhline axvline semilogx semilogy loglog polar streamplot hexbin pcolor tricontour errorbar clabel set_aspect violinplot set_axis_off spines text hatch plt axis plt.bar() plt.axis import figure pyplot highlight_text pypalettes plt.subplots() xlabel ylabel title legend colorbar savefig tight_layout grid set_xlim set_ylim plot scatter hist boxplot imshow cmap alpha bins tick_params annotate quiver contour barh stackplot subplots_adjust axhline axvline semilogx semilogy loglog polar streamplot hexbin pcolor tricontour errorbar clabel set_aspect violinplot set_axis_off spines text hatch plt axis plt.bar() plt.axis import figure pyplot highlight_text pypalettes plt.subplots() xlabel ylabel title legend colorbar savefig tight_layout grid set_xlim set_ylim plot scatter hist boxplot imshow cmap alpha bins tick_params annotate quiver contour barh stackplot subplots_adjust axhline axvline semilogx semilogy loglog polar streamplot hexbin pcolor tricontour errorbar clabel set_aspect violinplot set_axis_off spines text hatch plt axis plt.bar() plt.axis import figure pyplot highlight_text pypalettes plt.subplots() xlabel ylabel title legend colorbar savefig tight_layout grid set_xlim set_ylim plot scatter hist boxplot imshow cmap alpha bins tick_params annotate quiver contour barh stackplot subplots_adjust axhline axvline semilogx semilogy loglog polar streamplot hexbin pcolor tricontour errorbar clabel set_aspect violinplot set_axis_off spines text hatch plt axis plt.bar() plt.axis import figure pyplot highlight_text pypalettes plt.subplots() xlabel ylabel title legend colorbar savefig tight_layout grid set_xlim set_ylim plot scatter hist boxplot imshow cmap alpha bins tick_params annotate quiver contour barh stackplot subplots_adjust axhline axvline semilogx semilogy loglog polar streamplot hexbin pcolor tricontour errorbar clabel set_aspect violinplot set_axis_off spines text hatch plt axis plt.bar() plt.axis import figure pyplot highlight_text pypalettes plt.subplots() xlabel ylabel title legend colorbar savefig tight_layout grid set_xlim set_ylim plot scatter hist boxplot imshow cmap alpha bins tick_params annotate quiver contour barh stackplot subplots_adjust axhline axvline semilogx semilogy loglog polar streamplot hexbin pcolor tricontour errorbar clabel set_aspect violinplot set_axis_off spines text hatch plt axis plt.bar() plt.axis import figure pyplot highlight_text pypalettes plt.subplots() xlabel ylabel title legend colorbar savefig tight_layout grid set_xlim set_ylim plot scatter hist boxplot imshow cmap alpha bins tick_params annotate quiver contour barh stackplot subplots_adjust axhline axvline semilogx semilogy loglog polar streamplot hexbin pcolor tricontour errorbar clabel set_aspect violinplot set_axis_off spines text hatch plt axis plt.bar() plt.axis import figure pyplot highlight_text pypalettes plt.subplots() xlabel ylabel title legend colorbar savefig tight_layout grid set_xlim set_ylim plot scatter hist boxplot imshow cmap alpha bins tick_params annotate quiver contour barh stackplot subplots_adjust axhline axvline semilogx semilogy loglog polar streamplot hexbin pcolor tricontour errorbar clabel set_aspect violinplot set_axis_off spines text hatch plt axis plt.bar() plt.axis import figure pyplot highlight_text pypalettes plt.subplots() xlabel ylabel title legend colorbar savefig tight_layout grid set_xlim set_ylim plot scatter hist boxplot imshow cmap alpha bins tick_params annotate quiver contour barh stackplot subplots_adjust axhline axvline semilogx semilogy loglog polar streamplot hexbin pcolor tricontour errorbar clabel set_aspect violinplot set_axis_off spines text hatch plt axis plt.bar() plt.axis import figure pyplot highlight_text pypalettes plt.subplots() xlabel ylabel title legend colorbar savefig tight_layout grid set_xlim set_ylim plot scatter hist boxplot imshow cmap alpha bins tick_params annotate quiver contour barh stackplot subplots_adjust axhline axvline semilogx semilogy loglog polar streamplot hexbin pcolor tricontour errorbar clabel set_aspect violinplot set_axis_off spines text hatch plt axis plt.bar() plt.axis import figure pyplot highlight_text pypalettes plt.subplots() xlabel ylabel title legend colorbar savefig tight_layout grid set_xlim set_ylim plot scatter hist boxplot imshow cmap alpha bins tick_params annotate quiver contour barh stackplot subplots_adjust axhline axvline semilogx semilogy loglog polar streamplot hexbin pcolor tricontour errorbar clabel set_aspect violinplot set_axis_off spines text hatch plt axis plt.bar() plt.axis import figure pyplot highlight_text pypalettes plt.subplots() xlabel ylabel title legend colorbar savefig tight_layout grid set_xlim set_ylim plot scatter hist boxplot imshow cmap alpha bins tick_params annotate quiver contour barh stackplot subplots_adjust axhline axvline semilogx semilogy loglog polar streamplot hexbin pcolor tricontour errorbar clabel set_aspect violinplot set_axis_off spines text hatch plt axis plt.bar() plt.axis import figure pyplot highlight_text pypalettes plt.subplots() xlabel ylabel title legend colorbar savefig tight_layout grid set_xlim set_ylim plot scatter hist boxplot imshow cmap alpha bins tick_params annotate quiver contour barh stackplot subplots_adjust axhline axvline semilogx semilogy loglog polar streamplot hexbin pcolor tricontour errorbar clabel set_aspect violinplot set_axis_off spines text hatch plt axis plt.bar() plt.axis import figure pyplot highlight_text pypalettes plt.subplots() xlabel ylabel title legend colorbar savefig tight_layout grid set_xlim set_ylim plot scatter hist boxplot imshow cmap alpha bins tick_params annotate quiver contour barh stackplot subplots_adjust axhline axvline semilogx semilogy loglog polar streamplot hexbin pcolor tricontour errorbar clabel set_aspect violinplot set_axis_off spines text hatch plt axis plt.bar() plt.axis import figure pyplot highlight_text pypalettes plt.subplots() xlabel ylabel title legend colorbar savefig tight_layout grid set_xlim set_ylim plot scatter hist boxplot imshow cmap alpha bins tick_params annotate quiver contour barh stackplot subplots_adjust axhline axvline semilogx semilogy loglog polar streamplot hexbin pcolor tricontour errorbar clabel set_aspect violinplot set_axis_off spines text hatch plt axis plt.bar() plt.axis import figure pyplot highlight_text pypalettes plt.subplots() xlabel ylabel title legend colorbar savefig tight_layout grid set_xlim set_ylim plot scatter hist boxplot imshow cmap alpha bins tick_params annotate quiver contour barh stackplot subplots_adjust axhline axvline semilogx semilogy loglog polar streamplot hexbin pcolor tricontour errorbar clabel set_aspect violinplot set_axis_off spines text hatch plt axis plt.bar() plt.axis import figure pyplot highlight_text pypalettes plt.subplots() xlabel ylabel title legend colorbar savefig tight_layout grid set_xlim set_ylim plot scatter hist boxplot imshow cmap alpha bins tick_params annotate quiver contour barh stackplot subplots_adjust axhline axvline semilogx semilogy loglog polar streamplot hexbin pcolor tricontour errorbar clabel set_aspect violinplot set_axis_off spines text hatch plt axis plt.bar() plt.axis import figure pyplot highlight_text pypalettes plt.subplots() xlabel ylabel title legend colorbar savefig tight_layout grid set_xlim set_ylim plot scatter hist boxplot imshow cmap alpha bins tick_params annotate quiver contour barh stackplot subplots_adjust axhline axvline semilogx semilogy loglog polar streamplot hexbin pcolor tricontour errorbar clabel set_aspect violinplot set_axis_off spines text hatch plt axis plt.bar() plt.axis import figure pyplot highlight_text pypalettes plt.subplots() xlabel ylabel title legend colorbar savefig tight_layout grid set_xlim set_ylim plot scatter hist boxplot imshow cmap alpha bins tick_params annotate quiver contour barh stackplot subplots_adjust axhline axvline semilogx semilogy loglog polar streamplot hexbin pcolor tricontour errorbar clabel set_aspect violinplot set_axis_off spines text hatch plt axis plt.bar() plt.axis import figure pyplot highlight_text pypalettes plt.subplots() xlabel ylabel title legend colorbar savefig tight_layout grid set_xlim set_ylim plot scatter hist boxplot imshow cmap alpha bins tick_params annotate quiver contour barh stackplot subplots_adjust axhline axvline semilogx semilogy loglog polar streamplot hexbin pcolor tricontour errorbar clabel set_aspect violinplot set_axis_off spines text hatch plt axis plt.bar() plt.axis import figure pyplot highlight_text pypalettes plt.subplots() xlabel ylabel title legend colorbar savefig tight_layout grid set_xlim set_ylim plot scatter hist boxplot imshow cmap alpha bins tick_params annotate quiver contour barh stackplot subplots_adjust axhline axvline semilogx semilogy loglog polar streamplot hexbin pcolor tricontour errorbar clabel set_aspect violinplot set_axis_off spines text hatch plt axis plt.bar() plt.axis import figure pyplot highlight_text pypalettes plt.subplots() xlabel ylabel title legend colorbar savefig tight_layout grid set_xlim set_ylim plot scatter hist boxplot imshow cmap alpha bins tick_params annotate quiver contour barh stackplot subplots_adjust axhline axvline semilogx semilogy loglog polar streamplot hexbin pcolor tricontour errorbar clabel set_aspect violinplot set_axis_off spines text hatch plt axis plt.bar() plt.axis import figure pyplot highlight_text pypalettes plt.subplots() xlabel ylabel title legend colorbar savefig tight_layout grid set_xlim set_ylim plot scatter hist boxplot imshow cmap alpha bins tick_params annotate quiver contour barh stackplot subplots_adjust axhline axvline semilogx semilogy loglog polar streamplot hexbin pcolor tricontour errorbar clabel set_aspect violinplot set_axis_off spines text hatch plt axis plt.bar() plt.axis import figure pyplot highlight_text pypalettes plt.subplots() xlabel ylabel title legend colorbar savefig tight_layout grid set_xlim set_ylim plot scatter hist boxplot imshow cmap alpha bins tick_params annotate quiver contour barh stackplot subplots_adjust axhline axvline semilogx semilogy loglog polar streamplot hexbin pcolor tricontour errorbar clabel set_aspect violinplot set_axis_off spines text hatch plt axis plt.bar() plt.axis import figure pyplot highlight_text pypalettes plt.subplots() xlabel ylabel title legend colorbar savefig tight_layout grid set_xlim set_ylim plot scatter hist boxplot imshow cmap alpha bins tick_params annotate quiver contour barh stackplot subplots_adjust axhline axvline semilogx semilogy loglog polar streamplot hexbin pcolor tricontour errorbar clabel set_aspect violinplot set_axis_off spines text hatch plt axis plt.bar() plt.axis import figure pyplot highlight_text pypalettes plt.subplots() xlabel ylabel title legend colorbar savefig tight_layout grid set_xlim set_ylim plot scatter hist boxplot imshow cmap alpha bins tick_params annotate quiver contour barh stackplot subplots_adjust axhline axvline semilogx semilogy loglog polar streamplot hexbin pcolor tricontour errorbar clabel set_aspect violinplot set_axis_off spines text hatch plt axis plt.bar() plt.axis import figure pyplot highlight_text pypalettes plt.subplots() xlabel ylabel title legend colorbar savefig tight_layout grid set_xlim set_ylim plot scatter hist boxplot imshow cmap alpha bins tick_params annotate quiver contour barh stackplot subplots_adjust axhline axvline semilogx semilogy loglog polar streamplot hexbin pcolor tricontour errorbar clabel set_aspect violinplot set_axis_off spines text hatch plt axis plt.bar() plt.axis import figure pyplot highlight_text pypalettes plt.subplots() xlabel ylabel title legend colorbar savefig tight_layout grid set_xlim set_ylim plot scatter hist boxplot imshow cmap alpha bins tick_params annotate quiver contour barh stackplot subplots_adjust axhline axvline semilogx semilogy loglog polar streamplot hexbin pcolor tricontour errorbar clabel set_aspect violinplot set_axis_off spines text hatch plt axis plt.bar() plt.axis import figure pyplot highlight_text pypalettes plt.subplots() xlabel ylabel title legend colorbar savefig tight_layout grid set_xlim set_ylim plot scatter hist boxplot imshow cmap alpha bins tick_params annotate quiver contour barh stackplot subplots_adjust axhline axvline semilogx semilogy loglog polar streamplot hexbin pcolor tricontour errorbar clabel set_aspect violinplot set_axis_off spines text hatch plt axis plt.bar() plt.axis import figure pyplot highlight_text pypalettes plt.subplots() xlabel ylabel title legend colorbar savefig tight_layout grid set_xlim set_ylim plot scatter hist boxplot imshow cmap alpha bins tick_params annotate quiver contour barh stackplot subplots_adjust axhline axvline semilogx semilogy loglog polar streamplot hexbin pcolor tricontour errorbar clabel set_aspect violinplot set_axis_off spines text hatch plt axis plt.bar() plt.axis import figure pyplot highlight_text pypalettes plt.subplots() xlabel ylabel title legend colorbar savefig tight_layout grid set_xlim set_ylim plot scatter hist boxplot imshow cmap alpha bins tick_params annotate quiver contour barh stackplot subplots_adjust axhline axvline semilogx semilogy loglog polar streamplot hexbin pcolor tricontour errorbar clabel set_aspect violinplot set_axis_off spines text hatch plt axis plt.bar() plt.axis import figure pyplot highlight_text pypalettes plt.subplots() xlabel ylabel title legend colorbar savefig tight_layout grid set_xlim set_ylim plot scatter hist boxplot imshow cmap alpha bins tick_params annotate quiver contour barh stackplot subplots_adjust axhline axvline semilogx semilogy loglog polar streamplot hexbin pcolor tricontour errorbar clabel set_aspect violinplot set_axis_off spines text hatch plt axis plt.bar() plt.axis import figure pyplot highlight_text pypalettes plt.subplots() xlabel ylabel title legend colorbar savefig tight_layout grid set_xlim set_ylim plot scatter hist boxplot imshow cmap alpha bins tick_params annotate quiver contour barh stackplot subplots_adjust axhline axvline semilogx semilogy loglog polar streamplot hexbin pcolor tricontour errorbar clabel set_aspect violinplot set_axis_off spines text hatch plt axis plt.bar() plt.axis import figure pyplot highlight_text pypalettes plt.subplots() xlabel ylabel title legend colorbar savefig tight_layout grid set_xlim set_ylim plot scatter hist boxplot imshow cmap alpha bins tick_params annotate quiver contour barh stackplot subplots_adjust axhline axvline semilogx semilogy loglog polar streamplot hexbin pcolor tricontour errorbar clabel set_aspect violinplot set_axis_off spines text hatch plt axis plt.bar() plt.axis import figure pyplot highlight_text pypalettes plt.subplots() xlabel ylabel title legend colorbar savefig tight_layout grid set_xlim set_ylim plot scatter hist boxplot imshow cmap alpha bins tick_params annotate quiver contour barh stackplot subplots_adjust axhline axvline semilogx semilogy loglog polar streamplot hexbin pcolor tricontour errorbar clabel set_aspect violinplot set_axis_off spines text hatch plt axis plt.bar() plt.axis import figure pyplot highlight_text pypalettes plt.subplots() xlabel ylabel title legend colorbar savefig tight_layout grid set_xlim set_ylim plot scatter hist boxplot imshow cmap alpha bins tick_params annotate quiver contour barh stackplot subplots_adjust axhline axvline semilogx semilogy loglog polar streamplot hexbin pcolor tricontour errorbar clabel set_aspect violinplot set_axis_off spines text hatch plt axis plt.bar() plt.axis import figure pyplot highlight_text pypalettes plt.subplots() xlabel ylabel title legend colorbar savefig tight_layout grid set_xlim set_ylim plot scatter hist boxplot imshow cmap alpha bins tick_params annotate quiver contour barh stackplot subplots_adjust axhline axvline semilogx semilogy loglog polar streamplot hexbin pcolor tricontour errorbar clabel set_aspect violinplot set_axis_off spines text hatch plt axis plt.bar() plt.axis import figure pyplot highlight_text pypalettes plt.subplots() xlabel ylabel title legend colorbar savefig tight_layout grid set_xlim set_ylim plot scatter hist boxplot imshow cmap alpha bins tick_params annotate quiver contour barh stackplot subplots_adjust axhline axvline semilogx semilogy loglog polar streamplot hexbin pcolor tricontour errorbar clabel set_aspect violinplot set_axis_off spines text hatch plt axis plt.bar() plt.axis import figure pyplot highlight_text pypalettes plt.subplots() xlabel ylabel title legend colorbar savefig tight_layout grid set_xlim set_ylim plot scatter hist boxplot imshow cmap alpha bins tick_params annotate quiver contour barh stackplot subplots_adjust axhline axvline semilogx semilogy loglog polar streamplot hexbin pcolor tricontour errorbar clabel set_aspect violinplot set_axis_off spines text hatch plt axis plt.bar() plt.axis import figure pyplot highlight_text pypalettes plt.subplots() xlabel ylabel title legend colorbar savefig tight_layout grid set_xlim set_ylim plot scatter hist boxplot imshow cmap alpha bins tick_params annotate quiver contour barh stackplot subplots_adjust axhline axvline semilogx semilogy loglog polar streamplot hexbin pcolor tricontour errorbar clabel set_aspect violinplot set_axis_off spines text hatch plt axis plt.bar() plt.axis import figure pyplot highlight_text pypalettes plt.subplots() xlabel ylabel title legend colorbar savefig tight_layout grid set_xlim set_ylim plot scatter hist boxplot imshow cmap alpha bins tick_params annotate quiver contour barh stackplot subplots_adjust axhline axvline semilogx semilogy loglog polar streamplot hexbin pcolor tricontour errorbar clabel set_aspect violinplot set_axis_off spines text hatch plt axis plt.bar() plt.axis import figure pyplot highlight_text pypalettes plt.subplots() xlabel ylabel title legend colorbar savefig tight_layout grid set_xlim set_ylim plot scatter hist boxplot imshow cmap alpha bins tick_params annotate quiver contour barh stackplot subplots_adjust axhline axvline semilogx semilogy loglog polar streamplot hexbin pcolor tricontour errorbar clabel set_aspect violinplot set_axis_off spines text hatch plt axis plt.bar() plt.axis import figure pyplot highlight_text pypalettes plt.subplots() xlabel ylabel title legend colorbar savefig tight_layout grid set_xlim set_ylim plot scatter hist boxplot imshow cmap alpha bins tick_params annotate quiver contour barh stackplot subplots_adjust axhline axvline semilogx semilogy loglog polar streamplot hexbin pcolor tricontour errorbar clabel set_aspect violinplot set_axis_off spines text hatch plt axis plt.bar() plt.axis import figure pyplot highlight_text pypalettes plt.subplots() xlabel ylabel title legend colorbar savefig tight_layout grid set_xlim set_ylim plot scatter hist boxplot imshow cmap alpha bins tick_params annotate quiver contour barh stackplot subplots_adjust axhline axvline semilogx semilogy loglog polar streamplot hexbin pcolor tricontour errorbar clabel set_aspect violinplot set_axis_off spines text hatch plt axis plt.bar() plt.axis import figure pyplot highlight_text pypalettes plt.subplots() xlabel ylabel title legend colorbar savefig tight_layout grid set_xlim set_ylim plot scatter hist boxplot imshow cmap alpha bins tick_params annotate quiver contour barh stackplot subplots_adjust axhline axvline semilogx semilogy loglog polar streamplot hexbin pcolor tricontour errorbar clabel set_aspect violinplot set_axis_off spines text hatch plt axis plt.bar() plt.axis import figure pyplot highlight_text pypalettes plt.subplots() xlabel ylabel title legend colorbar savefig tight_layout grid set_xlim set_ylim plot scatter hist boxplot imshow cmap alpha bins tick_params annotate quiver contour barh stackplot subplots_adjust axhline axvline semilogx semilogy loglog polar streamplot hexbin pcolor tricontour errorbar clabel set_aspect violinplot set_axis_off spines text hatch plt axis plt.bar() plt.axis import figure pyplot highlight_text pypalettes plt.subplots() xlabel ylabel title legend colorbar savefig tight_layout grid set_xlim set_ylim plot scatter hist boxplot imshow cmap alpha bins tick_params annotate quiver contour barh stackplot subplots_adjust axhline axvline semilogx semilogy loglog polar streamplot hexbin pcolor tricontour errorbar clabel set_aspect violinplot set_axis_off spines text hatch plt axis plt.bar() plt.axis import figure pyplot highlight_text pypalettes plt.subplots() xlabel ylabel title legend colorbar savefig tight_layout grid set_xlim set_ylim plot scatter hist boxplot imshow cmap alpha bins tick_params annotate quiver contour barh stackplot subplots_adjust axhline axvline semilogx semilogy loglog polar streamplot hexbin pcolor tricontour errorbar clabel set_aspect violinplot set_axis_off spines text hatch plt axis plt.bar() plt.axis import figure pyplot highlight_text pypalettes plt.subplots() xlabel ylabel title legend colorbar savefig tight_layout grid set_xlim set_ylim plot scatter hist boxplot imshow cmap alpha bins tick_params annotate quiver contour barh stackplot subplots_adjust axhline axvline semilogx semilogy loglog polar streamplot hexbin pcolor tricontour errorbar clabel set_aspect violinplot set_axis_off spines text hatch plt axis plt.bar() plt.axis import figure pyplot highlight_text pypalettes plt.subplots() xlabel ylabel title legend colorbar savefig tight_layout grid set_xlim set_ylim plot scatter hist boxplot imshow cmap alpha bins tick_params annotate quiver contour barh stackplot subplots_adjust axhline axvline semilogx semilogy loglog polar streamplot hexbin pcolor tricontour errorbar clabel set_aspect violinplot set_axis_off spines text hatch plt axis plt.bar() plt.axis import figure pyplot highlight_text pypalettes plt.subplots() xlabel ylabel title legend colorbar savefig tight_layout grid set_xlim set_ylim plot scatter hist boxplot imshow cmap alpha bins tick_params annotate quiver contour barh stackplot subplots_adjust axhline axvline semilogx semilogy loglog polar streamplot hexbin pcolor tricontour errorbar clabel set_aspect violinplot set_axis_off spines text hatch plt axis plt.bar() plt.axis import figure pyplot highlight_text pypalettes plt.subplots() xlabel ylabel title legend colorbar savefig tight_layout grid set_xlim set_ylim plot scatter hist boxplot imshow cmap alpha bins tick_params annotate quiver contour barh stackplot subplots_adjust axhline axvline semilogx semilogy loglog polar streamplot hexbin pcolor tricontour errorbar clabel set_aspect violinplot set_axis_off spines text hatch plt axis plt.bar() plt.axis import figure pyplot highlight_text pypalettes plt.subplots() xlabel ylabel title legend colorbar savefig tight_layout grid set_xlim set_ylim plot scatter hist boxplot imshow cmap alpha bins tick_params annotate quiver contour barh stackplot subplots_adjust axhline axvline semilogx semilogy loglog polar streamplot hexbin pcolor tricontour errorbar clabel set_aspect violinplot set_axis_off spines text hatch plt axis plt.bar() plt.axis import figure pyplot highlight_text pypalettes plt.subplots() xlabel ylabel title legend colorbar savefig tight_layout grid set_xlim set_ylim plot scatter hist boxplot imshow cmap alpha bins tick_params annotate quiver contour barh stackplot subplots_adjust axhline axvline semilogx semilogy loglog polar streamplot hexbin pcolor tricontour errorbar clabel set_aspect violinplot set_axis_off spines text hatch plt axis plt.bar() plt.axis import figure pyplot highlight_text pypalettes plt.subplots() xlabel ylabel title legend colorbar savefig tight_layout grid set_xlim set_ylim plot scatter hist boxplot imshow cmap alpha bins tick_params annotate quiver contour barh stackplot subplots_adjust axhline axvline semilogx semilogy loglog polar streamplot hexbin pcolor tricontour errorbar clabel set_aspect violinplot set_axis_off spines text hatch plt axis plt.bar() plt.axis import figure pyplot highlight_text pypalettes plt.subplots() xlabel ylabel title legend colorbar savefig tight_layout grid set_xlim set_ylim plot scatter hist boxplot imshow cmap alpha bins tick_params annotate quiver contour barh stackplot subplots_adjust axhline axvline semilogx semilogy loglog polar streamplot hexbin pcolor tricontour errorbar clabel set_aspect violinplot set_axis_off spines text hatch plt axis plt.bar() plt.axis import figure pyplot highlight_text pypalettes plt.subplots() xlabel ylabel title legend colorbar savefig tight_layout grid set_xlim set_ylim plot scatter hist boxplot imshow cmap alpha bins tick_params annotate quiver contour barh stackplot subplots_adjust axhline axvline semilogx semilogy loglog polar streamplot hexbin pcolor tricontour errorbar clabel set_aspect violinplot set_axis_off spines text hatch plt axis plt.bar() plt.axis import figure pyplot highlight_text pypalettes plt.subplots() xlabel ylabel title legend colorbar savefig tight_layout grid set_xlim set_ylim plot scatter hist boxplot imshow cmap alpha bins tick_params annotate quiver contour barh stackplot subplots_adjust axhline axvline semilogx semilogy loglog polar streamplot hexbin pcolor tricontour errorbar clabel set_aspect violinplot set_axis_off spines text hatch plt axis plt.bar() plt.axis import figure pyplot highlight_text pypalettes plt.subplots() xlabel ylabel title legend colorbar savefig tight_layout grid set_xlim set_ylim plot scatter hist boxplot imshow cmap alpha bins tick_params annotate quiver contour barh stackplot subplots_adjust axhline axvline semilogx semilogy loglog polar streamplot hexbin pcolor tricontour errorbar clabel set_aspect violinplot set_axis_off spines text hatch plt axis plt.bar() plt.axis import figure pyplot highlight_text pypalettes plt.subplots() xlabel ylabel title legend colorbar savefig tight_layout grid set_xlim set_ylim plot scatter hist boxplot imshow cmap alpha bins tick_params annotate quiver contour barh stackplot subplots_adjust axhline axvline semilogx semilogy loglog polar streamplot hexbin pcolor tricontour errorbar clabel set_aspect violinplot set_axis_off spines text hatch plt axis plt.bar() plt.axis import figure pyplot highlight_text pypalettes plt.subplots() xlabel ylabel title legend colorbar savefig tight_layout grid set_xlim set_ylim plot scatter hist boxplot imshow cmap alpha bins tick_params annotate quiver contour barh stackplot subplots_adjust axhline axvline semilogx semilogy loglog polar streamplot hexbin pcolor tricontour errorbar clabel set_aspect violinplot set_axis_off spines text hatch plt axis plt.bar() plt.axis import figure pyplot highlight_text pypalettes plt.subplots() xlabel ylabel title legend colorbar savefig tight_layout grid set_xlim set_ylim plot scatter hist boxplot imshow cmap alpha bins tick_params annotate quiver contour barh stackplot subplots_adjust axhline axvline semilogx semilogy loglog polar streamplot hexbin pcolor tricontour errorbar clabel set_aspect violinplot set_axis_off spines text hatch plt axis plt.bar() plt.axis import figure pyplot highlight_text pypalettes plt.subplots() xlabel ylabel title legend colorbar savefig tight_layout grid set_xlim set_ylim plot scatter hist boxplot imshow cmap alpha bins tick_params annotate quiver contour barh stackplot subplots_adjust axhline axvline semilogx semilogy loglog polar streamplot hexbin pcolor tricontour errorbar clabel set_aspect violinplot set_axis_off spines text hatch plt axis plt.bar() plt.axis import figure pyplot highlight_text pypalettes plt.subplots() xlabel ylabel title legend colorbar savefig tight_layout grid set_xlim set_ylim plot scatter hist boxplot imshow cmap alpha bins tick_params annotate quiver contour barh stackplot subplots_adjust axhline axvline semilogx semilogy loglog polar streamplot hexbin pcolor tricontour errorbar clabel set_aspect violinplot set_axis_off spines text hatch plt axis plt.bar() plt.axis import figure pyplot highlight_text pypalettes plt.subplots() xlabel ylabel title legend colorbar savefig tight_layout grid set_xlim set_ylim plot scatter hist boxplot imshow cmap alpha bins tick_params annotate quiver contour barh stackplot subplots_adjust axhline axvline semilogx semilogy loglog polar streamplot hexbin pcolor tricontour errorbar clabel set_aspect violinplot set_axis_off spines text hatch plt axis plt.bar() plt.axis import figure pyplot highlight_text pypalettes plt.subplots() xlabel ylabel title legend colorbar savefig tight_layout grid set_xlim set_ylim plot scatter hist boxplot imshow cmap alpha bins tick_params annotate quiver contour barh stackplot subplots_adjust axhline axvline semilogx semilogy loglog polar streamplot hexbin pcolor tricontour errorbar clabel set_aspect violinplot set_axis_off spines text hatch plt axis plt.bar() plt.axis import figure pyplot highlight_text pypalettes plt.subplots() xlabel ylabel title legend colorbar savefig tight_layout grid set_xlim set_ylim plot scatter hist boxplot imshow cmap alpha bins tick_params annotate quiver contour barh stackplot subplots_adjust axhline axvline semilogx semilogy loglog polar streamplot hexbin pcolor tricontour errorbar clabel set_aspect violinplot set_axis_off spines text hatch plt axis plt.bar() plt.axis import figure pyplot highlight_text pypalettes plt.subplots() xlabel ylabel title legend colorbar savefig tight_layout grid set_xlim set_ylim plot scatter hist boxplot imshow cmap alpha bins tick_params annotate quiver contour barh stackplot subplots_adjust axhline axvline semilogx semilogy loglog polar streamplot hexbin pcolor tricontour errorbar clabel set_aspect violinplot set_axis_off spines text hatch plt axis plt.bar() plt.axis import figure pyplot highlight_text pypalettes plt.subplots() xlabel ylabel title legend colorbar savefig tight_layout grid set_xlim set_ylim plot scatter hist boxplot imshow cmap alpha bins tick_params annotate quiver contour barh stackplot subplots_adjust axhline axvline semilogx semilogy loglog polar streamplot hexbin pcolor tricontour errorbar clabel set_aspect violinplot set_axis_off spines text hatch plt axis plt.bar() plt.axis import figure pyplot highlight_text pypalettes plt.subplots() xlabel ylabel title legend colorbar savefig tight_layout grid set_xlim set_ylim plot scatter hist boxplot imshow cmap alpha bins tick_params annotate quiver contour barh stackplot subplots_adjust axhline axvline semilogx semilogy loglog polar streamplot hexbin pcolor tricontour errorbar clabel set_aspect violinplot set_axis_off spines text hatch plt axis plt.bar() plt.axis import figure pyplot highlight_text pypalettes plt.subplots() xlabel ylabel title legend colorbar savefig tight_layout grid set_xlim set_ylim plot scatter hist boxplot imshow cmap alpha bins tick_params annotate quiver contour barh stackplot subplots_adjust axhline axvline semilogx semilogy loglog polar streamplot hexbin pcolor tricontour errorbar clabel set_aspect violinplot set_axis_off spines text hatch plt axis plt.bar() plt.axis import figure pyplot highlight_text pypalettes plt.subplots() xlabel ylabel title legend colorbar savefig tight_layout grid set_xlim set_ylim plot scatter hist boxplot imshow cmap alpha bins tick_params annotate quiver contour barh stackplot subplots_adjust axhline axvline semilogx semilogy loglog polar streamplot hexbin pcolor tricontour errorbar clabel set_aspect violinplot set_axis_off spines text hatch plt axis plt.bar() plt.axis import figure pyplot highlight_text pypalettes plt.subplots() xlabel ylabel title legend colorbar savefig tight_layout grid set_xlim set_ylim plot scatter hist boxplot imshow cmap alpha bins tick_params annotate quiver contour barh stackplot subplots_adjust axhline axvline semilogx semilogy loglog polar streamplot hexbin pcolor tricontour errorbar clabel set_aspect violinplot set_axis_off spines text hatch plt axis plt.bar() plt.axis import figure pyplot highlight_text pypalettes plt.subplots() xlabel ylabel title legend colorbar savefig tight_layout grid set_xlim set_ylim plot scatter hist boxplot imshow cmap alpha bins tick_params annotate quiver contour barh stackplot subplots_adjust axhline axvline semilogx semilogy loglog polar streamplot hexbin pcolor tricontour errorbar clabel set_aspect violinplot set_axis_off spines text hatch plt axis plt.bar() plt.axis import figure pyplot highlight_text pypalettes plt.subplots() xlabel ylabel title legend colorbar savefig tight_layout grid set_xlim set_ylim plot scatter hist boxplot imshow cmap alpha bins tick_params annotate quiver contour barh stackplot subplots_adjust axhline axvline semilogx semilogy loglog polar streamplot hexbin pcolor tricontour errorbar clabel set_aspect violinplot set_axis_off spines text hatch plt axis plt.bar() plt.axis import figure pyplot highlight_text pypalettes plt.subplots() xlabel ylabel title legend colorbar savefig tight_layout grid set_xlim set_ylim plot scatter hist boxplot imshow cmap alpha bins tick_params annotate quiver contour barh stackplot subplots_adjust axhline axvline semilogx semilogy loglog polar streamplot hexbin pcolor tricontour errorbar clabel set_aspect violinplot set_axis_off spines text hatch plt axis plt.bar() plt.axis import figure pyplot highlight_text pypalettes plt.subplots() xlabel ylabel title legend colorbar savefig tight_layout grid set_xlim set_ylim plot scatter hist boxplot imshow cmap alpha bins tick_params annotate quiver contour barh stackplot subplots_adjust axhline axvline semilogx semilogy loglog polar streamplot hexbin pcolor tricontour errorbar clabel set_aspect violinplot set_axis_off spines text hatch plt axis plt.bar() plt.axis import figure pyplot highlight_text pypalettes plt.subplots() xlabel ylabel title legend colorbar savefig tight_layout grid set_xlim set_ylim plot scatter hist boxplot imshow cmap alpha bins tick_params annotate quiver contour barh stackplot subplots_adjust axhline axvline semilogx semilogy loglog polar streamplot hexbin pcolor tricontour errorbar clabel set_aspect violinplot set_axis_off spines text hatch plt axis plt.bar() plt.axis import figure pyplot highlight_text pypalettes plt.subplots() xlabel ylabel title legend colorbar savefig tight_layout grid set_xlim set_ylim plot scatter hist boxplot imshow cmap alpha bins tick_params annotate quiver contour barh stackplot subplots_adjust axhline axvline semilogx semilogy loglog polar streamplot hexbin pcolor tricontour errorbar clabel set_aspect violinplot set_axis_off spines text hatch plt axis plt.bar() plt.axis import figure pyplot highlight_text pypalettes plt.subplots() xlabel ylabel title legend colorbar savefig tight_layout grid set_xlim set_ylim plot scatter hist boxplot imshow cmap alpha bins tick_params annotate quiver contour barh stackplot subplots_adjust axhline axvline semilogx semilogy loglog polar streamplot hexbin pcolor tricontour errorbar clabel set_aspect violinplot set_axis_off spines text hatch plt axis plt.bar() plt.axis import figure pyplot highlight_text pypalettes plt.subplots() xlabel ylabel title legend colorbar savefig tight_layout grid set_xlim set_ylim plot scatter hist boxplot imshow cmap alpha bins tick_params annotate quiver contour barh stackplot subplots_adjust axhline axvline semilogx semilogy loglog polar streamplot hexbin pcolor tricontour errorbar clabel set_aspect violinplot set_axis_off spines text hatch plt axis plt.bar() plt.axis import figure pyplot highlight_text pypalettes plt.subplots() xlabel ylabel title legend colorbar savefig tight_layout grid set_xlim set_ylim plot scatter hist boxplot imshow cmap alpha bins tick_params annotate quiver contour barh stackplot subplots_adjust axhline axvline semilogx semilogy loglog polar streamplot hexbin pcolor tricontour errorbar clabel set_aspect violinplot set_axis_off spines text hatch plt axis plt.bar() plt.axis import figure pyplot highlight_text pypalettes plt.subplots() xlabel ylabel title legend colorbar savefig tight_layout grid set_xlim set_ylim plot scatter hist boxplot imshow cmap alpha bins tick_params annotate quiver contour barh stackplot subplots_adjust axhline axvline semilogx semilogy loglog polar streamplot hexbin pcolor tricontour errorbar clabel set_aspect violinplot set_axis_off spines text hatch plt axis plt.bar() plt.axis import figure pyplot highlight_text pypalettes plt.subplots() xlabel ylabel title legend colorbar savefig tight_layout grid set_xlim set_ylim plot scatter hist boxplot imshow cmap alpha bins tick_params annotate quiver contour barh stackplot subplots_adjust axhline axvline semilogx semilogy loglog polar streamplot hexbin pcolor tricontour errorbar clabel set_aspect violinplot set_axis_off spines text hatch plt axis plt.bar() plt.axis import figure pyplot highlight_text pypalettes plt.subplots() xlabel ylabel title legend colorbar savefig tight_layout grid set_xlim set_ylim plot scatter hist boxplot imshow cmap alpha bins tick_params annotate quiver contour barh stackplot subplots_adjust axhline axvline semilogx semilogy loglog polar streamplot hexbin pcolor tricontour errorbar clabel set_aspect violinplot set_axis_off spines text hatch plt axis plt.bar() plt.axis import figure pyplot highlight_text pypalettes plt.subplots() xlabel ylabel title legend colorbar savefig tight_layout grid set_xlim set_ylim plot scatter hist boxplot imshow cmap alpha bins tick_params annotate quiver contour barh stackplot subplots_adjust axhline axvline semilogx semilogy loglog polar streamplot hexbin pcolor tricontour errorbar clabel set_aspect violinplot set_axis_off spines text hatch plt axis plt.bar() plt.axis import figure pyplot highlight_text pypalettes plt.subplots() xlabel ylabel title legend colorbar savefig tight_layout grid set_xlim set_ylim plot scatter hist boxplot imshow cmap alpha bins tick_params annotate quiver contour barh stackplot subplots_adjust axhline axvline semilogx semilogy loglog polar streamplot hexbin pcolor tricontour errorbar clabel set_aspect violinplot set_axis_off spines text hatch plt axis plt.bar() plt.axis import figure pyplot highlight_text pypalettes plt.subplots() xlabel ylabel title legend colorbar savefig tight_layout grid set_xlim set_ylim plot scatter hist boxplot imshow cmap alpha bins tick_params annotate quiver contour barh stackplot subplots_adjust axhline axvline semilogx semilogy loglog polar streamplot hexbin pcolor tricontour errorbar clabel set_aspect violinplot set_axis_off spines text hatch plt axis plt.bar() plt.axis import figure pyplot highlight_text pypalettes plt.subplots() xlabel ylabel title legend colorbar savefig tight_layout grid set_xlim set_ylim plot scatter hist boxplot imshow cmap alpha bins tick_params annotate quiver contour barh stackplot subplots_adjust axhline axvline semilogx semilogy loglog polar streamplot hexbin pcolor tricontour errorbar clabel set_aspect violinplot set_axis_off spines text hatch plt axis plt.bar() plt.axis import figure pyplot highlight_text pypalettes plt.subplots() xlabel ylabel title legend colorbar savefig tight_layout grid set_xlim set_ylim plot scatter hist boxplot imshow cmap alpha bins tick_params annotate quiver contour barh stackplot subplots_adjust axhline axvline semilogx semilogy loglog polar streamplot hexbin pcolor tricontour errorbar clabel set_aspect violinplot set_axis_off spines text hatch plt axis plt.bar() plt.axis import figure pyplot highlight_text pypalettes plt.subplots() xlabel ylabel title legend colorbar savefig tight_layout grid set_xlim set_ylim plot scatter hist boxplot imshow cmap alpha bins tick_params annotate quiver contour barh stackplot subplots_adjust axhline axvline semilogx semilogy loglog polar streamplot hexbin pcolor tricontour errorbar clabel set_aspect violinplot set_axis_off spines text hatch plt axis plt.bar() plt.axis import figure pyplot highlight_text pypalettes plt.subplots() xlabel ylabel title legend colorbar savefig tight_layout grid set_xlim set_ylim plot scatter hist boxplot imshow cmap alpha bins tick_params annotate quiver contour barh stackplot subplots_adjust axhline axvline semilogx semilogy loglog polar streamplot hexbin pcolor tricontour errorbar clabel set_aspect violinplot set_axis_off spines text hatch plt axis plt.bar() plt.axis import figure pyplot highlight_text pypalettes plt.subplots() xlabel ylabel title legend colorbar savefig tight_layout grid set_xlim set_ylim plot scatter hist boxplot imshow cmap alpha bins tick_params annotate quiver contour barh stackplot subplots_adjust axhline axvline semilogx semilogy loglog polar streamplot hexbin pcolor tricontour errorbar clabel set_aspect violinplot set_axis_off spines text hatch plt axis plt.bar() plt.axis import figure pyplot highlight_text pypalettes plt.subplots() xlabel ylabel title legend colorbar savefig tight_layout grid set_xlim set_ylim plot scatter hist boxplot imshow cmap alpha bins tick_params annotate quiver contour barh stackplot subplots_adjust axhline axvline semilogx semilogy loglog polar streamplot hexbin pcolor tricontour errorbar clabel set_aspect violinplot set_axis_off spines text hatch plt axis plt.bar() plt.axis import figure pyplot highlight_text pypalettes plt.subplots() xlabel ylabel title legend colorbar savefig tight_layout grid set_xlim set_ylim plot scatter hist boxplot imshow cmap alpha bins tick_params annotate quiver contour barh stackplot subplots_adjust axhline axvline semilogx semilogy loglog polar streamplot hexbin pcolor tricontour errorbar clabel set_aspect violinplot set_axis_off spines text hatch plt axis plt.bar() plt.axis import figure pyplot highlight_text pypalettes plt.subplots() xlabel ylabel title legend colorbar savefig tight_layout grid set_xlim set_ylim plot scatter hist boxplot imshow cmap alpha bins tick_params annotate quiver contour barh stackplot subplots_adjust axhline axvline semilogx semilogy loglog polar streamplot hexbin pcolor tricontour errorbar clabel set_aspect violinplot set_axis_off spines text hatch plt axis plt.bar() plt.axis import figure pyplot highlight_text pypalettes plt.subplots() xlabel ylabel title legend colorbar savefig tight_layout grid set_xlim set_ylim plot scatter hist boxplot imshow cmap alpha bins tick_params annotate quiver contour barh stackplot subplots_adjust axhline axvline semilogx semilogy loglog polar streamplot hexbin pcolor tricontour errorbar clabel set_aspect violinplot set_axis_off spines text hatch plt axis plt.bar() plt.axis import figure pyplot highlight_text pypalettes plt.subplots() xlabel ylabel title legend colorbar savefig tight_layout grid set_xlim set_ylim plot scatter hist boxplot imshow cmap alpha bins tick_params annotate quiver contour barh stackplot subplots_adjust axhline axvline semilogx semilogy loglog polar streamplot hexbin pcolor tricontour errorbar clabel set_aspect violinplot set_axis_off spines text hatch plt axis plt.bar() plt.axis import figure pyplot highlight_text pypalettes plt.subplots() xlabel ylabel title legend colorbar savefig tight_layout grid set_xlim set_ylim plot scatter hist boxplot imshow cmap alpha bins tick_params annotate quiver contour barh stackplot subplots_adjust axhline axvline semilogx semilogy loglog polar streamplot hexbin pcolor tricontour errorbar clabel set_aspect violinplot set_axis_off spines text hatch plt axis plt.bar() plt.axis import figure pyplot highlight_text pypalettes plt.subplots() xlabel ylabel title legend colorbar savefig tight_layout grid set_xlim set_ylim plot scatter hist boxplot imshow cmap alpha bins tick_params annotate quiver contour barh stackplot subplots_adjust axhline axvline semilogx semilogy loglog polar streamplot hexbin pcolor tricontour errorbar clabel set_aspect violinplot set_axis_off spines text hatch plt axis plt.bar() plt.axis import figure pyplot highlight_text pypalettes plt.subplots() xlabel ylabel title legend colorbar savefig tight_layout grid set_xlim set_ylim plot scatter hist boxplot imshow cmap alpha bins tick_params annotate quiver contour barh stackplot subplots_adjust axhline axvline semilogx semilogy loglog polar streamplot hexbin pcolor tricontour errorbar clabel set_aspect violinplot set_axis_off spines text hatch plt axis plt.bar() plt.axis import figure pyplot highlight_text pypalettes plt.subplots() xlabel ylabel title legend colorbar savefig tight_layout grid set_xlim set_ylim plot scatter hist boxplot imshow cmap alpha bins tick_params annotate quiver contour barh stackplot subplots_adjust axhline axvline semilogx semilogy loglog polar streamplot hexbin pcolor tricontour errorbar clabel set_aspect violinplot set_axis_off spines text hatch plt axis plt.bar() plt.axis import figure pyplot highlight_text pypalettes plt.subplots() xlabel ylabel title legend colorbar savefig tight_layout grid set_xlim set_ylim plot scatter hist boxplot imshow cmap alpha bins tick_params annotate quiver contour barh stackplot subplots_adjust axhline axvline semilogx semilogy loglog polar streamplot hexbin pcolor tricontour errorbar clabel set_aspect violinplot set_axis_off spines text hatch plt axis plt.bar() plt.axis import figure pyplot highlight_text pypalettes plt.subplots() xlabel ylabel title legend colorbar savefig tight_layout grid set_xlim set_ylim plot scatter hist boxplot imshow cmap alpha bins tick_params annotate quiver contour barh stackplot subplots_adjust axhline axvline semilogx semilogy loglog polar streamplot hexbin pcolor tricontour errorbar clabel set_aspect violinplot set_axis_off spines text hatch plt axis plt.bar() plt.axis import figure pyplot highlight_text pypalettes plt.subplots() xlabel ylabel title legend colorbar savefig tight_layout grid set_xlim set_ylim plot scatter hist boxplot imshow cmap alpha bins tick_params annotate quiver contour barh stackplot subplots_adjust axhline axvline semilogx semilogy loglog polar streamplot hexbin pcolor tricontour errorbar clabel set_aspect violinplot set_axis_off spines text hatch plt axis plt.bar() plt.axis import figure pyplot highlight_text pypalettes plt.subplots() xlabel ylabel title legend colorbar savefig tight_layout grid set_xlim set_ylim plot scatter hist boxplot imshow cmap alpha bins tick_params annotate quiver contour barh stackplot subplots_adjust axhline axvline semilogx semilogy loglog polar streamplot hexbin pcolor tricontour errorbar clabel set_aspect violinplot set_axis_off spines text hatch plt axis plt.bar() plt.axis import figure pyplot highlight_text pypalettes plt.subplots() xlabel ylabel title legend colorbar savefig tight_layout grid set_xlim set_ylim plot scatter hist boxplot imshow cmap alpha bins tick_params annotate quiver contour barh stackplot subplots_adjust axhline axvline semilogx semilogy loglog polar streamplot hexbin pcolor tricontour errorbar clabel set_aspect violinplot set_axis_off spines text hatch plt axis plt.bar() plt.axis import figure pyplot highlight_text pypalettes plt.subplots() xlabel ylabel title legend colorbar savefig tight_layout grid set_xlim set_ylim plot scatter hist boxplot imshow cmap alpha bins tick_params annotate quiver contour barh stackplot subplots_adjust axhline axvline semilogx semilogy loglog polar streamplot hexbin pcolor tricontour errorbar clabel set_aspect violinplot set_axis_off spines text hatch plt axis plt.bar() plt.axis import figure pyplot highlight_text pypalettes plt.subplots() xlabel ylabel title legend colorbar savefig tight_layout grid set_xlim set_ylim plot scatter hist boxplot imshow cmap alpha bins tick_params annotate quiver contour barh stackplot subplots_adjust axhline axvline semilogx semilogy loglog polar streamplot hexbin pcolor tricontour errorbar clabel set_aspect violinplot set_axis_off spines text hatch plt axis plt.bar() plt.axis import figure pyplot highlight_text pypalettes plt.subplots() xlabel ylabel title legend colorbar savefig tight_layout grid set_xlim set_ylim plot scatter hist boxplot imshow cmap alpha bins tick_params annotate quiver contour barh stackplot subplots_adjust axhline axvline semilogx semilogy loglog polar streamplot hexbin pcolor tricontour errorbar clabel set_aspect violinplot set_axis_off spines text hatch plt axis plt.bar() plt.axis import figure pyplot highlight_text pypalettes plt.subplots() xlabel ylabel title legend colorbar savefig tight_layout grid set_xlim set_ylim plot scatter hist boxplot imshow cmap alpha bins tick_params annotate quiver contour barh stackplot subplots_adjust axhline axvline semilogx semilogy loglog polar streamplot hexbin pcolor tricontour errorbar clabel set_aspect violinplot set_axis_off spines text hatch plt axis plt.bar() plt.axis import figure pyplot highlight_text pypalettes plt.subplots() xlabel ylabel title legend colorbar savefig tight_layout grid set_xlim set_ylim plot scatter hist boxplot imshow cmap alpha bins tick_params annotate quiver contour barh stackplot subplots_adjust axhline axvline semilogx semilogy loglog polar streamplot hexbin pcolor tricontour errorbar clabel set_aspect violinplot set_axis_off spines text hatch plt axis plt.bar() plt.axis import figure pyplot highlight_text pypalettes plt.subplots() xlabel ylabel title legend colorbar savefig tight_layout grid set_xlim set_ylim plot scatter hist boxplot imshow cmap alpha bins tick_params annotate quiver contour barh stackplot subplots_adjust axhline axvline semilogx semilogy loglog polar streamplot hexbin pcolor tricontour errorbar clabel set_aspect violinplot set_axis_off spines text hatch plt axis plt.bar() plt.axis import figure pyplot highlight_text pypalettes plt.subplots() xlabel ylabel title legend colorbar savefig tight_layout grid set_xlim set_ylim plot scatter hist boxplot imshow cmap alpha bins tick_params annotate quiver contour barh stackplot subplots_adjust axhline axvline semilogx semilogy loglog polar streamplot hexbin pcolor tricontour errorbar clabel set_aspect violinplot set_axis_off spines text hatch plt axis plt.bar() plt.axis import figure pyplot highlight_text pypalettes plt.subplots() xlabel ylabel title legend colorbar savefig tight_layout grid set_xlim set_ylim plot scatter hist boxplot imshow cmap alpha bins tick_params annotate quiver contour barh stackplot subplots_adjust axhline axvline semilogx semilogy loglog polar streamplot hexbin pcolor tricontour errorbar clabel set_aspect violinplot set_axis_off spines text hatch plt axis plt.bar() plt.axis import figure pyplot highlight_text pypalettes plt.subplots() xlabel ylabel title legend colorbar savefig tight_layout grid set_xlim set_ylim plot scatter hist boxplot imshow cmap alpha bins tick_params annotate quiver contour barh stackplot subplots_adjust axhline axvline semilogx semilogy loglog polar streamplot hexbin pcolor tricontour errorbar clabel set_aspect violinplot set_axis_off spines text hatch plt axis plt.bar() plt.axis import figure pyplot highlight_text pypalettes plt.subplots() xlabel ylabel title legend colorbar savefig tight_layout grid set_xlim set_ylim plot scatter hist boxplot imshow cmap alpha bins tick_params annotate quiver contour barh stackplot subplots_adjust axhline axvline semilogx semilogy loglog polar streamplot hexbin pcolor tricontour errorbar clabel set_aspect violinplot set_axis_off spines text hatch plt axis plt.bar() plt.axis import figure pyplot highlight_text pypalettes plt.subplots() xlabel ylabel title legend colorbar savefig tight_layout grid set_xlim set_ylim plot scatter hist boxplot imshow cmap alpha bins tick_params annotate quiver contour barh stackplot subplots_adjust axhline axvline semilogx semilogy loglog polar streamplot hexbin pcolor tricontour errorbar clabel set_aspect violinplot set_axis_off spines text hatch plt axis plt.bar() plt.axis import figure pyplot highlight_text pypalettes plt.subplots() xlabel ylabel title legend colorbar savefig tight_layout grid set_xlim set_ylim plot scatter hist boxplot imshow cmap alpha bins tick_params annotate quiver contour barh stackplot subplots_adjust axhline axvline semilogx semilogy loglog polar streamplot hexbin pcolor tricontour errorbar clabel set_aspect violinplot set_axis_off spines text hatch plt axis plt.bar() plt.axis import figure pyplot highlight_text pypalettes plt.subplots() xlabel ylabel title legend colorbar savefig tight_layout grid set_xlim set_ylim plot scatter hist boxplot imshow cmap alpha bins tick_params annotate quiver contour barh stackplot subplots_adjust axhline axvline semilogx semilogy loglog polar streamplot hexbin pcolor tricontour errorbar clabel set_aspect violinplot set_axis_off spines text hatch plt axis plt.bar() plt.axis import figure pyplot highlight_text pypalettes plt.subplots() xlabel ylabel title legend colorbar savefig tight_layout grid set_xlim set_ylim plot scatter hist boxplot imshow cmap alpha bins tick_params annotate quiver contour barh stackplot subplots_adjust axhline axvline semilogx semilogy loglog polar streamplot hexbin pcolor tricontour errorbar clabel set_aspect violinplot set_axis_off spines text hatch plt axis plt.bar() plt.axis import figure pyplot highlight_text pypalettes plt.subplots() xlabel ylabel title legend colorbar savefig tight_layout grid set_xlim set_ylim plot scatter hist boxplot imshow cmap alpha bins tick_params annotate quiver contour barh stackplot subplots_adjust axhline axvline semilogx semilogy loglog polar streamplot hexbin pcolor tricontour errorbar clabel set_aspect violinplot set_axis_off spines text hatch plt axis plt.bar() plt.axis import figure pyplot highlight_text pypalettes plt.subplots() xlabel ylabel title legend colorbar savefig tight_layout grid set_xlim set_ylim plot scatter hist boxplot imshow cmap alpha bins tick_params annotate quiver contour barh stackplot subplots_adjust axhline axvline semilogx semilogy loglog polar streamplot hexbin pcolor tricontour errorbar clabel set_aspect violinplot set_axis_off spines text hatch plt axis plt.bar() plt.axis import figure pyplot highlight_text pypalettes plt.subplots() xlabel ylabel title legend colorbar savefig tight_layout grid set_xlim set_ylim plot scatter hist boxplot imshow cmap alpha bins tick_params annotate quiver contour barh stackplot subplots_adjust axhline axvline semilogx semilogy loglog polar streamplot hexbin pcolor tricontour errorbar clabel set_aspect violinplot set_axis_off spines text hatch plt axis plt.bar() plt.axis import figure pyplot highlight_text pypalettes plt.subplots() xlabel ylabel title legend colorbar savefig tight_layout grid set_xlim set_ylim plot scatter hist boxplot imshow cmap alpha bins tick_params annotate quiver contour barh stackplot subplots_adjust axhline axvline semilogx semilogy loglog polar streamplot hexbin pcolor tricontour errorbar clabel set_aspect violinplot set_axis_off spines text hatch plt axis plt.bar() plt.axis import figure pyplot highlight_text pypalettes plt.subplots() xlabel ylabel title legend colorbar savefig tight_layout grid set_xlim set_ylim plot scatter hist boxplot imshow cmap alpha bins tick_params annotate quiver contour barh stackplot subplots_adjust axhline axvline semilogx semilogy loglog polar streamplot hexbin pcolor tricontour errorbar clabel set_aspect violinplot set_axis_off spines text hatch plt axis plt.bar() plt.axis import figure pyplot highlight_text pypalettes plt.subplots() xlabel ylabel title legend colorbar savefig tight_layout grid set_xlim set_ylim plot scatter hist boxplot imshow cmap alpha bins tick_params annotate quiver contour barh stackplot subplots_adjust axhline axvline semilogx semilogy loglog polar streamplot hexbin pcolor tricontour errorbar clabel set_aspect violinplot set_axis_off spines text hatch plt axis plt.bar() plt.axis import figure pyplot highlight_text pypalettes plt.subplots() xlabel ylabel title legend colorbar savefig tight_layout grid set_xlim set_ylim plot scatter hist boxplot imshow cmap alpha bins tick_params annotate quiver contour barh stackplot subplots_adjust axhline axvline semilogx semilogy loglog polar streamplot hexbin pcolor tricontour errorbar clabel set_aspect violinplot set_axis_off spines text hatch plt axis plt.bar() plt.axis import figure pyplot highlight_text pypalettes plt.subplots() xlabel ylabel title legend colorbar savefig tight_layout grid set_xlim set_ylim plot scatter hist boxplot imshow cmap alpha bins tick_params annotate quiver contour barh stackplot subplots_adjust axhline axvline semilogx semilogy loglog polar streamplot hexbin pcolor tricontour errorbar clabel set_aspect violinplot set_axis_off spines text hatch plt axis plt.bar() plt.axis import figure pyplot highlight_text pypalettes plt.subplots() xlabel ylabel title legend colorbar savefig tight_layout grid set_xlim set_ylim plot scatter hist boxplot imshow cmap alpha bins tick_params annotate quiver contour barh stackplot subplots_adjust axhline axvline semilogx semilogy loglog polar streamplot hexbin pcolor tricontour errorbar clabel set_aspect violinplot set_axis_off spines text hatch plt axis plt.bar() plt.axis import figure pyplot highlight_text pypalettes plt.subplots() xlabel ylabel title legend colorbar savefig tight_layout grid set_xlim set_ylim plot scatter hist boxplot imshow cmap alpha bins tick_params annotate quiver contour barh stackplot subplots_adjust axhline axvline semilogx semilogy loglog polar streamplot hexbin pcolor tricontour errorbar clabel set_aspect violinplot set_axis_off spines text hatch plt axis plt.bar() plt.axis import figure pyplot highlight_text pypalettes plt.subplots() xlabel ylabel title legend colorbar savefig tight_layout grid set_xlim set_ylim plot scatter hist boxplot imshow cmap alpha bins tick_params annotate quiver contour barh stackplot subplots_adjust axhline axvline semilogx semilogy loglog polar streamplot hexbin pcolor tricontour errorbar clabel set_aspect violinplot set_axis_off spines text hatch plt axis plt.bar() plt.axis import figure pyplot highlight_text pypalettes plt.subplots() xlabel ylabel title legend colorbar savefig tight_layout grid set_xlim set_ylim plot scatter hist boxplot imshow cmap alpha bins tick_params annotate quiver contour barh stackplot subplots_adjust axhline axvline semilogx semilogy loglog polar streamplot hexbin pcolor tricontour errorbar clabel set_aspect violinplot set_axis_off spines text hatch plt axis plt.bar() plt.axis import figure pyplot highlight_text pypalettes plt.subplots() xlabel ylabel title legend colorbar savefig tight_layout grid set_xlim set_ylim plot scatter hist boxplot imshow cmap alpha bins tick_params annotate quiver contour barh stackplot subplots_adjust axhline axvline semilogx semilogy loglog polar streamplot hexbin pcolor tricontour errorbar clabel set_aspect violinplot set_axis_off spines text hatch plt axis plt.bar() plt.axis import figure pyplot highlight_text pypalettes plt.subplots() xlabel ylabel title legend colorbar savefig tight_layout grid set_xlim set_ylim plot scatter hist boxplot imshow cmap alpha bins tick_params annotate quiver contour barh stackplot subplots_adjust axhline axvline semilogx semilogy loglog polar streamplot hexbin pcolor tricontour errorbar clabel set_aspect violinplot set_axis_off spines text hatch plt axis plt.bar() plt.axis import figure pyplot highlight_text pypalettes plt.subplots() xlabel ylabel title legend colorbar savefig tight_layout grid set_xlim set_ylim plot scatter hist boxplot imshow cmap alpha bins tick_params annotate quiver contour barh stackplot subplots_adjust axhline axvline semilogx semilogy loglog polar streamplot hexbin pcolor tricontour errorbar clabel set_aspect violinplot set_axis_off spines text hatch plt axis plt.bar() plt.axis import figure pyplot highlight_text pypalettes plt.subplots() xlabel ylabel title legend colorbar savefig tight_layout grid set_xlim set_ylim plot scatter hist boxplot imshow cmap alpha bins tick_params annotate quiver contour barh stackplot subplots_adjust axhline axvline semilogx semilogy loglog polar streamplot hexbin pcolor tricontour errorbar clabel set_aspect violinplot set_axis_off spines text hatch plt axis plt.bar() plt.axis import figure pyplot highlight_text pypalettes plt.subplots() xlabel ylabel title legend colorbar savefig tight_layout grid set_xlim set_ylim plot scatter hist boxplot imshow cmap alpha bins tick_params annotate quiver contour barh stackplot subplots_adjust axhline axvline semilogx semilogy loglog polar streamplot hexbin pcolor tricontour errorbar clabel set_aspect violinplot set_axis_off spines text hatch plt axis plt.bar() plt.axis import figure pyplot highlight_text pypalettes plt.subplots() xlabel ylabel title legend colorbar savefig tight_layout grid set_xlim set_ylim plot scatter hist boxplot imshow cmap alpha bins tick_params annotate quiver contour barh stackplot subplots_adjust axhline axvline semilogx semilogy loglog polar streamplot hexbin pcolor tricontour errorbar clabel set_aspect violinplot set_axis_off spines text hatch plt axis plt.bar() plt.axis import figure pyplot highlight_text pypalettes plt.subplots() xlabel ylabel title legend colorbar savefig tight_layout grid set_xlim set_ylim plot scatter hist boxplot imshow cmap alpha bins tick_params annotate quiver contour barh stackplot subplots_adjust axhline axvline semilogx semilogy loglog polar streamplot hexbin pcolor tricontour errorbar clabel set_aspect violinplot set_axis_off spines text hatch plt axis plt.bar() plt.axis import figure pyplot highlight_text pypalettes plt.subplots() xlabel ylabel title legend colorbar savefig tight_layout grid set_xlim set_ylim plot scatter hist boxplot imshow cmap alpha bins tick_params annotate quiver contour barh stackplot subplots_adjust axhline axvline semilogx semilogy loglog polar streamplot hexbin pcolor tricontour errorbar clabel set_aspect violinplot set_axis_off spines text hatch plt axis plt.bar() plt.axis import figure pyplot highlight_text pypalettes plt.subplots() xlabel ylabel title legend colorbar savefig tight_layout grid set_xlim set_ylim plot scatter hist boxplot imshow cmap alpha bins tick_params annotate quiver contour barh stackplot subplots_adjust axhline axvline semilogx semilogy loglog polar streamplot hexbin pcolor tricontour errorbar clabel set_aspect violinplot set_axis_off spines text hatch plt axis plt.bar() plt.axis import figure pyplot highlight_text pypalettes plt.subplots() xlabel ylabel title legend colorbar savefig tight_layout grid set_xlim set_ylim plot scatter hist boxplot imshow cmap alpha bins tick_params annotate quiver contour barh stackplot subplots_adjust axhline axvline semilogx semilogy loglog polar streamplot hexbin pcolor tricontour errorbar clabel set_aspect violinplot set_axis_off spines text hatch plt axis plt.bar() plt.axis import figure pyplot highlight_text pypalettes plt.subplots() xlabel ylabel title legend colorbar savefig tight_layout grid set_xlim set_ylim plot scatter hist boxplot imshow cmap alpha bins tick_params annotate quiver contour barh stackplot subplots_adjust axhline axvline semilogx semilogy loglog polar streamplot hexbin pcolor tricontour errorbar clabel set_aspect violinplot set_axis_off spines text hatch plt axis plt.bar() plt.axis import figure pyplot highlight_text pypalettes plt.subplots() xlabel ylabel title legend colorbar savefig tight_layout grid set_xlim set_ylim plot scatter hist boxplot imshow cmap alpha bins tick_params annotate quiver contour barh stackplot subplots_adjust axhline axvline semilogx semilogy loglog polar streamplot hexbin pcolor tricontour errorbar clabel set_aspect violinplot set_axis_off spines text hatch plt axis plt.bar() plt.axis import figure pyplot highlight_text pypalettes plt.subplots() xlabel ylabel title legend colorbar savefig tight_layout grid set_xlim set_ylim plot scatter hist boxplot imshow cmap alpha bins tick_params annotate quiver contour barh stackplot subplots_adjust axhline axvline semilogx semilogy loglog polar streamplot hexbin pcolor tricontour errorbar clabel set_aspect violinplot set_axis_off spines text hatch plt axis plt.bar() plt.axis import figure pyplot highlight_text pypalettes plt.subplots() xlabel ylabel title legend colorbar savefig tight_layout grid set_xlim set_ylim plot scatter hist boxplot imshow cmap alpha bins tick_params annotate quiver contour barh stackplot subplots_adjust axhline axvline semilogx semilogy loglog polar streamplot hexbin pcolor tricontour errorbar clabel set_aspect violinplot set_axis_off spines text hatch plt axis plt.bar() plt.axis import figure pyplot highlight_text pypalettes plt.subplots() xlabel ylabel title legend colorbar savefig tight_layout grid set_xlim set_ylim plot scatter hist boxplot imshow cmap alpha bins tick_params annotate quiver contour barh stackplot subplots_adjust axhline axvline semilogx semilogy loglog polar streamplot hexbin pcolor tricontour errorbar clabel set_aspect violinplot set_axis_off spines text hatch plt axis plt.bar() plt.axis import figure pyplot highlight_text pypalettes plt.subplots() xlabel ylabel title legend colorbar savefig tight_layout grid set_xlim set_ylim plot scatter hist boxplot imshow cmap alpha bins tick_params annotate quiver contour barh stackplot subplots_adjust axhline axvline semilogx semilogy loglog polar streamplot hexbin pcolor tricontour errorbar clabel set_aspect violinplot set_axis_off spines text hatch plt axis plt.bar() plt.axis import figure pyplot highlight_text pypalettes plt.subplots() xlabel ylabel title legend colorbar savefig tight_layout grid set_xlim set_ylim plot scatter hist boxplot imshow cmap alpha bins tick_params annotate quiver contour barh stackplot subplots_adjust axhline axvline semilogx semilogy loglog polar streamplot hexbin pcolor tricontour errorbar clabel set_aspect violinplot set_axis_off spines text hatch plt axis plt.bar() plt.axis import figure pyplot highlight_text pypalettes plt.subplots() xlabel ylabel title legend colorbar savefig tight_layout grid set_xlim set_ylim plot scatter hist boxplot imshow cmap alpha bins tick_params annotate quiver contour barh stackplot subplots_adjust axhline axvline semilogx semilogy loglog polar streamplot hexbin pcolor tricontour errorbar clabel set_aspect violinplot set_axis_off spines text hatch plt axis plt.bar() plt.axis import figure pyplot highlight_text pypalettes plt.subplots() xlabel ylabel title legend colorbar savefig tight_layout grid set_xlim set_ylim plot scatter hist boxplot imshow cmap alpha bins tick_params annotate quiver contour barh stackplot subplots_adjust axhline axvline semilogx semilogy loglog polar streamplot hexbin pcolor tricontour errorbar clabel set_aspect violinplot set_axis_off spines text hatch plt axis plt.bar() plt.axis import figure pyplot highlight_text pypalettes plt.subplots() xlabel ylabel title legend colorbar savefig tight_layout grid set_xlim set_ylim plot scatter hist boxplot imshow cmap alpha bins tick_params annotate quiver contour barh stackplot subplots_adjust axhline axvline semilogx semilogy loglog polar streamplot hexbin pcolor tricontour errorbar clabel set_aspect violinplot set_axis_off spines text hatch plt axis plt.bar() plt.axis import figure pyplot highlight_text pypalettes plt.subplots() xlabel ylabel title legend colorbar savefig tight_layout grid set_xlim set_ylim plot scatter hist boxplot imshow cmap alpha bins tick_params annotate quiver contour barh stackplot subplots_adjust axhline axvline semilogx semilogy loglog polar streamplot hexbin pcolor tricontour errorbar clabel set_aspect violinplot set_axis_off spines text hatch plt axis plt.bar() plt.axis import figure pyplot highlight_text pypalettes plt.subplots() xlabel ylabel title legend colorbar savefig tight_layout grid set_xlim set_ylim plot scatter hist boxplot imshow cmap alpha bins tick_params annotate quiver contour barh stackplot subplots_adjust axhline axvline semilogx semilogy loglog polar streamplot hexbin pcolor tricontour errorbar clabel set_aspect violinplot set_axis_off spines text hatch plt axis plt.bar() plt.axis import figure pyplot highlight_text pypalettes plt.subplots() xlabel ylabel title legend colorbar savefig tight_layout grid set_xlim set_ylim plot scatter hist boxplot imshow cmap alpha bins tick_params annotate quiver contour barh stackplot subplots_adjust axhline axvline semilogx semilogy loglog polar streamplot hexbin pcolor tricontour errorbar clabel set_aspect violinplot set_axis_off spines text hatch plt axis plt.bar() plt.axis import figure pyplot highlight_text pypalettes plt.subplots() xlabel ylabel title legend colorbar savefig tight_layout grid set_xlim set_ylim plot scatter hist boxplot imshow cmap alpha bins tick_params annotate quiver contour barh stackplot subplots_adjust axhline axvline semilogx semilogy loglog polar streamplot hexbin pcolor tricontour errorbar clabel set_aspect violinplot set_axis_off spines text hatch plt axis plt.bar() plt.axis import figure pyplot highlight_text pypalettes plt.subplots() xlabel ylabel title legend colorbar savefig tight_layout grid set_xlim set_ylim plot scatter hist boxplot imshow cmap alpha bins tick_params annotate quiver contour barh stackplot subplots_adjust axhline axvline semilogx semilogy loglog polar streamplot hexbin pcolor tricontour errorbar clabel set_aspect violinplot set_axis_off spines text hatch plt axis plt.bar() plt.axis import figure pyplot highlight_text pypalettes plt.subplots() xlabel ylabel title legend colorbar savefig tight_layout grid set_xlim set_ylim plot scatter hist boxplot imshow cmap alpha bins tick_params annotate quiver contour barh stackplot subplots_adjust axhline axvline semilogx semilogy loglog polar streamplot hexbin pcolor tricontour errorbar clabel set_aspect violinplot set_axis_off spines text hatch plt axis plt.bar() plt.axis import figure pyplot highlight_text pypalettes plt.subplots() xlabel ylabel title legend colorbar savefig tight_layout grid set_xlim set_ylim plot scatter hist boxplot imshow cmap alpha bins tick_params annotate quiver contour barh stackplot subplots_adjust axhline axvline semilogx semilogy loglog polar streamplot hexbin pcolor tricontour errorbar clabel set_aspect violinplot set_axis_off spines text hatch plt axis plt.bar() plt.axis import figure pyplot highlight_text pypalettes plt.subplots() xlabel ylabel title legend colorbar savefig tight_layout grid set_xlim set_ylim plot scatter hist boxplot imshow cmap alpha bins tick_params annotate quiver contour barh stackplot subplots_adjust axhline axvline semilogx semilogy loglog polar streamplot hexbin pcolor tricontour errorbar clabel set_aspect violinplot set_axis_off spines text hatch plt axis plt.bar() plt.axis import figure pyplot highlight_text pypalettes plt.subplots() xlabel ylabel title legend colorbar savefig tight_layout grid set_xlim set_ylim plot scatter hist boxplot imshow cmap alpha bins tick_params annotate quiver contour barh stackplot subplots_adjust axhline axvline semilogx semilogy loglog polar streamplot hexbin pcolor tricontour errorbar clabel set_aspect violinplot set_axis_off spines text hatch plt axis plt.bar() plt.axis import figure pyplot highlight_text pypalettes plt.subplots() xlabel ylabel title legend colorbar savefig tight_layout grid set_xlim set_ylim plot scatter hist boxplot imshow cmap alpha bins tick_params annotate quiver contour barh stackplot subplots_adjust axhline axvline semilogx semilogy loglog polar streamplot hexbin pcolor tricontour errorbar clabel set_aspect violinplot set_axis_off spines text hatch plt axis plt.bar() plt.axis import figure pyplot highlight_text pypalettes plt.subplots() xlabel ylabel title legend colorbar savefig tight_layout grid set_xlim set_ylim plot scatter hist boxplot imshow cmap alpha bins tick_params annotate quiver contour barh stackplot subplots_adjust axhline axvline semilogx semilogy loglog polar streamplot hexbin pcolor tricontour errorbar clabel set_aspect violinplot set_axis_off spines text hatch plt axis plt.bar() plt.axis import figure pyplot highlight_text pypalettes plt.subplots() xlabel ylabel title legend colorbar savefig tight_layout grid set_xlim set_ylim plot scatter hist boxplot imshow cmap alpha bins tick_params annotate quiver contour barh stackplot subplots_adjust axhline axvline semilogx semilogy loglog polar streamplot hexbin pcolor tricontour errorbar clabel set_aspect violinplot set_axis_off spines text hatch plt axis plt.bar() plt.axis import figure pyplot highlight_text pypalettes plt.subplots() xlabel ylabel title legend colorbar savefig tight_layout grid set_xlim set_ylim plot scatter hist boxplot imshow cmap alpha bins tick_params annotate quiver contour barh stackplot subplots_adjust axhline axvline semilogx semilogy loglog polar streamplot hexbin pcolor tricontour errorbar clabel set_aspect violinplot set_axis_off spines text hatch plt axis plt.bar() plt.axis import figure pyplot highlight_text pypalettes plt.subplots() xlabel ylabel title legend colorbar savefig tight_layout grid set_xlim set_ylim plot scatter hist boxplot imshow cmap alpha bins tick_params annotate quiver contour barh stackplot subplots_adjust axhline axvline semilogx semilogy loglog polar streamplot hexbin pcolor tricontour errorbar clabel set_aspect violinplot set_axis_off spines text hatch plt axis plt.bar() plt.axis import figure pyplot highlight_text pypalettes plt.subplots() xlabel ylabel title legend colorbar savefig tight_layout grid set_xlim set_ylim plot scatter hist boxplot imshow cmap alpha bins tick_params annotate quiver contour barh stackplot subplots_adjust axhline axvline semilogx semilogy loglog polar streamplot hexbin pcolor tricontour errorbar clabel set_aspect violinplot set_axis_off spines text hatch plt axis plt.bar() plt.axis import figure pyplot highlight_text pypalettes plt.subplots() xlabel ylabel title legend colorbar savefig tight_layout grid set_xlim set_ylim plot scatter hist boxplot imshow cmap alpha bins tick_params annotate quiver contour barh stackplot subplots_adjust axhline axvline semilogx semilogy loglog polar streamplot hexbin pcolor tricontour errorbar clabel set_aspect violinplot set_axis_off spines text hatch plt axis plt.bar() plt.axis import figure pyplot highlight_text pypalettes plt.subplots() xlabel ylabel title legend colorbar savefig tight_layout grid set_xlim set_ylim plot scatter hist boxplot imshow cmap alpha bins tick_params annotate quiver contour barh stackplot subplots_adjust axhline axvline semilogx semilogy loglog polar streamplot hexbin pcolor tricontour errorbar clabel set_aspect violinplot set_axis_off spines text hatch plt axis plt.bar() plt.axis import figure pyplot highlight_text pypalettes plt.subplots() xlabel ylabel title legend colorbar savefig tight_layout grid set_xlim set_ylim plot scatter hist boxplot imshow cmap alpha bins tick_params annotate quiver contour barh stackplot subplots_adjust axhline axvline semilogx semilogy loglog polar streamplot hexbin pcolor tricontour errorbar clabel set_aspect violinplot set_axis_off spines text hatch plt axis plt.bar() plt.axis import figure pyplot highlight_text pypalettes plt.subplots() xlabel ylabel title legend colorbar savefig tight_layout grid set_xlim set_ylim plot scatter hist boxplot imshow cmap alpha bins tick_params annotate quiver contour barh stackplot subplots_adjust axhline axvline semilogx semilogy loglog polar streamplot hexbin pcolor tricontour errorbar clabel set_aspect violinplot set_axis_off spines text hatch plt axis plt.bar() plt.axis import figure pyplot highlight_text pypalettes plt.subplots() xlabel ylabel title legend colorbar savefig tight_layout grid set_xlim set_ylim plot scatter hist boxplot imshow cmap alpha bins tick_params annotate quiver contour barh stackplot subplots_adjust axhline axvline semilogx semilogy loglog polar streamplot hexbin pcolor tricontour errorbar clabel set_aspect violinplot set_axis_off spines text hatch plt axis plt.bar() plt.axis import figure pyplot highlight_text pypalettes plt.subplots() xlabel ylabel title legend colorbar savefig tight_layout grid set_xlim set_ylim plot scatter hist boxplot imshow cmap alpha bins tick_params annotate quiver contour barh stackplot subplots_adjust axhline axvline semilogx semilogy loglog polar streamplot hexbin pcolor tricontour errorbar clabel set_aspect violinplot set_axis_off spines text hatch plt axis plt.bar() plt.axis import figure pyplot highlight_text pypalettes plt.subplots() xlabel ylabel title legend colorbar savefig tight_layout grid set_xlim set_ylim plot scatter hist boxplot imshow cmap alpha bins tick_params annotate quiver contour barh stackplot subplots_adjust axhline axvline semilogx semilogy loglog polar streamplot hexbin pcolor tricontour errorbar clabel set_aspect violinplot set_axis_off spines text hatch plt axis plt.bar() plt.axis import figure pyplot highlight_text pypalettes plt.subplots() xlabel ylabel title legend colorbar savefig tight_layout grid set_xlim set_ylim plot scatter hist boxplot imshow cmap alpha bins tick_params annotate quiver contour barh stackplot subplots_adjust axhline axvline semilogx semilogy loglog polar streamplot hexbin pcolor tricontour errorbar clabel set_aspect violinplot set_axis_off spines text hatch plt axis plt.bar() plt.axis import figure pyplot highlight_text pypalettes plt.subplots() xlabel ylabel title legend colorbar savefig tight_layout grid set_xlim set_ylim plot scatter hist boxplot imshow cmap alpha bins tick_params annotate quiver contour barh stackplot subplots_adjust axhline axvline semilogx semilogy loglog polar streamplot hexbin pcolor tricontour errorbar clabel set_aspect violinplot set_axis_off spines text hatch plt axis plt.bar() plt.axis import figure pyplot highlight_text pypalettes plt.subplots() xlabel ylabel title legend colorbar savefig tight_layout grid set_xlim set_ylim plot scatter hist boxplot imshow cmap alpha bins tick_params annotate quiver contour barh stackplot subplots_adjust axhline axvline semilogx semilogy loglog polar streamplot hexbin pcolor tricontour errorbar clabel set_aspect violinplot set_axis_off spines text hatch plt axis plt.bar() plt.axis import figure pyplot highlight_text pypalettes plt.subplots() xlabel ylabel title legend colorbar savefig tight_layout grid set_xlim set_ylim plot scatter hist boxplot imshow cmap alpha bins tick_params annotate quiver contour barh stackplot subplots_adjust axhline axvline semilogx semilogy loglog polar streamplot hexbin pcolor tricontour errorbar clabel set_aspect violinplot set_axis_off spines text hatch plt axis plt.bar() plt.axis import figure pyplot highlight_text pypalettes plt.subplots() xlabel ylabel title legend colorbar savefig tight_layout grid set_xlim set_ylim plot scatter hist boxplot imshow cmap alpha bins tick_params annotate quiver contour barh stackplot subplots_adjust axhline axvline semilogx semilogy loglog polar streamplot hexbin pcolor tricontour errorbar clabel set_aspect violinplot set_axis_off spines text hatch plt axis plt.bar() plt.axis import figure pyplot highlight_text pypalettes plt.subplots() xlabel ylabel title legend colorbar savefig tight_layout grid set_xlim set_ylim plot scatter hist boxplot imshow cmap alpha bins tick_params annotate quiver contour barh stackplot subplots_adjust axhline axvline semilogx semilogy loglog polar streamplot hexbin pcolor tricontour errorbar clabel set_aspect violinplot set_axis_off spines text hatch plt axis plt.bar() plt.axis import figure pyplot highlight_text pypalettes plt.subplots() xlabel ylabel title legend colorbar savefig tight_layout grid set_xlim set_ylim plot scatter hist boxplot imshow cmap alpha bins tick_params annotate quiver contour barh stackplot subplots_adjust axhline axvline semilogx semilogy loglog polar streamplot hexbin pcolor tricontour errorbar clabel set_aspect violinplot set_axis_off spines text hatch plt axis plt.bar() plt.axis import figure pyplot highlight_text pypalettes plt.subplots() xlabel ylabel title legend colorbar savefig tight_layout grid set_xlim set_ylim plot scatter hist boxplot imshow cmap alpha bins tick_params annotate quiver contour barh stackplot subplots_adjust axhline axvline semilogx semilogy loglog polar streamplot hexbin pcolor tricontour errorbar clabel set_aspect violinplot set_axis_off spines text hatch plt axis plt.bar() plt.axis import figure pyplot highlight_text pypalettes plt.subplots() xlabel ylabel title legend colorbar savefig tight_layout grid set_xlim set_ylim plot scatter hist boxplot imshow cmap alpha bins tick_params annotate quiver contour barh stackplot subplots_adjust axhline axvline semilogx semilogy loglog polar streamplot hexbin pcolor tricontour errorbar clabel set_aspect violinplot set_axis_off spines text hatch plt axis plt.bar() plt.axis import figure pyplot highlight_text pypalettes plt.subplots() xlabel ylabel title legend colorbar savefig tight_layout grid set_xlim set_ylim plot scatter hist boxplot imshow cmap alpha bins tick_params annotate quiver contour barh stackplot subplots_adjust axhline axvline semilogx semilogy loglog polar streamplot hexbin pcolor tricontour errorbar clabel set_aspect violinplot set_axis_off spines text hatch plt axis plt.bar() plt.axis import figure pyplot highlight_text pypalettes plt.subplots() xlabel ylabel title legend colorbar savefig tight_layout grid set_xlim set_ylim plot scatter hist boxplot imshow cmap alpha bins tick_params annotate quiver contour barh stackplot subplots_adjust axhline axvline semilogx semilogy loglog polar streamplot hexbin pcolor tricontour errorbar clabel set_aspect violinplot set_axis_off spines text hatch plt axis plt.bar() plt.axis import figure pyplot highlight_text pypalettes plt.subplots() xlabel ylabel title legend colorbar savefig tight_layout grid set_xlim set_ylim plot scatter hist boxplot imshow cmap alpha bins tick_params annotate quiver contour barh stackplot subplots_adjust axhline axvline semilogx semilogy loglog polar streamplot hexbin pcolor tricontour errorbar clabel set_aspect violinplot set_axis_off spines text hatch plt axis plt.bar() plt.axis import figure pyplot highlight_text pypalettes plt.subplots() xlabel ylabel title legend colorbar savefig tight_layout grid set_xlim set_ylim plot scatter hist boxplot imshow cmap alpha bins tick_params annotate quiver contour barh stackplot subplots_adjust axhline axvline semilogx semilogy loglog polar streamplot hexbin pcolor tricontour errorbar clabel set_aspect violinplot set_axis_off spines text hatch plt axis plt.bar() plt.axis import figure pyplot highlight_text pypalettes plt.subplots() xlabel ylabel title legend colorbar savefig tight_layout grid set_xlim set_ylim plot scatter hist boxplot imshow cmap alpha bins tick_params annotate quiver contour barh stackplot subplots_adjust axhline axvline semilogx semilogy loglog polar streamplot hexbin pcolor tricontour errorbar clabel set_aspect violinplot set_axis_off spines text hatch plt axis plt.bar() plt.axis import figure pyplot highlight_text pypalettes plt.subplots() xlabel ylabel title legend colorbar savefig tight_layout grid set_xlim set_ylim plot scatter hist boxplot imshow cmap alpha bins tick_params annotate quiver contour barh stackplot subplots_adjust axhline axvline semilogx semilogy loglog polar streamplot hexbin pcolor tricontour errorbar clabel set_aspect violinplot set_axis_off spines text hatch plt axis plt.bar() plt.axis import figure pyplot highlight_text pypalettes plt.subplots() xlabel ylabel title legend colorbar savefig tight_layout grid set_xlim set_ylim plot scatter hist boxplot imshow cmap alpha bins tick_params annotate quiver contour barh stackplot subplots_adjust axhline axvline semilogx semilogy loglog polar streamplot hexbin pcolor tricontour errorbar clabel set_aspect violinplot set_axis_off spines text hatch plt axis plt.bar() plt.axis import figure pyplot highlight_text pypalettes plt.subplots() xlabel ylabel title legend colorbar savefig tight_layout grid set_xlim set_ylim plot scatter hist boxplot imshow cmap alpha bins tick_params annotate quiver contour barh stackplot subplots_adjust axhline axvline semilogx semilogy loglog polar streamplot hexbin pcolor tricontour errorbar clabel set_aspect violinplot set_axis_off spines text hatch plt axis plt.bar() plt.axis import figure pyplot highlight_text pypalettes plt.subplots() xlabel ylabel title legend colorbar savefig tight_layout grid set_xlim set_ylim plot scatter hist boxplot imshow cmap alpha bins tick_params annotate quiver contour barh stackplot subplots_adjust axhline axvline semilogx semilogy loglog polar streamplot hexbin pcolor tricontour errorbar clabel set_aspect violinplot set_axis_off spines text hatch plt axis plt.bar() plt.axis import figure pyplot highlight_text pypalettes plt.subplots() xlabel ylabel title legend colorbar savefig tight_layout grid set_xlim set_ylim plot scatter hist boxplot imshow cmap alpha bins tick_params annotate quiver contour barh stackplot subplots_adjust axhline axvline semilogx semilogy loglog polar streamplot hexbin pcolor tricontour errorbar clabel set_aspect violinplot set_axis_off spines text hatch plt axis plt.bar() plt.axis import figure pyplot highlight_text pypalettes plt.subplots() xlabel ylabel title legend colorbar savefig tight_layout grid set_xlim set_ylim plot scatter hist boxplot imshow cmap alpha bins tick_params annotate quiver contour barh stackplot subplots_adjust axhline axvline semilogx semilogy loglog polar streamplot hexbin pcolor tricontour errorbar clabel set_aspect violinplot set_axis_off spines text hatch plt axis plt.bar() plt.axis import figure pyplot highlight_text pypalettes plt.subplots() xlabel ylabel title legend colorbar savefig tight_layout grid set_xlim set_ylim plot scatter hist boxplot imshow cmap alpha bins tick_params annotate quiver contour barh stackplot subplots_adjust axhline axvline semilogx semilogy loglog polar streamplot hexbin pcolor tricontour errorbar clabel set_aspect violinplot set_axis_off spines text hatch plt axis plt.bar() plt.axis import figure pyplot highlight_text pypalettes plt.subplots() xlabel ylabel title legend colorbar savefig tight_layout grid set_xlim set_ylim plot scatter hist boxplot imshow cmap alpha bins tick_params annotate quiver contour barh stackplot subplots_adjust axhline axvline semilogx semilogy loglog polar streamplot hexbin pcolor tricontour errorbar clabel set_aspect violinplot set_axis_off spines text hatch plt axis plt.bar() plt.axis import figure pyplot highlight_text pypalettes plt.subplots() xlabel ylabel title legend colorbar savefig tight_layout grid set_xlim set_ylim plot scatter hist boxplot imshow cmap alpha bins tick_params annotate quiver contour barh stackplot subplots_adjust axhline axvline semilogx semilogy loglog polar streamplot hexbin pcolor tricontour errorbar clabel set_aspect violinplot set_axis_off spines text hatch plt axis plt.bar() plt.axis import figure pyplot highlight_text pypalettes plt.subplots() xlabel ylabel title legend colorbar savefig tight_layout grid set_xlim set_ylim plot scatter hist boxplot imshow cmap alpha bins tick_params annotate quiver contour barh stackplot subplots_adjust axhline axvline semilogx semilogy loglog polar streamplot hexbin pcolor tricontour errorbar clabel set_aspect violinplot set_axis_off spines text hatch plt axis plt.bar() plt.axis import figure pyplot highlight_text pypalettes plt.subplots() xlabel ylabel title legend colorbar savefig tight_layout grid set_xlim set_ylim plot scatter hist boxplot imshow cmap alpha bins tick_params annotate quiver contour barh stackplot subplots_adjust axhline axvline semilogx semilogy loglog polar streamplot hexbin pcolor tricontour errorbar clabel set_aspect violinplot set_axis_off spines text hatch plt axis plt.bar() plt.axis import figure pyplot highlight_text pypalettes plt.subplots() xlabel ylabel title legend colorbar savefig tight_layout grid set_xlim set_ylim plot scatter hist boxplot imshow cmap alpha bins tick_params annotate quiver contour barh stackplot subplots_adjust axhline axvline semilogx semilogy loglog polar streamplot hexbin pcolor tricontour errorbar clabel set_aspect violinplot set_axis_off spines text hatch plt axis plt.bar() plt.axis import figure pyplot highlight_text pypalettes plt.subplots() xlabel ylabel title legend colorbar savefig tight_layout grid set_xlim set_ylim plot scatter hist boxplot imshow cmap alpha bins tick_params annotate quiver contour barh stackplot subplots_adjust axhline axvline semilogx semilogy loglog polar streamplot hexbin pcolor tricontour errorbar clabel set_aspect violinplot set_axis_off spines text hatch plt axis plt.bar() plt.axis import figure pyplot highlight_text pypalettes plt.subplots() xlabel ylabel title legend colorbar savefig tight_layout grid set_xlim set_ylim plot scatter hist boxplot imshow cmap alpha bins tick_params annotate quiver contour barh stackplot subplots_adjust axhline axvline semilogx semilogy loglog polar streamplot hexbin pcolor tricontour errorbar clabel set_aspect violinplot set_axis_off spines text hatch plt axis plt.bar() plt.axis import figure pyplot highlight_text pypalettes plt.subplots() xlabel ylabel title legend colorbar savefig tight_layout grid set_xlim set_ylim plot scatter hist boxplot imshow cmap alpha bins tick_params annotate quiver contour barh stackplot subplots_adjust axhline axvline semilogx semilogy loglog polar streamplot hexbin pcolor tricontour errorbar clabel set_aspect violinplot set_axis_off spines text hatch plt axis plt.bar() plt.axis import figure pyplot highlight_text pypalettes plt.subplots() xlabel ylabel title legend colorbar savefig tight_layout grid set_xlim set_ylim plot scatter hist boxplot imshow cmap alpha bins tick_params annotate quiver contour barh stackplot subplots_adjust axhline axvline semilogx semilogy loglog polar streamplot hexbin pcolor tricontour errorbar clabel set_aspect violinplot set_axis_off spines text hatch plt axis plt.bar() plt.axis import figure pyplot highlight_text pypalettes plt.subplots() xlabel ylabel title legend colorbar savefig tight_layout grid set_xlim set_ylim plot scatter hist boxplot imshow cmap alpha bins tick_params annotate quiver contour barh stackplot subplots_adjust axhline axvline semilogx semilogy loglog polar streamplot hexbin pcolor tricontour errorbar clabel set_aspect violinplot set_axis_off spines text hatch plt axis plt.bar() plt.axis import figure pyplot highlight_text pypalettes plt.subplots() xlabel ylabel title legend colorbar savefig tight_layout grid set_xlim set_ylim plot scatter hist boxplot imshow cmap alpha bins tick_params annotate quiver contour barh stackplot subplots_adjust axhline axvline semilogx semilogy loglog polar streamplot hexbin pcolor tricontour errorbar clabel set_aspect violinplot set_axis_off spines text hatch plt axis plt.bar() plt.axis import figure pyplot highlight_text pypalettes plt.subplots() xlabel ylabel title legend colorbar savefig tight_layout grid set_xlim set_ylim plot scatter hist boxplot imshow cmap alpha bins tick_params annotate quiver contour barh stackplot subplots_adjust axhline axvline semilogx semilogy loglog polar streamplot hexbin pcolor tricontour errorbar clabel set_aspect violinplot set_axis_off spines text hatch plt axis plt.bar() plt.axis import figure pyplot highlight_text pypalettes plt.subplots() xlabel ylabel title legend colorbar savefig tight_layout grid set_xlim set_ylim plot scatter hist boxplot imshow cmap alpha bins tick_params annotate quiver contour barh stackplot subplots_adjust axhline axvline semilogx semilogy loglog polar streamplot hexbin pcolor tricontour errorbar clabel set_aspect violinplot set_axis_off spines text hatch plt axis plt.bar() plt.axis import figure pyplot highlight_text pypalettes plt.subplots() xlabel ylabel title legend colorbar savefig tight_layout grid set_xlim set_ylim plot scatter hist boxplot imshow cmap alpha bins tick_params annotate quiver contour barh stackplot subplots_adjust axhline axvline semilogx semilogy loglog polar streamplot hexbin pcolor tricontour errorbar clabel set_aspect violinplot set_axis_off spines text hatch plt axis plt.bar() plt.axis import figure pyplot highlight_text pypalettes plt.subplots() xlabel ylabel title legend colorbar savefig tight_layout grid set_xlim set_ylim plot scatter hist boxplot imshow cmap alpha bins tick_params annotate quiver contour barh stackplot subplots_adjust axhline axvline semilogx semilogy loglog polar streamplot hexbin pcolor tricontour errorbar clabel set_aspect violinplot set_axis_off spines text hatch plt axis plt.bar() plt.axis import figure pyplot highlight_text pypalettes plt.subplots() xlabel ylabel title legend colorbar savefig tight_layout grid set_xlim set_ylim plot scatter hist boxplot imshow cmap alpha bins tick_params annotate quiver contour barh stackplot subplots_adjust axhline axvline semilogx semilogy loglog polar streamplot hexbin pcolor tricontour errorbar clabel set_aspect violinplot set_axis_off spines text hatch plt axis plt.bar() plt.axis import figure pyplot highlight_text pypalettes plt.subplots() xlabel ylabel title legend colorbar savefig tight_layout grid set_xlim set_ylim plot scatter hist boxplot imshow cmap alpha bins tick_params annotate quiver contour barh stackplot subplots_adjust axhline axvline semilogx semilogy loglog polar streamplot hexbin pcolor tricontour errorbar clabel set_aspect violinplot set_axis_off spines text hatch plt axis plt.bar() plt.axis import figure pyplot highlight_text pypalettes plt.subplots() xlabel ylabel title legend colorbar savefig tight_layout grid set_xlim set_ylim plot scatter hist boxplot imshow cmap alpha bins tick_params annotate quiver contour barh stackplot subplots_adjust axhline axvline semilogx semilogy loglog polar streamplot hexbin pcolor tricontour errorbar clabel set_aspect violinplot set_axis_off spines text hatch plt axis plt.bar() plt.axis import figure pyplot highlight_text pypalettes plt.subplots() xlabel ylabel title legend colorbar savefig tight_layout grid set_xlim set_ylim plot scatter hist boxplot imshow cmap alpha bins tick_params annotate quiver contour barh stackplot subplots_adjust axhline axvline semilogx semilogy loglog polar streamplot hexbin pcolor tricontour errorbar clabel set_aspect violinplot set_axis_off spines text hatch plt axis plt.bar() plt.axis import figure pyplot highlight_text pypalettes plt.subplots() xlabel ylabel title legend colorbar savefig tight_layout grid set_xlim set_ylim plot scatter hist boxplot imshow cmap alpha bins tick_params annotate quiver contour barh stackplot subplots_adjust axhline axvline semilogx semilogy loglog polar streamplot hexbin pcolor tricontour errorbar clabel set_aspect violinplot set_axis_off spines text hatch plt axis plt.bar() plt.axis import figure pyplot highlight_text pypalettes plt.subplots() xlabel ylabel title legend colorbar savefig tight_layout grid set_xlim set_ylim plot scatter hist boxplot imshow cmap alpha bins tick_params annotate quiver contour barh stackplot subplots_adjust axhline axvline semilogx semilogy loglog polar streamplot hexbin pcolor tricontour errorbar clabel set_aspect violinplot set_axis_off spines text hatch plt axis plt.bar() plt.axis import figure pyplot highlight_text pypalettes plt.subplots() xlabel ylabel title legend colorbar savefig tight_layout grid set_xlim set_ylim plot scatter hist boxplot imshow cmap alpha bins tick_params annotate quiver contour barh stackplot subplots_adjust axhline axvline semilogx semilogy loglog polar streamplot hexbin pcolor tricontour errorbar clabel set_aspect violinplot set_axis_off spines text hatch plt axis plt.bar() plt.axis import figure pyplot highlight_text pypalettes plt.subplots() xlabel ylabel title legend colorbar savefig tight_layout grid set_xlim set_ylim plot scatter hist boxplot imshow cmap alpha bins tick_params annotate quiver contour barh stackplot subplots_adjust axhline axvline semilogx semilogy loglog polar streamplot hexbin pcolor tricontour errorbar clabel set_aspect violinplot set_axis_off spines text hatch plt axis plt.bar() plt.axis import figure pyplot highlight_text pypalettes plt.subplots() xlabel ylabel title legend colorbar savefig tight_layout grid set_xlim set_ylim plot scatter hist boxplot imshow cmap alpha bins tick_params annotate quiver contour barh stackplot subplots_adjust axhline axvline semilogx semilogy loglog polar streamplot hexbin pcolor tricontour errorbar clabel set_aspect violinplot set_axis_off spines text hatch plt axis plt.bar() plt.axis import figure pyplot highlight_text pypalettes plt.subplots() xlabel ylabel title legend colorbar savefig tight_layout grid set_xlim set_ylim plot scatter hist boxplot imshow cmap alpha bins tick_params annotate quiver contour barh stackplot subplots_adjust axhline axvline semilogx semilogy loglog polar streamplot hexbin pcolor tricontour errorbar clabel set_aspect violinplot set_axis_off spines text hatch plt axis plt.bar() plt.axis import figure pyplot highlight_text pypalettes plt.subplots() xlabel ylabel title legend colorbar savefig tight_layout grid set_xlim set_ylim plot scatter hist boxplot imshow cmap alpha bins tick_params annotate quiver contour barh stackplot subplots_adjust axhline axvline semilogx semilogy loglog polar streamplot hexbin pcolor tricontour errorbar clabel set_aspect violinplot set_axis_off spines text hatch plt axis plt.bar() plt.axis import figure pyplot highlight_text pypalettes plt.subplots() xlabel ylabel title legend colorbar savefig tight_layout grid set_xlim set_ylim plot scatter hist boxplot imshow cmap alpha bins tick_params annotate quiver contour barh stackplot subplots_adjust axhline axvline semilogx semilogy loglog polar streamplot hexbin pcolor tricontour errorbar clabel set_aspect violinplot set_axis_off spines text hatch plt axis plt.bar() plt.axis import figure pyplot highlight_text pypalettes plt.subplots() xlabel ylabel title legend colorbar savefig tight_layout grid set_xlim set_ylim plot scatter hist boxplot imshow cmap alpha bins tick_params annotate quiver contour barh stackplot subplots_adjust axhline axvline semilogx semilogy loglog polar streamplot hexbin pcolor tricontour errorbar clabel set_aspect violinplot set_axis_off spines text hatch plt axis plt.bar() plt.axis import figure pyplot highlight_text pypalettes plt.subplots() xlabel ylabel title legend colorbar savefig tight_layout grid set_xlim set_ylim plot scatter hist boxplot imshow cmap alpha bins tick_params annotate quiver contour barh stackplot subplots_adjust axhline axvline semilogx semilogy loglog polar streamplot hexbin pcolor tricontour errorbar clabel set_aspect violinplot set_axis_off spines text hatch plt axis plt.bar() plt.axis import figure pyplot highlight_text pypalettes plt.subplots() xlabel ylabel title legend colorbar savefig tight_layout grid set_xlim set_ylim plot scatter hist boxplot imshow cmap alpha bins tick_params annotate quiver contour barh stackplot subplots_adjust axhline axvline semilogx semilogy loglog polar streamplot hexbin pcolor tricontour errorbar clabel set_aspect violinplot set_axis_off spines text hatch plt axis plt.bar() plt.axis import figure pyplot highlight_text pypalettes plt.subplots() xlabel ylabel title legend colorbar savefig tight_layout grid set_xlim set_ylim plot scatter hist boxplot imshow cmap alpha bins tick_params annotate quiver contour barh stackplot subplots_adjust axhline axvline semilogx semilogy loglog polar streamplot hexbin pcolor tricontour errorbar clabel set_aspect violinplot set_axis_off spines text hatch plt axis plt.bar() plt.axis import figure pyplot highlight_text pypalettes plt.subplots() xlabel ylabel title legend colorbar savefig tight_layout grid set_xlim set_ylim plot scatter hist boxplot imshow cmap alpha bins tick_params annotate quiver contour barh stackplot subplots_adjust axhline axvline semilogx semilogy loglog polar streamplot hexbin pcolor tricontour errorbar clabel set_aspect violinplot set_axis_off spines text hatch plt axis plt.bar() plt.axis import figure pyplot highlight_text pypalettes plt.subplots() xlabel ylabel title legend colorbar savefig tight_layout grid set_xlim set_ylim plot scatter hist boxplot imshow cmap alpha bins tick_params annotate quiver contour barh stackplot subplots_adjust axhline axvline semilogx semilogy loglog polar streamplot hexbin pcolor tricontour errorbar clabel set_aspect violinplot set_axis_off spines text hatch plt axis plt.bar() plt.axis import figure pyplot highlight_text pypalettes plt.subplots() xlabel ylabel title legend colorbar savefig tight_layout grid set_xlim set_ylim plot scatter hist boxplot imshow cmap alpha bins tick_params annotate quiver contour barh stackplot subplots_adjust axhline axvline semilogx semilogy loglog polar streamplot hexbin pcolor tricontour errorbar clabel set_aspect violinplot set_axis_off spines text hatch plt axis plt.bar() plt.axis import figure pyplot highlight_text pypalettes plt.subplots() xlabel ylabel title legend colorbar savefig tight_layout grid set_xlim set_ylim plot scatter hist boxplot imshow cmap alpha bins tick_params annotate quiver contour barh stackplot subplots_adjust axhline axvline semilogx semilogy loglog polar streamplot hexbin pcolor tricontour errorbar clabel set_aspect violinplot set_axis_off spines text hatch plt axis plt.bar() plt.axis import figure pyplot highlight_text pypalettes plt.subplots() xlabel ylabel title legend colorbar savefig tight_layout grid set_xlim set_ylim plot scatter hist boxplot imshow cmap alpha bins tick_params annotate quiver contour barh stackplot subplots_adjust axhline axvline semilogx semilogy loglog polar streamplot hexbin pcolor tricontour errorbar clabel set_aspect violinplot set_axis_off spines text hatch plt axis plt.bar() plt.axis import figure pyplot highlight_text pypalettes plt.subplots() xlabel ylabel title legend colorbar savefig tight_layout grid set_xlim set_ylim plot scatter hist boxplot imshow cmap alpha bins tick_params annotate quiver contour barh stackplot subplots_adjust axhline axvline semilogx semilogy loglog polar streamplot hexbin pcolor tricontour errorbar clabel set_aspect violinplot set_axis_off spines text hatch plt axis plt.bar() plt.axis import figure pyplot highlight_text pypalettes plt.subplots() xlabel ylabel title legend colorbar savefig tight_layout grid set_xlim set_ylim plot scatter hist boxplot imshow cmap alpha bins tick_params annotate quiver contour barh stackplot subplots_adjust axhline axvline semilogx semilogy loglog polar streamplot hexbin pcolor tricontour errorbar clabel set_aspect violinplot set_axis_off spines text hatch plt axis plt.bar() plt.axis import figure pyplot highlight_text pypalettes plt.subplots() xlabel ylabel title legend colorbar savefig tight_layout grid set_xlim set_ylim plot scatter hist boxplot imshow cmap alpha bins tick_params annotate quiver contour barh stackplot subplots_adjust axhline axvline semilogx semilogy loglog polar streamplot hexbin pcolor tricontour errorbar clabel set_aspect violinplot set_axis_off spines text hatch plt axis plt.bar() plt.axis import figure pyplot highlight_text pypalettes plt.subplots() xlabel ylabel title legend colorbar savefig tight_layout grid set_xlim set_ylim plot scatter hist boxplot imshow cmap alpha bins tick_params annotate quiver contour barh stackplot subplots_adjust axhline axvline semilogx semilogy loglog polar streamplot hexbin pcolor tricontour errorbar clabel set_aspect violinplot set_axis_off spines text hatch plt axis plt.bar() plt.axis import figure pyplot highlight_text pypalettes plt.subplots() xlabel ylabel title legend colorbar savefig tight_layout grid set_xlim set_ylim plot scatter hist boxplot imshow cmap alpha bins tick_params annotate quiver contour barh stackplot subplots_adjust axhline axvline semilogx semilogy loglog polar streamplot hexbin pcolor tricontour errorbar clabel set_aspect violinplot set_axis_off spines text hatch plt axis plt.bar() plt.axis import figure pyplot highlight_text pypalettes plt.subplots() xlabel ylabel title legend colorbar savefig tight_layout grid set_xlim set_ylim plot scatter hist boxplot imshow cmap alpha bins tick_params annotate quiver contour barh stackplot subplots_adjust axhline axvline semilogx semilogy loglog polar streamplot hexbin pcolor tricontour errorbar clabel set_aspect violinplot set_axis_off spines text hatch plt axis plt.bar() plt.axis import figure pyplot highlight_text pypalettes plt.subplots() xlabel ylabel title legend colorbar savefig tight_layout grid set_xlim set_ylim plot scatter hist boxplot imshow cmap alpha bins tick_params annotate quiver contour barh stackplot subplots_adjust axhline axvline semilogx semilogy loglog polar streamplot hexbin pcolor tricontour errorbar clabel set_aspect violinplot set_axis_off spines text hatch plt axis plt.bar() plt.axis import figure pyplot highlight_text pypalettes plt.subplots() xlabel ylabel title legend colorbar savefig tight_layout grid set_xlim set_ylim plot scatter hist boxplot imshow cmap alpha bins tick_params annotate quiver contour barh stackplot subplots_adjust axhline axvline semilogx semilogy loglog polar streamplot hexbin pcolor tricontour errorbar clabel set_aspect violinplot set_axis_off spines text hatch plt axis plt.bar() plt.axis import figure pyplot highlight_text pypalettes plt.subplots() xlabel ylabel title legend colorbar savefig tight_layout grid set_xlim set_ylim plot scatter hist boxplot imshow cmap alpha bins tick_params annotate quiver contour barh stackplot subplots_adjust axhline axvline semilogx semilogy loglog polar streamplot hexbin pcolor tricontour errorbar clabel set_aspect violinplot set_axis_off spines text hatch plt axis plt.bar() plt.axis import figure pyplot highlight_text pypalettes plt.subplots() xlabel ylabel title legend colorbar savefig tight_layout grid set_xlim set_ylim plot scatter hist boxplot imshow cmap alpha bins tick_params annotate quiver contour barh stackplot subplots_adjust axhline axvline semilogx semilogy loglog polar streamplot hexbin pcolor tricontour errorbar clabel set_aspect violinplot set_axis_off spines text hatch plt axis plt.bar() plt.axis import figure pyplot highlight_text pypalettes plt.subplots() xlabel ylabel title legend colorbar savefig tight_layout grid set_xlim set_ylim plot scatter hist boxplot imshow cmap alpha bins tick_params annotate quiver contour barh stackplot subplots_adjust axhline axvline semilogx semilogy loglog polar streamplot hexbin pcolor tricontour errorbar clabel set_aspect violinplot set_axis_off spines text hatch plt axis plt.bar() plt.axis import figure pyplot highlight_text pypalettes plt.subplots() xlabel ylabel title legend colorbar savefig tight_layout grid set_xlim set_ylim plot scatter hist boxplot imshow cmap alpha bins tick_params annotate quiver contour barh stackplot subplots_adjust axhline axvline semilogx semilogy loglog polar streamplot hexbin pcolor tricontour errorbar clabel set_aspect violinplot set_axis_off spines text hatch plt axis plt.bar() plt.axis import figure pyplot highlight_text pypalettes plt.subplots() xlabel ylabel title legend colorbar savefig tight_layout grid set_xlim set_ylim plot scatter hist boxplot imshow cmap alpha bins tick_params annotate quiver contour barh stackplot subplots_adjust axhline axvline semilogx semilogy loglog polar streamplot hexbin pcolor tricontour errorbar clabel set_aspect violinplot set_axis_off spines text hatch plt axis plt.bar() plt.axis import figure pyplot highlight_text pypalettes plt.subplots() xlabel ylabel title legend colorbar savefig tight_layout grid set_xlim set_ylim plot scatter hist boxplot imshow cmap alpha bins tick_params annotate quiver contour barh stackplot subplots_adjust axhline axvline semilogx semilogy loglog polar streamplot hexbin pcolor tricontour errorbar clabel set_aspect violinplot set_axis_off spines text hatch plt axis plt.bar() plt.axis import figure pyplot highlight_text pypalettes plt.subplots() xlabel ylabel title legend colorbar savefig tight_layout grid set_xlim set_ylim plot scatter hist boxplot imshow cmap alpha bins tick_params annotate quiver contour barh stackplot subplots_adjust axhline axvline semilogx semilogy loglog polar streamplot hexbin pcolor tricontour errorbar clabel set_aspect violinplot set_axis_off spines text hatch plt axis plt.bar() plt.axis import figure pyplot highlight_text pypalettes plt.subplots() xlabel ylabel title legend colorbar savefig tight_layout grid set_xlim set_ylim plot scatter hist boxplot imshow cmap alpha bins tick_params annotate quiver contour barh stackplot subplots_adjust axhline axvline semilogx semilogy loglog polar streamplot hexbin pcolor tricontour errorbar clabel set_aspect violinplot set_axis_off spines text hatch plt axis plt.bar() plt.axis import figure pyplot highlight_text pypalettes plt.subplots() xlabel ylabel title legend colorbar savefig tight_layout grid set_xlim set_ylim plot scatter hist boxplot imshow cmap alpha bins tick_params annotate quiver contour barh stackplot subplots_adjust axhline axvline semilogx semilogy loglog polar streamplot hexbin pcolor tricontour errorbar clabel set_aspect violinplot set_axis_off spines text hatch plt axis plt.bar() plt.axis import figure pyplot highlight_text pypalettes plt.subplots() xlabel ylabel title legend colorbar savefig tight_layout grid set_xlim set_ylim plot scatter hist boxplot imshow cmap alpha bins tick_params annotate quiver contour barh stackplot subplots_adjust axhline axvline semilogx semilogy loglog polar streamplot hexbin pcolor tricontour errorbar clabel set_aspect violinplot set_axis_off spines text hatch plt axis plt.bar() plt.axis import figure pyplot highlight_text pypalettes plt.subplots() xlabel ylabel title legend colorbar savefig tight_layout grid set_xlim set_ylim plot scatter hist boxplot imshow cmap alpha bins tick_params annotate quiver contour barh stackplot subplots_adjust axhline axvline semilogx semilogy loglog polar streamplot hexbin pcolor tricontour errorbar clabel set_aspect violinplot set_axis_off spines text hatch plt axis plt.bar() plt.axis import figure pyplot highlight_text pypalettes plt.subplots() xlabel ylabel title legend colorbar savefig tight_layout grid set_xlim set_ylim plot scatter hist boxplot imshow cmap alpha bins tick_params annotate quiver contour barh stackplot subplots_adjust axhline axvline semilogx semilogy loglog polar streamplot hexbin pcolor tricontour errorbar clabel set_aspect violinplot set_axis_off spines text hatch plt axis plt.bar() plt.axis import figure pyplot highlight_text pypalettes plt.subplots() xlabel ylabel title legend colorbar savefig tight_layout grid set_xlim set_ylim plot scatter hist boxplot imshow cmap alpha bins tick_params annotate quiver contour barh stackplot subplots_adjust axhline axvline semilogx semilogy loglog polar streamplot hexbin pcolor tricontour errorbar clabel set_aspect violinplot set_axis_off spines text hatch plt axis plt.bar() plt.axis import figure pyplot highlight_text pypalettes plt.subplots() xlabel ylabel title legend colorbar savefig tight_layout grid set_xlim set_ylim plot scatter hist boxplot imshow cmap alpha bins tick_params annotate quiver contour barh stackplot subplots_adjust axhline axvline semilogx semilogy loglog polar streamplot hexbin pcolor tricontour errorbar clabel set_aspect violinplot set_axis_off spines text hatch plt axis plt.bar() plt.axis import figure pyplot highlight_text pypalettes plt.subplots() xlabel ylabel title legend colorbar savefig tight_layout grid set_xlim set_ylim plot scatter hist boxplot imshow cmap alpha bins tick_params annotate quiver contour barh stackplot subplots_adjust axhline axvline semilogx semilogy loglog polar streamplot hexbin pcolor tricontour errorbar clabel set_aspect violinplot set_axis_off spines text hatch plt axis plt.bar() plt.axis import figure pyplot highlight_text pypalettes plt.subplots() xlabel ylabel title legend colorbar savefig tight_layout grid set_xlim set_ylim plot scatter hist boxplot imshow cmap alpha bins tick_params annotate quiver contour barh stackplot subplots_adjust axhline axvline semilogx semilogy loglog polar streamplot hexbin pcolor tricontour errorbar clabel set_aspect violinplot set_axis_off spines text hatch plt axis plt.bar() plt.axis import figure pyplot highlight_text pypalettes plt.subplots() xlabel ylabel title legend colorbar savefig tight_layout grid set_xlim set_ylim plot scatter hist boxplot imshow cmap alpha bins tick_params annotate quiver contour barh stackplot subplots_adjust axhline axvline semilogx semilogy loglog polar streamplot hexbin pcolor tricontour errorbar clabel set_aspect violinplot set_axis_off spines text hatch plt axis plt.bar() plt.axis import figure pyplot highlight_text pypalettes plt.subplots() xlabel ylabel title legend colorbar savefig tight_layout grid set_xlim set_ylim plot scatter hist boxplot imshow cmap alpha bins tick_params annotate quiver contour barh stackplot subplots_adjust axhline axvline semilogx semilogy loglog polar streamplot hexbin pcolor tricontour errorbar clabel set_aspect violinplot set_axis_off spines text hatch plt axis plt.bar() plt.axis import figure pyplot highlight_text pypalettes plt.subplots() xlabel ylabel title legend colorbar savefig tight_layout grid set_xlim set_ylim plot scatter hist boxplot imshow cmap alpha bins tick_params annotate quiver contour barh stackplot subplots_adjust axhline axvline semilogx semilogy loglog polar streamplot hexbin pcolor tricontour errorbar clabel set_aspect violinplot set_axis_off spines text hatch plt axis plt.bar() plt.axis import figure pyplot highlight_text pypalettes plt.subplots() xlabel ylabel title legend colorbar savefig tight_layout grid set_xlim set_ylim plot scatter hist boxplot imshow cmap alpha bins tick_params annotate quiver contour barh stackplot subplots_adjust axhline axvline semilogx semilogy loglog polar streamplot hexbin pcolor tricontour errorbar clabel set_aspect violinplot set_axis_off spines text hatch plt axis plt.bar() plt.axis import figure pyplot highlight_text pypalettes plt.subplots() xlabel ylabel title legend colorbar savefig tight_layout grid set_xlim set_ylim plot scatter hist boxplot imshow cmap alpha bins tick_params annotate quiver contour barh stackplot subplots_adjust axhline axvline semilogx semilogy loglog polar streamplot hexbin pcolor tricontour errorbar clabel set_aspect violinplot set_axis_off spines text hatch plt axis plt.bar() plt.axis import figure pyplot highlight_text pypalettes plt.subplots() xlabel ylabel title legend colorbar savefig tight_layout grid set_xlim set_ylim plot scatter hist boxplot imshow cmap alpha bins tick_params annotate quiver contour barh stackplot subplots_adjust axhline axvline semilogx semilogy loglog polar streamplot hexbin pcolor tricontour errorbar clabel set_aspect violinplot set_axis_off spines text hatch plt axis plt.bar() plt.axis import figure pyplot highlight_text pypalettes plt.subplots() xlabel ylabel title legend colorbar savefig tight_layout grid set_xlim set_ylim plot scatter hist boxplot imshow cmap alpha bins tick_params annotate quiver contour barh stackplot subplots_adjust axhline axvline semilogx semilogy loglog polar streamplot hexbin pcolor tricontour errorbar clabel set_aspect violinplot set_axis_off spines text hatch plt axis plt.bar() plt.axis import figure pyplot highlight_text pypalettes plt.subplots() xlabel ylabel title legend colorbar savefig tight_layout grid set_xlim set_ylim plot scatter hist boxplot imshow cmap alpha bins tick_params annotate quiver contour barh stackplot subplots_adjust axhline axvline semilogx semilogy loglog polar streamplot hexbin pcolor tricontour errorbar clabel set_aspect violinplot set_axis_off spines text hatch plt axis plt.bar() plt.axis import figure pyplot highlight_text pypalettes plt.subplots() xlabel ylabel title legend colorbar savefig tight_layout grid set_xlim set_ylim plot scatter hist boxplot imshow cmap alpha bins tick_params annotate quiver contour barh stackplot subplots_adjust axhline axvline semilogx semilogy loglog polar streamplot hexbin pcolor tricontour errorbar clabel set_aspect violinplot set_axis_off spines text hatch plt axis plt.bar() plt.axis import figure pyplot highlight_text pypalettes plt.subplots() xlabel ylabel title legend colorbar savefig tight_layout grid set_xlim set_ylim plot scatter hist boxplot imshow cmap alpha bins tick_params annotate quiver contour barh stackplot subplots_adjust axhline axvline semilogx semilogy loglog polar streamplot hexbin pcolor tricontour errorbar clabel set_aspect violinplot set_axis_off spines text hatch plt axis plt.bar() plt.axis import figure pyplot highlight_text pypalettes plt.subplots() xlabel ylabel title legend colorbar savefig tight_layout grid set_xlim set_ylim plot scatter hist boxplot imshow cmap alpha bins tick_params annotate quiver contour barh stackplot subplots_adjust axhline axvline semilogx semilogy loglog polar streamplot hexbin pcolor tricontour errorbar clabel set_aspect violinplot set_axis_off spines text hatch plt axis plt.bar() plt.axis import figure pyplot highlight_text pypalettes plt.subplots() xlabel ylabel title legend colorbar savefig tight_layout grid set_xlim set_ylim plot scatter hist boxplot imshow cmap alpha bins tick_params annotate quiver contour barh stackplot subplots_adjust axhline axvline semilogx semilogy loglog polar streamplot hexbin pcolor tricontour errorbar clabel set_aspect violinplot set_axis_off spines text hatch plt axis plt.bar() plt.axis import figure pyplot highlight_text pypalettes plt.subplots() xlabel ylabel title legend colorbar savefig tight_layout grid set_xlim set_ylim plot scatter hist boxplot imshow cmap alpha bins tick_params annotate quiver contour barh stackplot subplots_adjust axhline axvline semilogx semilogy loglog polar streamplot hexbin pcolor tricontour errorbar clabel set_aspect violinplot set_axis_off spines text hatch plt axis plt.bar() plt.axis import figure pyplot highlight_text pypalettes plt.subplots() xlabel ylabel title legend colorbar savefig tight_layout grid set_xlim set_ylim plot scatter hist boxplot imshow cmap alpha bins tick_params annotate quiver contour barh stackplot subplots_adjust axhline axvline semilogx semilogy loglog polar streamplot hexbin pcolor tricontour errorbar clabel set_aspect violinplot set_axis_off spines text hatch plt axis plt.bar() plt.axis import figure pyplot highlight_text pypalettes plt.subplots() xlabel ylabel title legend colorbar savefig tight_layout grid set_xlim set_ylim plot scatter hist boxplot imshow cmap alpha bins tick_params annotate quiver contour barh stackplot subplots_adjust axhline axvline semilogx semilogy loglog polar streamplot hexbin pcolor tricontour errorbar clabel set_aspect violinplot set_axis_off spines text hatch plt axis plt.bar() plt.axis import figure pyplot highlight_text pypalettes plt.subplots() xlabel ylabel title legend colorbar savefig tight_layout grid set_xlim set_ylim plot scatter hist boxplot imshow cmap alpha bins tick_params annotate quiver contour barh stackplot subplots_adjust axhline axvline semilogx semilogy loglog polar streamplot hexbin pcolor tricontour errorbar clabel set_aspect violinplot set_axis_off spines text hatch plt axis plt.bar() plt.axis import figure pyplot highlight_text pypalettes plt.subplots() xlabel ylabel title legend colorbar savefig tight_layout grid set_xlim set_ylim plot scatter hist boxplot imshow cmap alpha bins tick_params annotate quiver contour barh stackplot subplots_adjust axhline axvline semilogx semilogy loglog polar streamplot hexbin pcolor tricontour errorbar clabel set_aspect violinplot set_axis_off spines text hatch plt axis plt.bar() plt.axis import figure pyplot highlight_text pypalettes plt.subplots() xlabel ylabel title legend colorbar savefig tight_layout grid set_xlim set_ylim plot scatter hist boxplot imshow cmap alpha bins tick_params annotate quiver contour barh stackplot subplots_adjust axhline axvline semilogx semilogy loglog polar streamplot hexbin pcolor tricontour errorbar clabel set_aspect violinplot set_axis_off spines text hatch plt axis plt.bar() plt.axis import figure pyplot highlight_text pypalettes plt.subplots() xlabel ylabel title legend colorbar savefig tight_layout grid set_xlim set_ylim plot scatter hist boxplot imshow cmap alpha bins tick_params annotate quiver contour barh stackplot subplots_adjust axhline axvline semilogx semilogy loglog polar streamplot hexbin pcolor tricontour errorbar clabel set_aspect violinplot set_axis_off spines text hatch plt axis plt.bar() plt.axis import figure pyplot highlight_text pypalettes plt.subplots() xlabel ylabel title legend colorbar savefig tight_layout grid set_xlim set_ylim plot scatter hist boxplot imshow cmap alpha bins tick_params annotate quiver contour barh stackplot subplots_adjust axhline axvline semilogx semilogy loglog polar streamplot hexbin pcolor tricontour errorbar clabel set_aspect violinplot set_axis_off spines text hatch plt axis plt.bar() plt.axis import figure pyplot highlight_text pypalettes plt.subplots() xlabel ylabel title legend colorbar savefig tight_layout grid set_xlim set_ylim plot scatter hist boxplot imshow cmap alpha bins tick_params annotate quiver contour barh stackplot subplots_adjust axhline axvline semilogx semilogy loglog polar streamplot hexbin pcolor tricontour errorbar clabel set_aspect violinplot set_axis_off spines text hatch plt axis plt.bar() plt.axis import figure pyplot highlight_text pypalettes plt.subplots() xlabel ylabel title legend colorbar savefig tight_layout grid set_xlim set_ylim plot scatter hist boxplot imshow cmap alpha bins tick_params annotate quiver contour barh stackplot subplots_adjust axhline axvline semilogx semilogy loglog polar streamplot hexbin pcolor tricontour errorbar clabel set_aspect violinplot set_axis_off spines text hatch plt axis plt.bar() plt.axis import figure pyplot highlight_text pypalettes plt.subplots() xlabel ylabel title legend colorbar savefig tight_layout grid set_xlim set_ylim plot scatter hist boxplot imshow cmap alpha bins tick_params annotate quiver contour barh stackplot subplots_adjust axhline axvline semilogx semilogy loglog polar streamplot hexbin pcolor tricontour errorbar clabel set_aspect violinplot set_axis_off spines text hatch plt axis plt.bar() plt.axis import figure pyplot highlight_text pypalettes plt.subplots() xlabel ylabel title legend colorbar savefig tight_layout grid set_xlim set_ylim plot scatter hist boxplot imshow cmap alpha bins tick_params annotate quiver contour barh stackplot subplots_adjust axhline axvline semilogx semilogy loglog polar streamplot hexbin pcolor tricontour errorbar clabel set_aspect violinplot set_axis_off spines text hatch plt axis plt.bar() plt.axis import figure pyplot highlight_text pypalettes plt.subplots() xlabel ylabel title legend colorbar savefig tight_layout grid set_xlim set_ylim plot scatter hist boxplot imshow cmap alpha bins tick_params annotate quiver contour barh stackplot subplots_adjust axhline axvline semilogx semilogy loglog polar streamplot hexbin pcolor tricontour errorbar clabel set_aspect violinplot set_axis_off spines text hatch plt axis plt.bar() plt.axis import figure pyplot highlight_text pypalettes plt.subplots() xlabel ylabel title legend colorbar savefig tight_layout grid set_xlim set_ylim plot scatter hist boxplot imshow cmap alpha bins tick_params annotate quiver contour barh stackplot subplots_adjust axhline axvline semilogx semilogy loglog polar streamplot hexbin pcolor tricontour errorbar clabel set_aspect violinplot set_axis_off spines text hatch plt axis plt.bar() plt.axis import figure pyplot highlight_text pypalettes plt.subplots() xlabel ylabel title legend colorbar savefig tight_layout grid set_xlim set_ylim plot scatter hist boxplot imshow cmap alpha bins tick_params annotate quiver contour barh stackplot subplots_adjust axhline axvline semilogx semilogy loglog polar streamplot hexbin pcolor tricontour errorbar clabel set_aspect violinplot set_axis_off spines text hatch plt axis plt.bar() plt.axis import figure pyplot highlight_text pypalettes plt.subplots() xlabel ylabel title legend colorbar savefig tight_layout grid set_xlim set_ylim plot scatter hist boxplot imshow cmap alpha bins tick_params annotate quiver contour barh stackplot subplots_adjust axhline axvline semilogx semilogy loglog polar streamplot hexbin pcolor tricontour errorbar clabel set_aspect violinplot set_axis_off spines text hatch plt axis plt.bar() plt.axis import figure pyplot highlight_text pypalettes plt.subplots() xlabel ylabel title legend colorbar savefig tight_layout grid set_xlim set_ylim plot scatter hist boxplot imshow cmap alpha bins tick_params annotate quiver contour barh stackplot subplots_adjust axhline axvline semilogx semilogy loglog polar streamplot hexbin pcolor tricontour errorbar clabel set_aspect violinplot set_axis_off spines text hatch plt axis plt.bar() plt.axis import figure pyplot highlight_text pypalettes plt.subplots() xlabel ylabel title legend colorbar savefig tight_layout grid set_xlim set_ylim plot scatter hist boxplot imshow cmap alpha bins tick_params annotate quiver contour barh stackplot subplots_adjust axhline axvline semilogx semilogy loglog polar streamplot hexbin pcolor tricontour errorbar clabel set_aspect violinplot set_axis_off spines text hatch plt axis plt.bar() plt.axis import figure pyplot highlight_text pypalettes plt.subplots() xlabel ylabel title legend colorbar savefig tight_layout grid set_xlim set_ylim plot scatter hist boxplot imshow cmap alpha bins tick_params annotate quiver contour barh stackplot subplots_adjust axhline axvline semilogx semilogy loglog polar streamplot hexbin pcolor tricontour errorbar clabel set_aspect violinplot set_axis_off spines text hatch plt axis plt.bar() plt.axis import figure pyplot highlight_text pypalettes plt.subplots() xlabel ylabel title legend colorbar savefig tight_layout grid set_xlim set_ylim plot scatter hist boxplot imshow cmap alpha bins tick_params annotate quiver contour barh stackplot subplots_adjust axhline axvline semilogx semilogy loglog polar streamplot hexbin pcolor tricontour errorbar clabel set_aspect violinplot set_axis_off spines text hatch plt axis plt.bar() plt.axis import figure pyplot highlight_text pypalettes plt.subplots() xlabel ylabel title legend colorbar savefig tight_layout grid set_xlim set_ylim plot scatter hist boxplot imshow cmap alpha bins tick_params annotate quiver contour barh stackplot subplots_adjust axhline axvline semilogx semilogy loglog polar streamplot hexbin pcolor tricontour errorbar clabel set_aspect violinplot set_axis_off spines text hatch plt axis plt.bar() plt.axis import figure pyplot highlight_text pypalettes plt.subplots() xlabel ylabel title legend colorbar savefig tight_layout grid set_xlim set_ylim plot scatter hist boxplot imshow cmap alpha bins tick_params annotate quiver contour barh stackplot subplots_adjust axhline axvline semilogx semilogy loglog polar streamplot hexbin pcolor tricontour errorbar clabel set_aspect violinplot set_axis_off spines text hatch plt axis plt.bar() plt.axis import figure pyplot highlight_text pypalettes plt.subplots() xlabel ylabel title legend colorbar savefig tight_layout grid set_xlim set_ylim plot scatter hist boxplot imshow cmap alpha bins tick_params annotate quiver contour barh stackplot subplots_adjust axhline axvline semilogx semilogy loglog polar streamplot hexbin pcolor tricontour errorbar clabel set_aspect violinplot set_axis_off spines text hatch plt axis plt.bar() plt.axis import figure pyplot highlight_text pypalettes plt.subplots() xlabel ylabel title legend colorbar savefig tight_layout grid set_xlim set_ylim plot scatter hist boxplot imshow cmap alpha bins tick_params annotate quiver contour barh stackplot subplots_adjust axhline axvline semilogx semilogy loglog polar streamplot hexbin pcolor tricontour errorbar clabel set_aspect violinplot set_axis_off spines text hatch plt axis plt.bar() plt.axis import figure pyplot highlight_text pypalettes plt.subplots() xlabel ylabel title legend colorbar savefig tight_layout grid set_xlim set_ylim plot scatter hist boxplot imshow cmap alpha bins tick_params annotate quiver contour barh stackplot subplots_adjust axhline axvline semilogx semilogy loglog polar streamplot hexbin pcolor tricontour errorbar clabel set_aspect violinplot set_axis_off spines text hatch plt axis plt.bar() plt.axis import figure pyplot highlight_text pypalettes plt.subplots() xlabel ylabel title legend colorbar savefig tight_layout grid set_xlim set_ylim plot scatter hist boxplot imshow cmap alpha bins tick_params annotate quiver contour barh stackplot subplots_adjust axhline axvline semilogx semilogy loglog polar streamplot hexbin pcolor tricontour errorbar clabel set_aspect violinplot set_axis_off spines text hatch plt axis plt.bar() plt.axis import figure pyplot highlight_text pypalettes plt.subplots() xlabel ylabel title legend colorbar savefig tight_layout grid set_xlim set_ylim plot scatter hist boxplot imshow cmap alpha bins tick_params annotate quiver contour barh stackplot subplots_adjust axhline axvline semilogx semilogy loglog polar streamplot hexbin pcolor tricontour errorbar clabel set_aspect violinplot set_axis_off spines text hatch plt axis plt.bar() plt.axis import figure pyplot highlight_text pypalettes plt.subplots() xlabel ylabel title legend colorbar savefig tight_layout grid set_xlim set_ylim plot scatter hist boxplot imshow cmap alpha bins tick_params annotate quiver contour barh stackplot subplots_adjust axhline axvline semilogx semilogy loglog polar streamplot hexbin pcolor tricontour errorbar clabel set_aspect violinplot set_axis_off spines text hatch plt axis plt.bar() plt.axis import figure pyplot highlight_text pypalettes plt.subplots() xlabel ylabel title legend colorbar savefig tight_layout grid set_xlim set_ylim plot scatter hist boxplot imshow cmap alpha bins tick_params annotate quiver contour barh stackplot subplots_adjust axhline axvline semilogx semilogy loglog polar streamplot hexbin pcolor tricontour errorbar clabel set_aspect violinplot set_axis_off spines text hatch plt axis plt.bar() plt.axis import figure pyplot highlight_text pypalettes plt.subplots() xlabel ylabel title legend colorbar savefig tight_layout grid set_xlim set_ylim plot scatter hist boxplot imshow cmap alpha bins tick_params annotate quiver contour barh stackplot subplots_adjust axhline axvline semilogx semilogy loglog polar streamplot hexbin pcolor tricontour errorbar clabel set_aspect violinplot set_axis_off spines text hatch plt axis plt.bar() plt.axis import figure pyplot highlight_text pypalettes plt.subplots() xlabel ylabel title legend colorbar savefig tight_layout grid set_xlim set_ylim plot scatter hist boxplot imshow cmap alpha bins tick_params annotate quiver contour barh stackplot subplots_adjust axhline axvline semilogx semilogy loglog polar streamplot hexbin pcolor tricontour errorbar clabel set_aspect violinplot set_axis_off spines text hatch plt axis plt.bar() plt.axis import figure pyplot highlight_text pypalettes plt.subplots() xlabel ylabel title legend colorbar savefig tight_layout grid set_xlim set_ylim plot scatter hist boxplot imshow cmap alpha bins tick_params annotate quiver contour barh stackplot subplots_adjust axhline axvline semilogx semilogy loglog polar streamplot hexbin pcolor tricontour errorbar clabel set_aspect violinplot set_axis_off spines text hatch plt axis plt.bar() plt.axis import figure pyplot highlight_text pypalettes plt.subplots() xlabel ylabel title legend colorbar savefig tight_layout grid set_xlim set_ylim plot scatter hist boxplot imshow cmap alpha bins tick_params annotate quiver contour barh stackplot subplots_adjust axhline axvline semilogx semilogy loglog polar streamplot hexbin pcolor tricontour errorbar clabel set_aspect violinplot set_axis_off spines text hatch plt axis plt.bar() plt.axis import figure pyplot highlight_text pypalettes plt.subplots() xlabel ylabel title legend colorbar savefig tight_layout grid set_xlim set_ylim plot scatter hist boxplot imshow cmap alpha bins tick_params annotate quiver contour barh stackplot subplots_adjust axhline axvline semilogx semilogy loglog polar streamplot hexbin pcolor tricontour errorbar clabel set_aspect violinplot set_axis_off spines text hatch plt axis plt.bar() plt.axis import figure pyplot highlight_text pypalettes plt.subplots() xlabel ylabel title legend colorbar savefig tight_layout grid set_xlim set_ylim plot scatter hist boxplot imshow cmap alpha bins tick_params annotate quiver contour barh stackplot subplots_adjust axhline axvline semilogx semilogy loglog polar streamplot hexbin pcolor tricontour errorbar clabel set_aspect violinplot set_axis_off spines text hatch plt axis plt.bar() plt.axis import figure pyplot highlight_text pypalettes plt.subplots() xlabel ylabel title legend colorbar savefig tight_layout grid set_xlim set_ylim plot scatter hist boxplot imshow cmap alpha bins tick_params annotate quiver contour barh stackplot subplots_adjust axhline axvline semilogx semilogy loglog polar streamplot hexbin pcolor tricontour errorbar clabel set_aspect violinplot set_axis_off spines text hatch plt axis plt.bar() plt.axis import figure pyplot highlight_text pypalettes plt.subplots() xlabel ylabel title legend colorbar savefig tight_layout grid set_xlim set_ylim plot scatter hist boxplot imshow cmap alpha bins tick_params annotate quiver contour barh stackplot subplots_adjust axhline axvline semilogx semilogy loglog polar streamplot hexbin pcolor tricontour errorbar clabel set_aspect violinplot set_axis_off spines text hatch plt axis plt.bar() plt.axis import figure pyplot highlight_text pypalettes plt.subplots() xlabel ylabel title legend colorbar savefig tight_layout grid set_xlim set_ylim plot scatter hist boxplot imshow cmap alpha bins tick_params annotate quiver contour barh stackplot subplots_adjust axhline axvline semilogx semilogy loglog polar streamplot hexbin pcolor tricontour errorbar clabel set_aspect violinplot set_axis_off spines text hatch plt axis plt.bar() plt.axis import figure pyplot highlight_text pypalettes plt.subplots() xlabel ylabel title legend colorbar savefig tight_layout grid set_xlim set_ylim plot scatter hist boxplot imshow cmap alpha bins tick_params annotate quiver contour barh stackplot subplots_adjust axhline axvline semilogx semilogy loglog polar streamplot hexbin pcolor tricontour errorbar clabel set_aspect violinplot set_axis_off spines text hatch plt axis plt.bar() plt.axis import figure pyplot highlight_text pypalettes plt.subplots() xlabel ylabel title legend colorbar savefig tight_layout grid set_xlim set_ylim plot scatter hist boxplot imshow cmap alpha bins tick_params annotate quiver contour barh stackplot subplots_adjust axhline axvline semilogx semilogy loglog polar streamplot hexbin pcolor tricontour errorbar clabel set_aspect violinplot set_axis_off spines text hatch plt axis plt.bar() plt.axis import figure pyplot highlight_text pypalettes plt.subplots() xlabel ylabel title legend colorbar savefig tight_layout grid set_xlim set_ylim plot scatter hist boxplot imshow cmap alpha bins tick_params annotate quiver contour barh stackplot subplots_adjust axhline axvline semilogx semilogy loglog polar streamplot hexbin pcolor tricontour errorbar clabel set_aspect violinplot set_axis_off spines text hatch plt axis plt.bar() plt.axis import figure pyplot highlight_text pypalettes plt.subplots() xlabel ylabel title legend colorbar savefig tight_layout grid set_xlim set_ylim plot scatter hist boxplot imshow cmap alpha bins tick_params annotate quiver contour barh stackplot subplots_adjust axhline axvline semilogx semilogy loglog polar streamplot hexbin pcolor tricontour errorbar clabel set_aspect violinplot set_axis_off spines text hatch plt axis plt.bar() plt.axis import figure pyplot highlight_text pypalettes plt.subplots() xlabel ylabel title legend colorbar savefig tight_layout grid set_xlim set_ylim plot scatter hist boxplot imshow cmap alpha bins tick_params annotate quiver contour barh stackplot subplots_adjust axhline axvline semilogx semilogy loglog polar streamplot hexbin pcolor tricontour errorbar clabel set_aspect violinplot set_axis_off spines text hatch plt axis plt.bar() plt.axis import figure pyplot highlight_text pypalettes plt.subplots() xlabel ylabel title legend colorbar savefig tight_layout grid set_xlim set_ylim plot scatter hist boxplot imshow cmap alpha bins tick_params annotate quiver contour barh stackplot subplots_adjust axhline axvline semilogx semilogy loglog polar streamplot hexbin pcolor tricontour errorbar clabel set_aspect violinplot set_axis_off spines text hatch plt axis plt.bar() plt.axis import figure pyplot highlight_text pypalettes plt.subplots() xlabel ylabel title legend colorbar savefig tight_layout grid set_xlim set_ylim plot scatter hist boxplot imshow cmap alpha bins tick_params annotate quiver contour barh stackplot subplots_adjust axhline axvline semilogx semilogy loglog polar streamplot hexbin pcolor tricontour errorbar clabel set_aspect violinplot set_axis_off spines text hatch plt axis plt.bar() plt.axis import figure pyplot highlight_text pypalettes plt.subplots() xlabel ylabel title legend colorbar savefig tight_layout grid set_xlim set_ylim plot scatter hist boxplot imshow cmap alpha bins tick_params annotate quiver contour barh stackplot subplots_adjust axhline axvline semilogx semilogy loglog polar streamplot hexbin pcolor tricontour errorbar clabel set_aspect violinplot set_axis_off spines text hatch plt axis plt.bar() plt.axis import figure pyplot highlight_text pypalettes plt.subplots() xlabel ylabel title legend colorbar savefig tight_layout grid set_xlim set_ylim plot scatter hist boxplot imshow cmap alpha bins tick_params annotate quiver contour barh stackplot subplots_adjust axhline axvline semilogx semilogy loglog polar streamplot hexbin pcolor tricontour errorbar clabel set_aspect violinplot set_axis_off spines text hatch plt axis plt.bar() plt.axis import figure pyplot highlight_text pypalettes plt.subplots() xlabel ylabel title legend colorbar savefig tight_layout grid set_xlim set_ylim plot scatter hist boxplot imshow cmap alpha bins tick_params annotate quiver contour barh stackplot subplots_adjust axhline axvline semilogx semilogy loglog polar streamplot hexbin pcolor tricontour errorbar clabel set_aspect violinplot set_axis_off spines text hatch plt axis plt.bar() plt.axis import figure pyplot highlight_text pypalettes plt.subplots() xlabel ylabel title legend colorbar savefig tight_layout grid set_xlim set_ylim plot scatter hist boxplot imshow cmap alpha bins tick_params annotate quiver contour barh stackplot subplots_adjust axhline axvline semilogx semilogy loglog polar streamplot hexbin pcolor tricontour errorbar clabel set_aspect violinplot set_axis_off spines text hatch plt axis plt.bar() plt.axis import figure pyplot highlight_text pypalettes plt.subplots() xlabel ylabel title legend colorbar savefig tight_layout grid set_xlim set_ylim plot scatter hist boxplot imshow cmap alpha bins tick_params annotate quiver contour barh stackplot subplots_adjust axhline axvline semilogx semilogy loglog polar streamplot hexbin pcolor tricontour errorbar clabel set_aspect violinplot set_axis_off spines text hatch plt axis plt.bar() plt.axis import figure pyplot highlight_text pypalettes plt.subplots() xlabel ylabel title legend colorbar savefig tight_layout grid set_xlim set_ylim plot scatter hist boxplot imshow cmap alpha bins tick_params annotate quiver contour barh stackplot subplots_adjust axhline axvline semilogx semilogy loglog polar streamplot hexbin pcolor tricontour errorbar clabel set_aspect violinplot set_axis_off spines text hatch plt axis plt.bar() plt.axis import figure pyplot highlight_text pypalettes plt.subplots() xlabel ylabel title legend colorbar savefig tight_layout grid set_xlim set_ylim plot scatter hist boxplot imshow cmap alpha bins tick_params annotate quiver contour barh stackplot subplots_adjust axhline axvline semilogx semilogy loglog polar streamplot hexbin pcolor tricontour errorbar clabel set_aspect violinplot set_axis_off spines text hatch plt axis plt.bar() plt.axis import figure pyplot highlight_text pypalettes plt.subplots() xlabel ylabel title legend colorbar savefig tight_layout grid set_xlim set_ylim plot scatter hist boxplot imshow cmap alpha bins tick_params annotate quiver contour barh stackplot subplots_adjust axhline axvline semilogx semilogy loglog polar streamplot hexbin pcolor tricontour errorbar clabel set_aspect violinplot set_axis_off spines text hatch plt axis plt.bar() plt.axis import figure pyplot highlight_text pypalettes plt.subplots() xlabel ylabel title legend colorbar savefig tight_layout grid set_xlim set_ylim plot scatter hist boxplot imshow cmap alpha bins tick_params annotate quiver contour barh stackplot subplots_adjust axhline axvline semilogx semilogy loglog polar streamplot hexbin pcolor tricontour errorbar clabel set_aspect violinplot set_axis_off spines text hatch plt axis plt.bar() plt.axis import figure pyplot highlight_text pypalettes plt.subplots() xlabel ylabel title legend colorbar savefig tight_layout grid set_xlim set_ylim plot scatter hist boxplot imshow cmap alpha bins tick_params annotate quiver contour barh stackplot subplots_adjust axhline axvline semilogx semilogy loglog polar streamplot hexbin pcolor tricontour errorbar clabel set_aspect violinplot set_axis_off spines text hatch plt axis plt.bar() plt.axis import figure pyplot highlight_text pypalettes plt.subplots() xlabel ylabel title legend colorbar savefig tight_layout grid set_xlim set_ylim plot scatter hist boxplot imshow cmap alpha bins tick_params annotate quiver contour barh stackplot subplots_adjust axhline axvline semilogx semilogy loglog polar streamplot hexbin pcolor tricontour errorbar clabel set_aspect violinplot set_axis_off spines text hatch plt axis plt.bar() plt.axis import figure pyplot highlight_text pypalettes plt.subplots() xlabel ylabel title legend colorbar savefig tight_layout grid set_xlim set_ylim plot scatter hist boxplot imshow cmap alpha bins tick_params annotate quiver contour barh stackplot subplots_adjust axhline axvline semilogx semilogy loglog polar streamplot hexbin pcolor tricontour errorbar clabel set_aspect violinplot set_axis_off spines text hatch plt axis plt.bar() plt.axis import figure pyplot highlight_text pypalettes plt.subplots() xlabel ylabel title legend colorbar savefig tight_layout grid set_xlim set_ylim plot scatter hist boxplot imshow cmap alpha bins tick_params annotate quiver contour barh stackplot subplots_adjust axhline axvline semilogx semilogy loglog polar streamplot hexbin pcolor tricontour errorbar clabel set_aspect violinplot set_axis_off spines text hatch plt axis plt.bar() plt.axis import figure pyplot highlight_text pypalettes plt.subplots() xlabel ylabel title legend colorbar savefig tight_layout grid set_xlim set_ylim plot scatter hist boxplot imshow cmap alpha bins tick_params annotate quiver contour barh stackplot subplots_adjust axhline axvline semilogx semilogy loglog polar streamplot hexbin pcolor tricontour errorbar clabel set_aspect violinplot set_axis_off spines text hatch plt axis plt.bar() plt.axis import figure pyplot highlight_text pypalettes plt.subplots() xlabel ylabel title legend colorbar savefig tight_layout grid set_xlim set_ylim plot scatter hist boxplot imshow cmap alpha bins tick_params annotate quiver contour barh stackplot subplots_adjust axhline axvline semilogx semilogy loglog polar streamplot hexbin pcolor tricontour errorbar clabel set_aspect violinplot set_axis_off spines text hatch plt axis plt.bar() plt.axis import figure pyplot highlight_text pypalettes plt.subplots() xlabel ylabel title legend colorbar savefig tight_layout grid set_xlim set_ylim plot scatter hist boxplot imshow cmap alpha bins tick_params annotate quiver contour barh stackplot subplots_adjust axhline axvline semilogx semilogy loglog polar streamplot hexbin pcolor tricontour errorbar clabel set_aspect violinplot set_axis_off spines text hatch plt axis plt.bar() plt.axis import figure pyplot highlight_text pypalettes plt.subplots() xlabel ylabel title legend colorbar savefig tight_layout grid set_xlim set_ylim plot scatter hist boxplot imshow cmap alpha bins tick_params annotate quiver contour barh stackplot subplots_adjust axhline axvline semilogx semilogy loglog polar streamplot hexbin pcolor tricontour errorbar clabel set_aspect violinplot set_axis_off spines text hatch plt axis plt.bar() plt.axis import figure pyplot highlight_text pypalettes plt.subplots() xlabel ylabel title legend colorbar savefig tight_layout grid set_xlim set_ylim plot scatter hist boxplot imshow cmap alpha bins tick_params annotate quiver contour barh stackplot subplots_adjust axhline axvline semilogx semilogy loglog polar streamplot hexbin pcolor tricontour errorbar clabel set_aspect violinplot set_axis_off spines text hatch plt axis plt.bar() plt.axis import figure pyplot highlight_text pypalettes plt.subplots() xlabel ylabel title legend colorbar savefig tight_layout grid set_xlim set_ylim plot scatter hist boxplot imshow cmap alpha bins tick_params annotate quiver contour barh stackplot subplots_adjust axhline axvline semilogx semilogy loglog polar streamplot hexbin pcolor tricontour errorbar clabel set_aspect violinplot set_axis_off spines text hatch plt axis plt.bar() plt.axis import figure pyplot highlight_text pypalettes plt.subplots() xlabel ylabel title legend colorbar savefig tight_layout grid set_xlim set_ylim plot scatter hist boxplot imshow cmap alpha bins tick_params annotate quiver contour barh stackplot subplots_adjust axhline axvline semilogx semilogy loglog polar streamplot hexbin pcolor tricontour errorbar clabel set_aspect violinplot set_axis_off spines text hatch plt axis plt.bar() plt.axis import figure pyplot highlight_text pypalettes plt.subplots() xlabel ylabel title legend colorbar savefig tight_layout grid set_xlim set_ylim plot scatter hist boxplot imshow cmap alpha bins tick_params annotate quiver contour barh stackplot subplots_adjust axhline axvline semilogx semilogy loglog polar streamplot hexbin pcolor tricontour errorbar clabel set_aspect violinplot set_axis_off spines text hatch plt axis plt.bar() plt.axis import figure pyplot highlight_text pypalettes plt.subplots() xlabel ylabel title legend colorbar savefig tight_layout grid set_xlim set_ylim plot scatter hist boxplot imshow cmap alpha bins tick_params annotate quiver contour barh stackplot subplots_adjust axhline axvline semilogx semilogy loglog polar streamplot hexbin pcolor tricontour errorbar clabel set_aspect violinplot set_axis_off spines text hatch plt axis plt.bar() plt.axis import figure pyplot highlight_text pypalettes plt.subplots() xlabel ylabel title legend colorbar savefig tight_layout grid set_xlim set_ylim plot scatter hist boxplot imshow cmap alpha bins tick_params annotate quiver contour barh stackplot subplots_adjust axhline axvline semilogx semilogy loglog polar streamplot hexbin pcolor tricontour errorbar clabel set_aspect violinplot set_axis_off spines text hatch plt axis plt.bar() plt.axis import figure pyplot highlight_text pypalettes plt.subplots() xlabel ylabel title legend colorbar savefig tight_layout grid set_xlim set_ylim plot scatter hist boxplot imshow cmap alpha bins tick_params annotate quiver contour barh stackplot subplots_adjust axhline axvline semilogx semilogy loglog polar streamplot hexbin pcolor tricontour errorbar clabel set_aspect violinplot set_axis_off spines text hatch plt axis plt.bar() plt.axis import figure pyplot highlight_text pypalettes plt.subplots() xlabel ylabel title legend colorbar savefig tight_layout grid set_xlim set_ylim plot scatter hist boxplot imshow cmap alpha bins tick_params annotate quiver contour barh stackplot subplots_adjust axhline axvline semilogx semilogy loglog polar streamplot hexbin pcolor tricontour errorbar clabel set_aspect violinplot set_axis_off spines text hatch plt axis plt.bar() plt.axis import figure pyplot highlight_text pypalettes plt.subplots() xlabel ylabel title legend colorbar savefig tight_layout grid set_xlim set_ylim plot scatter hist boxplot imshow cmap alpha bins tick_params annotate quiver contour barh stackplot subplots_adjust axhline axvline semilogx semilogy loglog polar streamplot hexbin pcolor tricontour errorbar clabel set_aspect violinplot set_axis_off spines text hatch plt axis plt.bar() plt.axis import figure pyplot highlight_text pypalettes plt.subplots() xlabel ylabel title legend colorbar savefig tight_layout grid set_xlim set_ylim plot scatter hist boxplot imshow cmap alpha bins tick_params annotate quiver contour barh stackplot subplots_adjust axhline axvline semilogx semilogy loglog polar streamplot hexbin pcolor tricontour errorbar clabel set_aspect violinplot set_axis_off spines text hatch plt axis plt.bar() plt.axis import figure pyplot highlight_text pypalettes plt.subplots() xlabel ylabel title legend colorbar savefig tight_layout grid set_xlim set_ylim plot scatter hist boxplot imshow cmap alpha bins tick_params annotate quiver contour barh stackplot subplots_adjust axhline axvline semilogx semilogy loglog polar streamplot hexbin pcolor tricontour errorbar clabel set_aspect violinplot set_axis_off spines text hatch plt axis plt.bar() plt.axis import figure pyplot highlight_text pypalettes plt.subplots() xlabel ylabel title legend colorbar savefig tight_layout grid set_xlim set_ylim plot scatter hist boxplot imshow cmap alpha bins tick_params annotate quiver contour barh stackplot subplots_adjust axhline axvline semilogx semilogy loglog polar streamplot hexbin pcolor tricontour errorbar clabel set_aspect violinplot set_axis_off spines text hatch plt axis plt.bar() plt.axis import figure pyplot highlight_text pypalettes plt.subplots() xlabel ylabel title legend colorbar savefig tight_layout grid set_xlim set_ylim plot scatter hist boxplot imshow cmap alpha bins tick_params annotate quiver contour barh stackplot subplots_adjust axhline axvline semilogx semilogy loglog polar streamplot hexbin pcolor tricontour errorbar clabel set_aspect violinplot set_axis_off spines text hatch plt axis plt.bar() plt.axis import figure pyplot highlight_text pypalettes plt.subplots() xlabel ylabel title legend colorbar savefig tight_layout grid set_xlim set_ylim plot scatter hist boxplot imshow cmap alpha bins tick_params annotate quiver contour barh stackplot subplots_adjust axhline axvline semilogx semilogy loglog polar streamplot hexbin pcolor tricontour errorbar clabel set_aspect violinplot set_axis_off spines text hatch plt axis plt.bar() plt.axis import figure pyplot highlight_text pypalettes plt.subplots() xlabel ylabel title legend colorbar savefig tight_layout grid set_xlim set_ylim plot scatter hist boxplot imshow cmap alpha bins tick_params annotate quiver contour barh stackplot subplots_adjust axhline axvline semilogx semilogy loglog polar streamplot hexbin pcolor tricontour errorbar clabel set_aspect violinplot set_axis_off spines text hatch plt axis plt.bar() plt.axis import figure pyplot highlight_text pypalettes plt.subplots() xlabel ylabel title legend colorbar savefig tight_layout grid set_xlim set_ylim plot scatter hist boxplot imshow cmap alpha bins tick_params annotate quiver contour barh stackplot subplots_adjust axhline axvline semilogx semilogy loglog polar streamplot hexbin pcolor tricontour errorbar clabel set_aspect violinplot set_axis_off spines text hatch plt axis plt.bar() plt.axis import figure pyplot highlight_text pypalettes plt.subplots() xlabel ylabel title legend colorbar savefig tight_layout grid set_xlim set_ylim plot scatter hist boxplot imshow cmap alpha bins tick_params annotate quiver contour barh stackplot subplots_adjust axhline axvline semilogx semilogy loglog polar streamplot hexbin pcolor tricontour errorbar clabel set_aspect violinplot set_axis_off spines text hatch plt axis plt.bar() plt.axis import figure pyplot highlight_text pypalettes plt.subplots() xlabel ylabel title legend colorbar savefig tight_layout grid set_xlim set_ylim plot scatter hist boxplot imshow cmap alpha bins tick_params annotate quiver contour barh stackplot subplots_adjust axhline axvline semilogx semilogy loglog polar streamplot hexbin pcolor tricontour errorbar clabel set_aspect violinplot set_axis_off spines text hatch plt axis plt.bar() plt.axis import figure pyplot highlight_text pypalettes plt.subplots() xlabel ylabel title legend colorbar savefig tight_layout grid set_xlim set_ylim plot scatter hist boxplot imshow cmap alpha bins tick_params annotate quiver contour barh stackplot subplots_adjust axhline axvline semilogx semilogy loglog polar streamplot hexbin pcolor tricontour errorbar clabel set_aspect violinplot set_axis_off spines text hatch plt axis plt.bar() plt.axis import figure pyplot highlight_text pypalettes plt.subplots() xlabel ylabel title legend colorbar savefig tight_layout grid set_xlim set_ylim plot scatter hist boxplot imshow cmap alpha bins tick_params annotate quiver contour barh stackplot subplots_adjust axhline axvline semilogx semilogy loglog polar streamplot hexbin pcolor tricontour errorbar clabel set_aspect violinplot set_axis_off spines text hatch plt axis plt.bar() plt.axis import figure pyplot highlight_text pypalettes plt.subplots() xlabel ylabel title legend colorbar savefig tight_layout grid set_xlim set_ylim plot scatter hist boxplot imshow cmap alpha bins tick_params annotate quiver contour barh stackplot subplots_adjust axhline axvline semilogx semilogy loglog polar streamplot hexbin pcolor tricontour errorbar clabel set_aspect violinplot set_axis_off spines text hatch plt axis plt.bar() plt.axis import figure pyplot highlight_text pypalettes plt.subplots() xlabel ylabel title legend colorbar savefig tight_layout grid set_xlim set_ylim plot scatter hist boxplot imshow cmap alpha bins tick_params annotate quiver contour barh stackplot subplots_adjust axhline axvline semilogx semilogy loglog polar streamplot hexbin pcolor tricontour errorbar clabel set_aspect violinplot set_axis_off spines text hatch plt axis plt.bar() plt.axis import figure pyplot highlight_text pypalettes plt.subplots() xlabel ylabel title legend colorbar savefig tight_layout grid set_xlim set_ylim plot scatter hist boxplot imshow cmap alpha bins tick_params annotate quiver contour barh stackplot subplots_adjust axhline axvline semilogx semilogy loglog polar streamplot hexbin pcolor tricontour errorbar clabel set_aspect violinplot set_axis_off spines text hatch plt axis plt.bar() plt.axis import figure pyplot highlight_text pypalettes plt.subplots() xlabel ylabel title legend colorbar savefig tight_layout grid set_xlim set_ylim plot scatter hist boxplot imshow cmap alpha bins tick_params annotate quiver contour barh stackplot subplots_adjust axhline axvline semilogx semilogy loglog polar streamplot hexbin pcolor tricontour errorbar clabel set_aspect violinplot set_axis_off spines text hatch plt axis plt.bar() plt.axis import figure pyplot highlight_text pypalettes plt.subplots() xlabel ylabel title legend colorbar savefig tight_layout grid set_xlim set_ylim plot scatter hist boxplot imshow cmap alpha bins tick_params annotate quiver contour barh stackplot subplots_adjust axhline axvline semilogx semilogy loglog polar streamplot hexbin pcolor tricontour errorbar clabel set_aspect violinplot set_axis_off spines text hatch plt axis plt.bar() plt.axis import figure pyplot highlight_text pypalettes plt.subplots() xlabel ylabel title legend colorbar savefig tight_layout grid set_xlim set_ylim plot scatter hist boxplot imshow cmap alpha bins tick_params annotate quiver contour barh stackplot subplots_adjust axhline axvline semilogx semilogy loglog polar streamplot hexbin pcolor tricontour errorbar clabel set_aspect violinplot set_axis_off spines text hatch plt axis plt.bar() plt.axis import figure pyplot highlight_text pypalettes plt.subplots() xlabel ylabel title legend colorbar savefig tight_layout grid set_xlim set_ylim plot scatter hist boxplot imshow cmap alpha bins tick_params annotate quiver contour barh stackplot subplots_adjust axhline axvline semilogx semilogy loglog polar streamplot hexbin pcolor tricontour errorbar clabel set_aspect violinplot set_axis_off spines text hatch plt axis plt.bar() plt.axis import figure pyplot highlight_text pypalettes plt.subplots() xlabel ylabel title legend colorbar savefig tight_layout grid set_xlim set_ylim plot scatter hist boxplot imshow cmap alpha bins tick_params annotate quiver contour barh stackplot subplots_adjust axhline axvline semilogx semilogy loglog polar streamplot hexbin pcolor tricontour errorbar clabel set_aspect violinplot set_axis_off spines text hatch plt axis plt.bar() plt.axis import figure pyplot highlight_text pypalettes plt.subplots() xlabel ylabel title legend colorbar savefig tight_layout grid set_xlim set_ylim plot scatter hist boxplot imshow cmap alpha bins tick_params annotate quiver contour barh stackplot subplots_adjust axhline axvline semilogx semilogy loglog polar streamplot hexbin pcolor tricontour errorbar clabel set_aspect violinplot set_axis_off spines text hatch plt axis plt.bar() plt.axis import figure pyplot highlight_text pypalettes plt.subplots() xlabel ylabel title legend colorbar savefig tight_layout grid set_xlim set_ylim plot scatter hist boxplot imshow cmap alpha bins tick_params annotate quiver contour barh stackplot subplots_adjust axhline axvline semilogx semilogy loglog polar streamplot hexbin pcolor tricontour errorbar clabel set_aspect violinplot set_axis_off spines text hatch plt axis plt.bar() plt.axis import figure pyplot highlight_text pypalettes plt.subplots() xlabel ylabel title legend colorbar savefig tight_layout grid set_xlim set_ylim plot scatter hist boxplot imshow cmap alpha bins tick_params annotate quiver contour barh stackplot subplots_adjust axhline axvline semilogx semilogy loglog polar streamplot hexbin pcolor tricontour errorbar clabel set_aspect violinplot set_axis_off spines text hatch plt axis plt.bar() plt.axis import figure pyplot highlight_text pypalettes plt.subplots() xlabel ylabel title legend colorbar savefig tight_layout grid set_xlim set_ylim plot scatter hist boxplot imshow cmap alpha bins tick_params annotate quiver contour barh stackplot subplots_adjust axhline axvline semilogx semilogy loglog polar streamplot hexbin pcolor tricontour errorbar clabel set_aspect violinplot set_axis_off spines text hatch plt axis plt.bar() plt.axis import figure pyplot highlight_text pypalettes plt.subplots() xlabel ylabel title legend colorbar savefig tight_layout grid set_xlim set_ylim plot scatter hist boxplot imshow cmap alpha bins tick_params annotate quiver contour barh stackplot subplots_adjust axhline axvline semilogx semilogy loglog polar streamplot hexbin pcolor tricontour errorbar clabel set_aspect violinplot set_axis_off spines text hatch plt axis plt.bar() plt.axis import figure pyplot highlight_text pypalettes plt.subplots() xlabel ylabel title legend colorbar savefig tight_layout grid set_xlim set_ylim plot scatter hist boxplot imshow cmap alpha bins tick_params annotate quiver contour barh stackplot subplots_adjust axhline axvline semilogx semilogy loglog polar streamplot hexbin pcolor tricontour errorbar clabel set_aspect violinplot set_axis_off spines text hatch plt axis plt.bar() plt.axis import figure pyplot highlight_text pypalettes plt.subplots() xlabel ylabel title legend colorbar savefig tight_layout grid set_xlim set_ylim plot scatter hist boxplot imshow cmap alpha bins tick_params annotate quiver contour barh stackplot subplots_adjust axhline axvline semilogx semilogy loglog polar streamplot hexbin pcolor tricontour errorbar clabel set_aspect violinplot set_axis_off spines text hatch plt axis plt.bar() plt.axis import figure pyplot highlight_text pypalettes plt.subplots() xlabel ylabel title legend colorbar savefig tight_layout grid set_xlim set_ylim plot scatter hist boxplot imshow cmap alpha bins tick_params annotate quiver contour barh stackplot subplots_adjust axhline axvline semilogx semilogy loglog polar streamplot hexbin pcolor tricontour errorbar clabel set_aspect violinplot set_axis_off spines text hatch plt axis plt.bar() plt.axis import figure pyplot highlight_text pypalettes plt.subplots() xlabel ylabel title legend colorbar savefig tight_layout grid set_xlim set_ylim plot scatter hist boxplot imshow cmap alpha bins tick_params annotate quiver contour barh stackplot subplots_adjust axhline axvline semilogx semilogy loglog polar streamplot hexbin pcolor tricontour errorbar clabel set_aspect violinplot set_axis_off spines text hatch plt axis plt.bar() plt.axis import figure pyplot highlight_text pypalettes plt.subplots() xlabel ylabel title legend colorbar savefig tight_layout grid set_xlim set_ylim plot scatter hist boxplot imshow cmap alpha bins tick_params annotate quiver contour barh stackplot subplots_adjust axhline axvline semilogx semilogy loglog polar streamplot hexbin pcolor tricontour errorbar clabel set_aspect violinplot set_axis_off spines text hatch plt axis plt.bar() plt.axis import figure pyplot highlight_text pypalettes plt.subplots() xlabel ylabel title legend colorbar savefig tight_layout grid set_xlim set_ylim plot scatter hist boxplot imshow cmap alpha bins tick_params annotate quiver contour barh stackplot subplots_adjust axhline axvline semilogx semilogy loglog polar streamplot hexbin pcolor tricontour errorbar clabel set_aspect violinplot set_axis_off spines text hatch plt axis plt.bar() plt.axis import figure pyplot highlight_text pypalettes plt.subplots() xlabel ylabel title legend colorbar savefig tight_layout grid set_xlim set_ylim plot scatter hist boxplot imshow cmap alpha bins tick_params annotate quiver contour barh stackplot subplots_adjust axhline axvline semilogx semilogy loglog polar streamplot hexbin pcolor tricontour errorbar clabel set_aspect violinplot set_axis_off spines text hatch plt axis plt.bar() plt.axis import figure pyplot highlight_text pypalettes plt.subplots() xlabel ylabel title legend colorbar savefig tight_layout grid set_xlim set_ylim plot scatter hist boxplot imshow cmap alpha bins tick_params annotate quiver contour barh stackplot subplots_adjust axhline axvline semilogx semilogy loglog polar streamplot hexbin pcolor tricontour errorbar clabel set_aspect violinplot set_axis_off spines text hatch plt axis plt.bar() plt.axis import figure pyplot highlight_text pypalettes plt.subplots() xlabel ylabel title legend colorbar savefig tight_layout grid set_xlim set_ylim plot scatter hist boxplot imshow cmap alpha bins tick_params annotate quiver contour barh stackplot subplots_adjust axhline axvline semilogx semilogy loglog polar streamplot hexbin pcolor tricontour errorbar clabel set_aspect violinplot set_axis_off spines text hatch plt axis plt.bar() plt.axis import figure pyplot highlight_text pypalettes plt.subplots() xlabel ylabel title legend colorbar savefig tight_layout grid set_xlim set_ylim plot scatter hist boxplot imshow cmap alpha bins tick_params annotate quiver contour barh stackplot subplots_adjust axhline axvline semilogx semilogy loglog polar streamplot hexbin pcolor tricontour errorbar clabel set_aspect violinplot set_axis_off spines text hatch plt axis plt.bar() plt.axis import figure pyplot highlight_text pypalettes plt.subplots() xlabel ylabel title legend colorbar savefig tight_layout grid set_xlim set_ylim plot scatter hist boxplot imshow cmap alpha bins tick_params annotate quiver contour barh stackplot subplots_adjust axhline axvline semilogx semilogy loglog polar streamplot hexbin pcolor tricontour errorbar clabel set_aspect violinplot set_axis_off spines text hatch plt axis plt.bar() plt.axis import figure pyplot highlight_text pypalettes plt.subplots() xlabel ylabel title legend colorbar savefig tight_layout grid set_xlim set_ylim plot scatter hist boxplot imshow cmap alpha bins tick_params annotate quiver contour barh stackplot subplots_adjust axhline axvline semilogx semilogy loglog polar streamplot hexbin pcolor tricontour errorbar clabel set_aspect violinplot set_axis_off spines text hatch plt axis plt.bar() plt.axis import figure pyplot highlight_text pypalettes plt.subplots() xlabel ylabel title legend colorbar savefig tight_layout grid set_xlim set_ylim plot scatter hist boxplot imshow cmap alpha bins tick_params annotate quiver contour barh stackplot subplots_adjust axhline axvline semilogx semilogy loglog polar streamplot hexbin pcolor tricontour errorbar clabel set_aspect violinplot set_axis_off spines text hatch plt axis plt.bar() plt.axis import figure pyplot highlight_text pypalettes plt.subplots() xlabel ylabel title legend colorbar savefig tight_layout grid set_xlim set_ylim plot scatter hist boxplot imshow cmap alpha bins tick_params annotate quiver contour barh stackplot subplots_adjust axhline axvline semilogx semilogy loglog polar streamplot hexbin pcolor tricontour errorbar clabel set_aspect violinplot set_axis_off spines text hatch plt axis plt.bar() plt.axis import figure pyplot highlight_text pypalettes plt.subplots() xlabel ylabel title legend colorbar savefig tight_layout grid set_xlim set_ylim plot scatter hist boxplot imshow cmap alpha bins tick_params annotate quiver contour barh stackplot subplots_adjust axhline axvline semilogx semilogy loglog polar streamplot hexbin pcolor tricontour errorbar clabel set_aspect violinplot set_axis_off spines text hatch plt axis plt.bar() plt.axis import figure pyplot highlight_text pypalettes plt.subplots() xlabel ylabel title legend colorbar savefig tight_layout grid set_xlim set_ylim plot scatter hist boxplot imshow cmap alpha bins tick_params annotate quiver contour barh stackplot subplots_adjust axhline axvline semilogx semilogy loglog polar streamplot hexbin pcolor tricontour errorbar clabel set_aspect violinplot set_axis_off spines text hatch plt axis plt.bar() plt.axis import figure pyplot highlight_text pypalettes plt.subplots() xlabel ylabel title legend colorbar savefig tight_layout grid set_xlim set_ylim plot scatter hist boxplot imshow cmap alpha bins tick_params annotate quiver contour barh stackplot subplots_adjust axhline axvline semilogx semilogy loglog polar streamplot hexbin pcolor tricontour errorbar clabel set_aspect violinplot set_axis_off spines text hatch plt axis plt.bar() plt.axis import figure pyplot highlight_text pypalettes plt.subplots() xlabel ylabel title legend colorbar savefig tight_layout grid set_xlim set_ylim plot scatter hist boxplot imshow cmap alpha bins tick_params annotate quiver contour barh stackplot subplots_adjust axhline axvline semilogx semilogy loglog polar streamplot hexbin pcolor tricontour errorbar clabel set_aspect violinplot set_axis_off spines text hatch plt axis plt.bar() plt.axis import figure pyplot highlight_text pypalettes plt.subplots() xlabel ylabel title legend colorbar savefig tight_layout grid set_xlim set_ylim plot scatter hist boxplot imshow cmap alpha bins tick_params annotate quiver contour barh stackplot subplots_adjust axhline axvline semilogx semilogy loglog polar streamplot hexbin pcolor tricontour errorbar clabel set_aspect violinplot set_axis_off spines text hatch plt axis plt.bar() plt.axis import figure pyplot highlight_text pypalettes plt.subplots() xlabel ylabel title legend colorbar savefig tight_layout grid set_xlim set_ylim plot scatter hist boxplot imshow cmap alpha bins tick_params annotate quiver contour barh stackplot subplots_adjust axhline axvline semilogx semilogy loglog polar streamplot hexbin pcolor tricontour errorbar clabel set_aspect violinplot set_axis_off spines text hatch plt axis plt.bar() plt.axis import figure pyplot highlight_text pypalettes plt.subplots() xlabel ylabel title legend colorbar savefig tight_layout grid set_xlim set_ylim plot scatter hist boxplot imshow cmap alpha bins tick_params annotate quiver contour barh stackplot subplots_adjust axhline axvline semilogx semilogy loglog polar streamplot hexbin pcolor tricontour errorbar clabel set_aspect violinplot set_axis_off spines text hatch plt axis plt.bar() plt.axis import figure pyplot highlight_text pypalettes plt.subplots() xlabel ylabel title legend colorbar savefig tight_layout grid set_xlim set_ylim plot scatter hist boxplot imshow cmap alpha bins tick_params annotate quiver contour barh stackplot subplots_adjust axhline axvline semilogx semilogy loglog polar streamplot hexbin pcolor tricontour errorbar clabel set_aspect violinplot set_axis_off spines text hatch plt axis plt.bar() plt.axis import figure pyplot highlight_text pypalettes plt.subplots() xlabel ylabel title legend colorbar savefig tight_layout grid set_xlim set_ylim plot scatter hist boxplot imshow cmap alpha bins tick_params annotate quiver contour barh stackplot subplots_adjust axhline axvline semilogx semilogy loglog polar streamplot hexbin pcolor tricontour errorbar clabel set_aspect violinplot set_axis_off spines text hatch plt axis plt.bar() plt.axis import figure pyplot highlight_text pypalettes plt.subplots() xlabel ylabel title legend colorbar savefig tight_layout grid set_xlim set_ylim plot scatter hist boxplot imshow cmap alpha bins tick_params annotate quiver contour barh stackplot subplots_adjust axhline axvline semilogx semilogy loglog polar streamplot hexbin pcolor tricontour errorbar clabel set_aspect violinplot set_axis_off spines text hatch plt axis plt.bar() plt.axis import figure pyplot highlight_text pypalettes plt.subplots() xlabel ylabel title legend colorbar savefig tight_layout grid set_xlim set_ylim plot scatter hist boxplot imshow cmap alpha bins tick_params annotate quiver contour barh stackplot subplots_adjust axhline axvline semilogx semilogy loglog polar streamplot hexbin pcolor tricontour errorbar clabel set_aspect violinplot set_axis_off spines text hatch plt axis plt.bar() plt.axis import figure pyplot highlight_text pypalettes plt.subplots() xlabel ylabel title legend colorbar savefig tight_layout grid set_xlim set_ylim plot scatter hist boxplot imshow cmap alpha bins tick_params annotate quiver contour barh stackplot subplots_adjust axhline axvline semilogx semilogy loglog polar streamplot hexbin pcolor tricontour errorbar clabel set_aspect violinplot set_axis_off spines text hatch plt axis plt.bar() plt.axis import figure pyplot highlight_text pypalettes plt.subplots() xlabel ylabel title legend colorbar savefig tight_layout grid set_xlim set_ylim plot scatter hist boxplot imshow cmap alpha bins tick_params annotate quiver contour barh stackplot subplots_adjust axhline axvline semilogx semilogy loglog polar streamplot hexbin pcolor tricontour errorbar clabel set_aspect violinplot set_axis_off spines text hatch plt axis plt.bar() plt.axis import figure pyplot highlight_text pypalettes plt.subplots() xlabel ylabel title legend colorbar savefig tight_layout grid set_xlim set_ylim plot scatter hist boxplot imshow cmap alpha bins tick_params annotate quiver contour barh stackplot subplots_adjust axhline axvline semilogx semilogy loglog polar streamplot hexbin pcolor tricontour errorbar clabel set_aspect violinplot set_axis_off spines text hatch plt axis plt.bar() plt.axis import figure pyplot highlight_text pypalettes plt.subplots() xlabel ylabel title legend colorbar savefig tight_layout grid set_xlim set_ylim plot scatter hist boxplot imshow cmap alpha bins tick_params annotate quiver contour barh stackplot subplots_adjust axhline axvline semilogx semilogy loglog polar streamplot hexbin pcolor tricontour errorbar clabel set_aspect violinplot set_axis_off spines text hatch plt axis plt.bar() plt.axis import figure pyplot highlight_text pypalettes plt.subplots() xlabel ylabel title legend colorbar savefig tight_layout grid set_xlim set_ylim plot scatter hist boxplot imshow cmap alpha bins tick_params annotate quiver contour barh stackplot subplots_adjust axhline axvline semilogx semilogy loglog polar streamplot hexbin pcolor tricontour errorbar clabel set_aspect violinplot set_axis_off spines text hatch plt axis plt.bar() plt.axis import figure pyplot highlight_text pypalettes plt.subplots() xlabel ylabel title legend colorbar savefig tight_layout grid set_xlim set_ylim plot scatter hist boxplot imshow cmap alpha bins tick_params annotate quiver contour barh stackplot subplots_adjust axhline axvline semilogx semilogy loglog polar streamplot hexbin pcolor tricontour errorbar clabel set_aspect violinplot set_axis_off spines text hatch plt axis plt.bar() plt.axis import figure pyplot highlight_text pypalettes plt.subplots() xlabel ylabel title legend colorbar savefig tight_layout grid set_xlim set_ylim plot scatter hist boxplot imshow cmap alpha bins tick_params annotate quiver contour barh stackplot subplots_adjust axhline axvline semilogx semilogy loglog polar streamplot hexbin pcolor tricontour errorbar clabel set_aspect violinplot set_axis_off spines text hatch plt axis plt.bar() plt.axis import figure pyplot highlight_text pypalettes plt.subplots() xlabel ylabel title legend colorbar savefig tight_layout grid set_xlim set_ylim plot scatter hist boxplot imshow cmap alpha bins tick_params annotate quiver contour barh stackplot subplots_adjust axhline axvline semilogx semilogy loglog polar streamplot hexbin pcolor tricontour errorbar clabel set_aspect violinplot set_axis_off spines text hatch plt axis plt.bar() plt.axis import figure pyplot highlight_text pypalettes plt.subplots() xlabel ylabel title legend colorbar savefig tight_layout grid set_xlim set_ylim plot scatter hist boxplot imshow cmap alpha bins tick_params annotate quiver contour barh stackplot subplots_adjust axhline axvline semilogx semilogy loglog polar streamplot hexbin pcolor tricontour errorbar clabel set_aspect violinplot set_axis_off spines text hatch plt axis plt.bar() plt.axis import figure pyplot highlight_text pypalettes plt.subplots() xlabel ylabel title legend colorbar savefig tight_layout grid set_xlim set_ylim plot scatter hist boxplot imshow cmap alpha bins tick_params annotate quiver contour barh stackplot subplots_adjust axhline axvline semilogx semilogy loglog polar streamplot hexbin pcolor tricontour errorbar clabel set_aspect violinplot set_axis_off spines text hatch plt axis plt.bar() plt.axis import figure pyplot highlight_text pypalettes plt.subplots() xlabel ylabel title legend colorbar savefig tight_layout grid set_xlim set_ylim plot scatter hist boxplot imshow cmap alpha bins tick_params annotate quiver contour barh stackplot subplots_adjust axhline axvline semilogx semilogy loglog polar streamplot hexbin pcolor tricontour errorbar clabel set_aspect violinplot set_axis_off spines text hatch plt axis plt.bar() plt.axis import figure pyplot highlight_text pypalettes plt.subplots() xlabel ylabel title legend colorbar savefig tight_layout grid set_xlim set_ylim plot scatter hist boxplot imshow cmap alpha bins tick_params annotate quiver contour barh stackplot subplots_adjust axhline axvline semilogx semilogy loglog polar streamplot hexbin pcolor tricontour errorbar clabel set_aspect violinplot set_axis_off spines text hatch plt axis plt.bar() plt.axis import figure pyplot highlight_text pypalettes plt.subplots() xlabel ylabel title legend colorbar savefig tight_layout grid set_xlim set_ylim plot scatter hist boxplot imshow cmap alpha bins tick_params annotate quiver contour barh stackplot subplots_adjust axhline axvline semilogx semilogy loglog polar streamplot hexbin pcolor tricontour errorbar clabel set_aspect violinplot set_axis_off spines text hatch plt axis plt.bar() plt.axis import figure pyplot highlight_text pypalettes plt.subplots() xlabel ylabel title legend colorbar savefig tight_layout grid set_xlim set_ylim plot scatter hist boxplot imshow cmap alpha bins tick_params annotate quiver contour barh stackplot subplots_adjust axhline axvline semilogx semilogy loglog polar streamplot hexbin pcolor tricontour errorbar clabel set_aspect violinplot set_axis_off spines text hatch plt axis plt.bar() plt.axis import figure pyplot highlight_text pypalettes plt.subplots() xlabel ylabel title legend colorbar savefig tight_layout grid set_xlim set_ylim plot scatter hist boxplot imshow cmap alpha bins tick_params annotate quiver contour barh stackplot subplots_adjust axhline axvline semilogx semilogy loglog polar streamplot hexbin pcolor tricontour errorbar clabel set_aspect violinplot set_axis_off spines text hatch plt axis plt.bar() plt.axis import figure pyplot highlight_text pypalettes plt.subplots() xlabel ylabel title legend colorbar savefig tight_layout grid set_xlim set_ylim plot scatter hist boxplot imshow cmap alpha bins tick_params annotate quiver contour barh stackplot subplots_adjust axhline axvline semilogx semilogy loglog polar streamplot hexbin pcolor tricontour errorbar clabel set_aspect violinplot set_axis_off spines text hatch plt axis plt.bar() plt.axis import figure pyplot highlight_text pypalettes plt.subplots() xlabel ylabel title legend colorbar savefig tight_layout grid set_xlim set_ylim plot scatter hist boxplot imshow cmap alpha bins tick_params annotate quiver contour barh stackplot subplots_adjust axhline axvline semilogx semilogy loglog polar streamplot hexbin pcolor tricontour errorbar clabel set_aspect violinplot set_axis_off spines text hatch plt axis plt.bar() plt.axis import figure pyplot highlight_text pypalettes plt.subplots() xlabel ylabel title legend colorbar savefig tight_layout grid set_xlim set_ylim plot scatter hist boxplot imshow cmap alpha bins tick_params annotate quiver contour barh stackplot subplots_adjust axhline axvline semilogx semilogy loglog polar streamplot hexbin pcolor tricontour errorbar clabel set_aspect violinplot set_axis_off spines text hatch plt axis plt.bar() plt.axis import figure pyplot highlight_text pypalettes plt.subplots() xlabel ylabel title legend colorbar savefig tight_layout grid set_xlim set_ylim plot scatter hist boxplot imshow cmap alpha bins tick_params annotate quiver contour barh stackplot subplots_adjust axhline axvline semilogx semilogy loglog polar streamplot hexbin pcolor tricontour errorbar clabel set_aspect violinplot set_axis_off spines text hatch plt axis plt.bar() plt.axis import figure pyplot highlight_text pypalettes plt.subplots() xlabel ylabel title legend colorbar savefig tight_layout grid set_xlim set_ylim plot scatter hist boxplot imshow cmap alpha bins tick_params annotate quiver contour barh stackplot subplots_adjust axhline axvline semilogx semilogy loglog polar streamplot hexbin pcolor tricontour errorbar clabel set_aspect violinplot set_axis_off spines text hatch plt axis plt.bar() plt.axis import figure pyplot highlight_text pypalettes plt.subplots() xlabel ylabel title legend colorbar savefig tight_layout grid set_xlim set_ylim plot scatter hist boxplot imshow cmap alpha bins tick_params annotate quiver contour barh stackplot subplots_adjust axhline axvline semilogx semilogy loglog polar streamplot hexbin pcolor tricontour errorbar clabel set_aspect violinplot set_axis_off spines text hatch plt axis plt.bar() plt.axis import figure pyplot highlight_text pypalettes plt.subplots() xlabel ylabel title legend colorbar savefig tight_layout grid set_xlim set_ylim plot scatter hist boxplot imshow cmap alpha bins tick_params annotate quiver contour barh stackplot subplots_adjust axhline axvline semilogx semilogy loglog polar streamplot hexbin pcolor tricontour errorbar clabel set_aspect violinplot set_axis_off spines text hatch plt axis plt.bar() plt.axis import figure pyplot highlight_text pypalettes plt.subplots() xlabel ylabel title legend colorbar savefig tight_layout grid set_xlim set_ylim plot scatter hist boxplot imshow cmap alpha bins tick_params annotate quiver contour barh stackplot subplots_adjust axhline axvline semilogx semilogy loglog polar streamplot hexbin pcolor tricontour errorbar clabel set_aspect violinplot set_axis_off spines text hatch plt axis plt.bar() plt.axis import figure pyplot highlight_text pypalettes plt.subplots() xlabel ylabel title legend colorbar savefig tight_layout grid set_xlim set_ylim plot scatter hist boxplot imshow cmap alpha bins tick_params annotate quiver contour barh stackplot subplots_adjust axhline axvline semilogx semilogy loglog polar streamplot hexbin pcolor tricontour errorbar clabel set_aspect violinplot set_axis_off spines text hatch plt axis plt.bar() plt.axis import figure pyplot highlight_text pypalettes plt.subplots() xlabel ylabel title legend colorbar savefig tight_layout grid set_xlim set_ylim plot scatter hist boxplot imshow cmap alpha bins tick_params annotate quiver contour barh stackplot subplots_adjust axhline axvline semilogx semilogy loglog polar streamplot hexbin pcolor tricontour errorbar clabel set_aspect violinplot set_axis_off spines text hatch plt axis plt.bar() plt.axis import figure pyplot highlight_text pypalettes plt.subplots() xlabel ylabel title legend colorbar savefig tight_layout grid set_xlim set_ylim plot scatter hist boxplot imshow cmap alpha bins tick_params annotate quiver contour barh stackplot subplots_adjust axhline axvline semilogx semilogy loglog polar streamplot hexbin pcolor tricontour errorbar clabel set_aspect violinplot set_axis_off spines text hatch plt axis plt.bar() plt.axis import figure pyplot highlight_text pypalettes plt.subplots() xlabel ylabel title legend colorbar savefig tight_layout grid set_xlim set_ylim plot scatter hist boxplot imshow cmap alpha bins tick_params annotate quiver contour barh stackplot subplots_adjust axhline axvline semilogx semilogy loglog polar streamplot hexbin pcolor tricontour errorbar clabel set_aspect violinplot set_axis_off spines text hatch plt axis plt.bar() plt.axis import figure pyplot highlight_text pypalettes plt.subplots() xlabel ylabel title legend colorbar savefig tight_layout grid set_xlim set_ylim plot scatter hist boxplot imshow cmap alpha bins tick_params annotate quiver contour barh stackplot subplots_adjust axhline axvline semilogx semilogy loglog polar streamplot hexbin pcolor tricontour errorbar clabel set_aspect violinplot set_axis_off spines text hatch plt axis plt.bar() plt.axis import figure pyplot highlight_text pypalettes plt.subplots() xlabel ylabel title legend colorbar savefig tight_layout grid set_xlim set_ylim plot scatter hist boxplot imshow cmap alpha bins tick_params annotate quiver contour barh stackplot subplots_adjust axhline axvline semilogx semilogy loglog polar streamplot hexbin pcolor tricontour errorbar clabel set_aspect violinplot set_axis_off spines text hatch plt axis plt.bar() plt.axis import figure pyplot highlight_text pypalettes plt.subplots() xlabel ylabel title legend colorbar savefig tight_layout grid set_xlim set_ylim plot scatter hist boxplot imshow cmap alpha bins tick_params annotate quiver contour barh stackplot subplots_adjust axhline axvline semilogx semilogy loglog polar streamplot hexbin pcolor tricontour errorbar clabel set_aspect violinplot set_axis_off spines text hatch plt axis plt.bar() plt.axis import figure pyplot highlight_text pypalettes plt.subplots() xlabel ylabel title legend colorbar savefig tight_layout grid set_xlim set_ylim plot scatter hist boxplot imshow cmap alpha bins tick_params annotate quiver contour barh stackplot subplots_adjust axhline axvline semilogx semilogy loglog polar streamplot hexbin pcolor tricontour errorbar clabel set_aspect violinplot set_axis_off spines text hatch plt axis plt.bar() plt.axis import figure pyplot highlight_text pypalettes plt.subplots() xlabel ylabel title legend colorbar savefig tight_layout grid set_xlim set_ylim plot scatter hist boxplot imshow cmap alpha bins tick_params annotate quiver contour barh stackplot subplots_adjust axhline axvline semilogx semilogy loglog polar streamplot hexbin pcolor tricontour errorbar clabel set_aspect violinplot set_axis_off spines text hatch plt axis plt.bar() plt.axis import figure pyplot highlight_text pypalettes plt.subplots() xlabel ylabel title legend colorbar savefig tight_layout grid set_xlim set_ylim plot scatter hist boxplot imshow cmap alpha bins tick_params annotate quiver contour barh stackplot subplots_adjust axhline axvline semilogx semilogy loglog polar streamplot hexbin pcolor tricontour errorbar clabel set_aspect violinplot set_axis_off spines text hatch plt axis plt.bar() plt.axis import figure pyplot highlight_text pypalettes plt.subplots() xlabel ylabel title legend colorbar savefig tight_layout grid set_xlim set_ylim plot scatter hist boxplot imshow cmap alpha bins tick_params annotate quiver contour barh stackplot subplots_adjust axhline axvline semilogx semilogy loglog polar streamplot hexbin pcolor tricontour errorbar clabel set_aspect violinplot set_axis_off spines text hatch plt axis plt.bar() plt.axis import figure pyplot highlight_text pypalettes plt.subplots() xlabel ylabel title legend colorbar savefig tight_layout grid set_xlim set_ylim plot scatter hist boxplot imshow cmap alpha bins tick_params annotate quiver contour barh stackplot subplots_adjust axhline axvline semilogx semilogy loglog polar streamplot hexbin pcolor tricontour errorbar clabel set_aspect violinplot set_axis_off spines text hatch plt axis plt.bar() plt.axis import figure pyplot highlight_text pypalettes plt.subplots() xlabel ylabel title legend colorbar savefig tight_layout grid set_xlim set_ylim plot scatter hist boxplot imshow cmap alpha bins tick_params annotate quiver contour barh stackplot subplots_adjust axhline axvline semilogx semilogy loglog polar streamplot hexbin pcolor tricontour errorbar clabel set_aspect violinplot set_axis_off spines text hatch plt axis plt.bar() plt.axis import figure pyplot highlight_text pypalettes plt.subplots() xlabel ylabel title legend colorbar savefig tight_layout grid set_xlim set_ylim plot scatter hist boxplot imshow cmap alpha bins tick_params annotate quiver contour barh stackplot subplots_adjust axhline axvline semilogx semilogy loglog polar streamplot hexbin pcolor tricontour errorbar clabel set_aspect violinplot set_axis_off spines text hatch plt axis plt.bar() plt.axis import figure pyplot highlight_text pypalettes plt.subplots() xlabel ylabel title legend colorbar savefig tight_layout grid set_xlim set_ylim plot scatter hist boxplot imshow cmap alpha bins tick_params annotate quiver contour barh stackplot subplots_adjust axhline axvline semilogx semilogy loglog polar streamplot hexbin pcolor tricontour errorbar clabel set_aspect violinplot set_axis_off spines text hatch plt axis plt.bar() plt.axis import figure pyplot highlight_text pypalettes plt.subplots() xlabel ylabel title legend colorbar savefig tight_layout grid set_xlim set_ylim plot scatter hist boxplot imshow cmap alpha bins tick_params annotate quiver contour barh stackplot subplots_adjust axhline axvline semilogx semilogy loglog polar streamplot hexbin pcolor tricontour errorbar clabel set_aspect violinplot set_axis_off spines text hatch plt axis plt.bar() plt.axis import figure pyplot highlight_text pypalettes plt.subplots() xlabel ylabel title legend colorbar savefig tight_layout grid set_xlim set_ylim plot scatter hist boxplot imshow cmap alpha bins tick_params annotate quiver contour barh stackplot subplots_adjust axhline axvline semilogx semilogy loglog polar streamplot hexbin pcolor tricontour errorbar clabel set_aspect violinplot set_axis_off spines text hatch plt axis plt.bar() plt.axis import figure pyplot highlight_text pypalettes plt.subplots() xlabel ylabel title legend colorbar savefig tight_layout grid set_xlim set_ylim plot scatter hist boxplot imshow cmap alpha bins tick_params annotate quiver contour barh stackplot subplots_adjust axhline axvline semilogx semilogy loglog polar streamplot hexbin pcolor tricontour errorbar clabel set_aspect violinplot set_axis_off spines text hatch plt axis plt.bar() plt.axis import figure pyplot highlight_text pypalettes plt.subplots() xlabel ylabel title legend colorbar savefig tight_layout grid set_xlim set_ylim plot scatter hist boxplot imshow cmap alpha bins tick_params annotate quiver contour barh stackplot subplots_adjust axhline axvline semilogx semilogy loglog polar streamplot hexbin pcolor tricontour errorbar clabel set_aspect violinplot set_axis_off spines text hatch plt axis plt.bar() plt.axis import figure pyplot highlight_text pypalettes plt.subplots() xlabel ylabel title legend colorbar savefig tight_layout grid set_xlim set_ylim plot scatter hist boxplot imshow cmap alpha bins tick_params annotate quiver contour barh stackplot subplots_adjust axhline axvline semilogx semilogy loglog polar streamplot hexbin pcolor tricontour errorbar clabel set_aspect violinplot set_axis_off spines text hatch plt axis plt.bar() plt.axis import figure pyplot highlight_text pypalettes plt.subplots() xlabel ylabel title legend colorbar savefig tight_layout grid set_xlim set_ylim plot scatter hist boxplot imshow cmap alpha bins tick_params annotate quiver contour barh stackplot subplots_adjust axhline axvline semilogx semilogy loglog polar streamplot hexbin pcolor tricontour errorbar clabel set_aspect violinplot set_axis_off spines text hatch plt axis plt.bar() plt.axis import figure pyplot highlight_text pypalettes plt.subplots() xlabel ylabel title legend colorbar savefig tight_layout grid set_xlim set_ylim plot scatter hist boxplot imshow cmap alpha bins tick_params annotate quiver contour barh stackplot subplots_adjust axhline axvline semilogx semilogy loglog polar streamplot hexbin pcolor tricontour errorbar clabel set_aspect violinplot set_axis_off spines text hatch plt axis plt.bar() plt.axis import figure pyplot highlight_text pypalettes plt.subplots() xlabel ylabel title legend colorbar savefig tight_layout grid set_xlim set_ylim plot scatter hist boxplot imshow cmap alpha bins tick_params annotate quiver contour barh stackplot subplots_adjust axhline axvline semilogx semilogy loglog polar streamplot hexbin pcolor tricontour errorbar clabel set_aspect violinplot set_axis_off spines text hatch plt axis plt.bar() plt.axis import figure pyplot highlight_text pypalettes plt.subplots() xlabel ylabel title legend colorbar savefig tight_layout grid set_xlim set_ylim plot scatter hist boxplot imshow cmap alpha bins tick_params annotate quiver contour barh stackplot subplots_adjust axhline axvline semilogx semilogy loglog polar streamplot hexbin pcolor tricontour errorbar clabel set_aspect violinplot set_axis_off spines text hatch plt axis plt.bar() plt.axis import figure pyplot highlight_text pypalettes plt.subplots() xlabel ylabel title legend colorbar savefig tight_layout grid set_xlim set_ylim plot scatter hist boxplot imshow cmap alpha bins tick_params annotate quiver contour barh stackplot subplots_adjust axhline axvline semilogx semilogy loglog polar streamplot hexbin pcolor tricontour errorbar clabel set_aspect violinplot set_axis_off spines text hatch plt axis plt.bar() plt.axis import figure pyplot highlight_text pypalettes plt.subplots() xlabel ylabel title legend colorbar savefig tight_layout grid set_xlim set_ylim plot scatter hist boxplot imshow cmap alpha bins tick_params annotate quiver contour barh stackplot subplots_adjust axhline axvline semilogx semilogy loglog polar streamplot hexbin pcolor tricontour errorbar clabel set_aspect violinplot set_axis_off spines text hatch plt axis plt.bar() plt.axis import figure pyplot highlight_text pypalettes plt.subplots() xlabel ylabel title legend colorbar savefig tight_layout grid set_xlim set_ylim plot scatter hist boxplot imshow cmap alpha bins tick_params annotate quiver contour barh stackplot subplots_adjust axhline axvline semilogx semilogy loglog polar streamplot hexbin pcolor tricontour errorbar clabel set_aspect violinplot set_axis_off spines text hatch plt axis plt.bar() plt.axis import figure pyplot highlight_text pypalettes plt.subplots() xlabel ylabel title legend colorbar savefig tight_layout grid set_xlim set_ylim plot scatter hist boxplot imshow cmap alpha bins tick_params annotate quiver contour barh stackplot subplots_adjust axhline axvline semilogx semilogy loglog polar streamplot hexbin pcolor tricontour errorbar clabel set_aspect violinplot set_axis_off spines text hatch plt axis plt.bar() plt.axis import figure pyplot highlight_text pypalettes plt.subplots() xlabel ylabel title legend colorbar savefig tight_layout grid set_xlim set_ylim plot scatter hist boxplot imshow cmap alpha bins tick_params annotate quiver contour barh stackplot subplots_adjust axhline axvline semilogx semilogy loglog polar streamplot hexbin pcolor tricontour errorbar clabel set_aspect violinplot set_axis_off spines text hatch plt axis plt.bar() plt.axis import figure pyplot highlight_text pypalettes plt.subplots() xlabel ylabel title legend colorbar savefig tight_layout grid set_xlim set_ylim plot scatter hist boxplot imshow cmap alpha bins tick_params annotate quiver contour barh stackplot subplots_adjust axhline axvline semilogx semilogy loglog polar streamplot hexbin pcolor tricontour errorbar clabel set_aspect violinplot set_axis_off spines text hatch plt axis plt.bar() plt.axis import figure pyplot highlight_text pypalettes plt.subplots() xlabel ylabel title legend colorbar savefig tight_layout grid set_xlim set_ylim plot scatter hist boxplot imshow cmap alpha bins tick_params annotate quiver contour barh stackplot subplots_adjust axhline axvline semilogx semilogy loglog polar streamplot hexbin pcolor tricontour errorbar clabel set_aspect violinplot set_axis_off spines text hatch plt axis plt.bar() plt.axis import figure pyplot highlight_text pypalettes plt.subplots() xlabel ylabel title legend colorbar savefig tight_layout grid set_xlim set_ylim plot scatter hist boxplot imshow cmap alpha bins tick_params annotate quiver contour barh stackplot subplots_adjust axhline axvline semilogx semilogy loglog polar streamplot hexbin pcolor tricontour errorbar clabel set_aspect violinplot set_axis_off spines text hatch plt axis plt.bar() plt.axis import figure pyplot highlight_text pypalettes plt.subplots() xlabel ylabel title legend colorbar savefig tight_layout grid set_xlim set_ylim plot scatter hist boxplot imshow cmap alpha bins tick_params annotate quiver contour barh stackplot subplots_adjust axhline axvline semilogx semilogy loglog polar streamplot hexbin pcolor tricontour errorbar clabel set_aspect violinplot set_axis_off spines text hatch plt axis plt.bar() plt.axis import figure pyplot highlight_text pypalettes plt.subplots() xlabel ylabel title legend colorbar savefig tight_layout grid set_xlim set_ylim plot scatter hist boxplot imshow cmap alpha bins tick_params annotate quiver contour barh stackplot subplots_adjust axhline axvline semilogx semilogy loglog polar streamplot hexbin pcolor tricontour errorbar clabel set_aspect violinplot set_axis_off spines text hatch plt axis plt.bar() plt.axis import figure pyplot highlight_text pypalettes plt.subplots() xlabel ylabel title legend colorbar savefig tight_layout grid set_xlim set_ylim plot scatter hist boxplot imshow cmap alpha bins tick_params annotate quiver contour barh stackplot subplots_adjust axhline axvline semilogx semilogy loglog polar streamplot hexbin pcolor tricontour errorbar clabel set_aspect violinplot set_axis_off spines text hatch plt axis plt.bar() plt.axis import figure pyplot highlight_text pypalettes plt.subplots() xlabel ylabel title legend colorbar savefig tight_layout grid set_xlim set_ylim plot scatter hist boxplot imshow cmap alpha bins tick_params annotate quiver contour barh stackplot subplots_adjust axhline axvline semilogx semilogy loglog polar streamplot hexbin pcolor tricontour errorbar clabel set_aspect violinplot set_axis_off spines text hatch plt axis plt.bar() plt.axis import figure pyplot highlight_text pypalettes plt.subplots() xlabel ylabel title legend colorbar savefig tight_layout grid set_xlim set_ylim plot scatter hist boxplot imshow cmap alpha bins tick_params annotate quiver contour barh stackplot subplots_adjust axhline axvline semilogx semilogy loglog polar streamplot hexbin pcolor tricontour errorbar clabel set_aspect violinplot set_axis_off spines text hatch plt axis plt.bar() plt.axis import figure pyplot highlight_text pypalettes plt.subplots() xlabel ylabel title legend colorbar savefig tight_layout grid set_xlim set_ylim plot scatter hist boxplot imshow cmap alpha bins tick_params annotate quiver contour barh stackplot subplots_adjust axhline axvline semilogx semilogy loglog polar streamplot hexbin pcolor tricontour errorbar clabel set_aspect violinplot set_axis_off spines text hatch plt axis plt.bar() plt.axis import figure pyplot highlight_text pypalettes plt.subplots() xlabel ylabel title legend colorbar savefig tight_layout grid set_xlim set_ylim plot scatter hist boxplot imshow cmap alpha bins tick_params annotate quiver contour barh stackplot subplots_adjust axhline axvline semilogx semilogy loglog polar streamplot hexbin pcolor tricontour errorbar clabel set_aspect violinplot set_axis_off spines text hatch plt axis plt.bar() plt.axis import figure pyplot highlight_text pypalettes plt.subplots() xlabel ylabel title legend colorbar savefig tight_layout grid set_xlim set_ylim plot scatter hist boxplot imshow cmap alpha bins tick_params annotate quiver contour barh stackplot subplots_adjust axhline axvline semilogx semilogy loglog polar streamplot hexbin pcolor tricontour errorbar clabel set_aspect violinplot set_axis_off spines text hatch plt axis plt.bar() plt.axis import figure pyplot highlight_text pypalettes plt.subplots() xlabel ylabel title legend colorbar savefig tight_layout grid set_xlim set_ylim plot scatter hist boxplot imshow cmap alpha bins tick_params annotate quiver contour barh stackplot subplots_adjust axhline axvline semilogx semilogy loglog polar streamplot hexbin pcolor tricontour errorbar clabel set_aspect violinplot set_axis_off spines text hatch plt axis plt.bar() plt.axis import figure pyplot highlight_text pypalettes plt.subplots() xlabel ylabel title legend colorbar savefig tight_layout grid set_xlim set_ylim plot scatter hist boxplot imshow cmap alpha bins tick_params annotate quiver contour barh stackplot subplots_adjust axhline axvline semilogx semilogy loglog polar streamplot hexbin pcolor tricontour errorbar clabel set_aspect violinplot set_axis_off spines text hatch plt axis plt.bar() plt.axis import figure pyplot highlight_text pypalettes plt.subplots() xlabel ylabel title legend colorbar savefig tight_layout grid set_xlim set_ylim plot scatter hist boxplot imshow cmap alpha bins tick_params annotate quiver contour barh stackplot subplots_adjust axhline axvline semilogx semilogy loglog polar streamplot hexbin pcolor tricontour errorbar clabel set_aspect violinplot set_axis_off spines text hatch plt axis plt.bar() plt.axis import figure pyplot highlight_text pypalettes plt.subplots() xlabel ylabel title legend colorbar savefig tight_layout grid set_xlim set_ylim plot scatter hist boxplot imshow cmap alpha bins tick_params annotate quiver contour barh stackplot subplots_adjust axhline axvline semilogx semilogy loglog polar streamplot hexbin pcolor tricontour errorbar clabel set_aspect violinplot set_axis_off spines text hatch plt axis plt.bar() plt.axis import figure pyplot highlight_text pypalettes plt.subplots() xlabel ylabel title legend colorbar savefig tight_layout grid set_xlim set_ylim plot scatter hist boxplot imshow cmap alpha bins tick_params annotate quiver contour barh stackplot subplots_adjust axhline axvline semilogx semilogy loglog polar streamplot hexbin pcolor tricontour errorbar clabel set_aspect violinplot set_axis_off spines text hatch plt axis plt.bar() plt.axis import figure pyplot highlight_text pypalettes plt.subplots() xlabel ylabel title legend colorbar savefig tight_layout grid set_xlim set_ylim plot scatter hist boxplot imshow cmap alpha bins tick_params annotate quiver contour barh stackplot subplots_adjust axhline axvline semilogx semilogy loglog polar streamplot hexbin pcolor tricontour errorbar clabel set_aspect violinplot set_axis_off spines text hatch plt axis plt.bar() plt.axis import figure pyplot highlight_text pypalettes plt.subplots() xlabel ylabel title legend colorbar savefig tight_layout grid set_xlim set_ylim plot scatter hist boxplot imshow cmap alpha bins tick_params annotate quiver contour barh stackplot subplots_adjust axhline axvline semilogx semilogy loglog polar streamplot hexbin pcolor tricontour errorbar clabel set_aspect violinplot set_axis_off spines text hatch plt axis plt.bar() plt.axis import figure pyplot highlight_text pypalettes plt.subplots() xlabel ylabel title legend colorbar savefig tight_layout grid set_xlim set_ylim plot scatter hist boxplot imshow cmap alpha bins tick_params annotate quiver contour barh stackplot subplots_adjust axhline axvline semilogx semilogy loglog polar streamplot hexbin pcolor tricontour errorbar clabel set_aspect violinplot set_axis_off spines text hatch plt axis plt.bar() plt.axis import figure pyplot highlight_text pypalettes plt.subplots() xlabel ylabel title legend colorbar savefig tight_layout grid set_xlim set_ylim plot scatter hist boxplot imshow cmap alpha bins tick_params annotate quiver contour barh stackplot subplots_adjust axhline axvline semilogx semilogy loglog polar streamplot hexbin pcolor tricontour errorbar clabel set_aspect violinplot set_axis_off spines text hatch plt axis plt.bar() plt.axis import figure pyplot highlight_text pypalettes plt.subplots() xlabel ylabel title legend colorbar savefig tight_layout grid set_xlim set_ylim plot scatter hist boxplot imshow cmap alpha bins tick_params annotate quiver contour barh stackplot subplots_adjust axhline axvline semilogx semilogy loglog polar streamplot hexbin pcolor tricontour errorbar clabel set_aspect violinplot set_axis_off spines text hatch plt axis plt.bar() plt.axis import figure pyplot highlight_text pypalettes plt.subplots() xlabel ylabel title legend colorbar savefig tight_layout grid set_xlim set_ylim plot scatter hist boxplot imshow cmap alpha bins tick_params annotate quiver contour barh stackplot subplots_adjust axhline axvline semilogx semilogy loglog polar streamplot hexbin pcolor tricontour errorbar clabel set_aspect violinplot set_axis_off spines text hatch plt axis plt.bar() plt.axis import figure pyplot highlight_text pypalettes plt.subplots() xlabel ylabel title legend colorbar savefig tight_layout grid set_xlim set_ylim plot scatter hist boxplot imshow cmap alpha bins tick_params annotate quiver contour barh stackplot subplots_adjust axhline axvline semilogx semilogy loglog polar streamplot hexbin pcolor tricontour errorbar clabel set_aspect violinplot set_axis_off spines text hatch plt axis plt.bar() plt.axis import figure pyplot highlight_text pypalettes plt.subplots() xlabel ylabel title legend colorbar savefig tight_layout grid set_xlim set_ylim plot scatter hist boxplot imshow cmap alpha bins tick_params annotate quiver contour barh stackplot subplots_adjust axhline axvline semilogx semilogy loglog polar streamplot hexbin pcolor tricontour errorbar clabel set_aspect violinplot set_axis_off spines text hatch plt axis plt.bar() plt.axis import figure pyplot highlight_text pypalettes plt.subplots() xlabel ylabel title legend colorbar savefig tight_layout grid set_xlim set_ylim plot scatter hist boxplot imshow cmap alpha bins tick_params annotate quiver contour barh stackplot subplots_adjust axhline axvline semilogx semilogy loglog polar streamplot hexbin pcolor tricontour errorbar clabel set_aspect violinplot set_axis_off spines text hatch plt axis plt.bar() plt.axis import figure pyplot highlight_text pypalettes plt.subplots() xlabel ylabel title legend colorbar savefig tight_layout grid set_xlim set_ylim plot scatter hist boxplot imshow cmap alpha bins tick_params annotate quiver contour barh stackplot subplots_adjust axhline axvline semilogx semilogy loglog polar streamplot hexbin pcolor tricontour errorbar clabel set_aspect violinplot set_axis_off spines text hatch plt axis plt.bar() plt.axis import figure pyplot highlight_text pypalettes plt.subplots() xlabel ylabel title legend colorbar savefig tight_layout grid set_xlim set_ylim plot scatter hist boxplot imshow cmap alpha bins tick_params annotate quiver contour barh stackplot subplots_adjust axhline axvline semilogx semilogy loglog polar streamplot hexbin pcolor tricontour errorbar clabel set_aspect violinplot set_axis_off spines text hatch plt axis plt.bar() plt.axis import figure pyplot highlight_text pypalettes plt.subplots() xlabel ylabel title legend colorbar savefig tight_layout grid set_xlim set_ylim plot scatter hist boxplot imshow cmap alpha bins tick_params annotate quiver contour barh stackplot subplots_adjust axhline axvline semilogx semilogy loglog polar streamplot hexbin pcolor tricontour errorbar clabel set_aspect violinplot set_axis_off spines text hatch plt axis plt.bar() plt.axis import figure pyplot highlight_text pypalettes plt.subplots() xlabel ylabel title legend colorbar savefig tight_layout grid set_xlim set_ylim plot scatter hist boxplot imshow cmap alpha bins tick_params annotate quiver contour barh stackplot subplots_adjust axhline axvline semilogx semilogy loglog polar streamplot hexbin pcolor tricontour errorbar clabel set_aspect violinplot set_axis_off spines text hatch plt axis plt.bar() plt.axis import figure pyplot highlight_text pypalettes plt.subplots() xlabel ylabel title legend colorbar savefig tight_layout grid set_xlim set_ylim plot scatter hist boxplot imshow cmap alpha bins tick_params annotate quiver contour barh stackplot subplots_adjust axhline axvline semilogx semilogy loglog polar streamplot hexbin pcolor tricontour errorbar clabel set_aspect violinplot set_axis_off spines text hatch plt axis plt.bar() plt.axis import figure pyplot highlight_text pypalettes plt.subplots() xlabel ylabel title legend colorbar savefig tight_layout grid set_xlim set_ylim plot scatter hist boxplot imshow cmap alpha bins tick_params annotate quiver contour barh stackplot subplots_adjust axhline axvline semilogx semilogy loglog polar streamplot hexbin pcolor tricontour errorbar clabel set_aspect violinplot set_axis_off spines text hatch plt axis plt.bar() plt.axis import figure pyplot highlight_text pypalettes plt.subplots() xlabel ylabel title legend colorbar savefig tight_layout grid set_xlim set_ylim plot scatter hist boxplot imshow cmap alpha bins tick_params annotate quiver contour barh stackplot subplots_adjust axhline axvline semilogx semilogy loglog polar streamplot hexbin pcolor tricontour errorbar clabel set_aspect violinplot set_axis_off spines text hatch plt axis plt.bar() plt.axis import figure pyplot highlight_text pypalettes plt.subplots() xlabel ylabel title legend colorbar savefig tight_layout grid set_xlim set_ylim plot scatter hist boxplot imshow cmap alpha bins tick_params annotate quiver contour barh stackplot subplots_adjust axhline axvline semilogx semilogy loglog polar streamplot hexbin pcolor tricontour errorbar clabel set_aspect violinplot set_axis_off spines text hatch plt axis plt.bar() plt.axis import figure pyplot highlight_text pypalettes plt.subplots() xlabel ylabel title legend colorbar savefig tight_layout grid set_xlim set_ylim plot scatter hist boxplot imshow cmap alpha bins tick_params annotate quiver contour barh stackplot subplots_adjust axhline axvline semilogx semilogy loglog polar streamplot hexbin pcolor tricontour errorbar clabel set_aspect violinplot set_axis_off spines text hatch plt axis plt.bar() plt.axis import figure pyplot highlight_text pypalettes plt.subplots() xlabel ylabel title legend colorbar savefig tight_layout grid set_xlim set_ylim plot scatter hist boxplot imshow cmap alpha bins tick_params annotate quiver contour barh stackplot subplots_adjust axhline axvline semilogx semilogy loglog polar streamplot hexbin pcolor tricontour errorbar clabel set_aspect violinplot set_axis_off spines text hatch plt axis plt.bar() plt.axis import figure pyplot highlight_text pypalettes plt.subplots() xlabel ylabel title legend colorbar savefig tight_layout grid set_xlim set_ylim plot scatter hist boxplot imshow cmap alpha bins tick_params annotate quiver contour barh stackplot subplots_adjust axhline axvline semilogx semilogy loglog polar streamplot hexbin pcolor tricontour errorbar clabel set_aspect violinplot set_axis_off spines text hatch plt axis plt.bar() plt.axis import figure pyplot highlight_text pypalettes plt.subplots() xlabel ylabel title legend colorbar savefig tight_layout grid set_xlim set_ylim plot scatter hist boxplot imshow cmap alpha bins tick_params annotate quiver contour barh stackplot subplots_adjust axhline axvline semilogx semilogy loglog polar streamplot hexbin pcolor tricontour errorbar clabel set_aspect violinplot set_axis_off spines text hatch plt axis plt.bar() plt.axis import figure pyplot highlight_text pypalettes plt.subplots() xlabel ylabel title legend colorbar savefig tight_layout grid set_xlim set_ylim plot scatter hist boxplot imshow cmap alpha bins tick_params annotate quiver contour barh stackplot subplots_adjust axhline axvline semilogx semilogy loglog polar streamplot hexbin pcolor tricontour errorbar clabel set_aspect violinplot set_axis_off spines text hatch plt axis plt.bar() plt.axis import figure pyplot highlight_text pypalettes plt.subplots() xlabel ylabel title legend colorbar savefig tight_layout grid set_xlim set_ylim plot scatter hist boxplot imshow cmap alpha bins tick_params annotate quiver contour barh stackplot subplots_adjust axhline axvline semilogx semilogy loglog polar streamplot hexbin pcolor tricontour errorbar clabel set_aspect violinplot set_axis_off spines text hatch plt axis plt.bar() plt.axis import figure pyplot highlight_text pypalettes plt.subplots() xlabel ylabel title legend colorbar savefig tight_layout grid set_xlim set_ylim plot scatter hist boxplot imshow cmap alpha bins tick_params annotate quiver contour barh stackplot subplots_adjust axhline axvline semilogx semilogy loglog polar streamplot hexbin pcolor tricontour errorbar clabel set_aspect violinplot set_axis_off spines text hatch plt axis plt.bar() plt.axis import figure pyplot highlight_text pypalettes plt.subplots() xlabel ylabel title legend colorbar savefig tight_layout grid set_xlim set_ylim plot scatter hist boxplot imshow cmap alpha bins tick_params annotate quiver contour barh stackplot subplots_adjust axhline axvline semilogx semilogy loglog polar streamplot hexbin pcolor tricontour errorbar clabel set_aspect violinplot set_axis_off spines text hatch plt axis plt.bar() plt.axis import figure pyplot highlight_text pypalettes plt.subplots() xlabel ylabel title legend colorbar savefig tight_layout grid set_xlim set_ylim plot scatter hist boxplot imshow cmap alpha bins tick_params annotate quiver contour barh stackplot subplots_adjust axhline axvline semilogx semilogy loglog polar streamplot hexbin pcolor tricontour errorbar clabel set_aspect violinplot set_axis_off spines text hatch plt axis plt.bar() plt.axis import figure pyplot highlight_text pypalettes plt.subplots() xlabel ylabel title legend colorbar savefig tight_layout grid set_xlim set_ylim plot scatter hist boxplot imshow cmap alpha bins tick_params annotate quiver contour barh stackplot subplots_adjust axhline axvline semilogx semilogy loglog polar streamplot hexbin pcolor tricontour errorbar clabel set_aspect violinplot set_axis_off spines text hatch plt axis plt.bar() plt.axis import figure pyplot highlight_text pypalettes plt.subplots() xlabel ylabel title legend colorbar savefig tight_layout grid set_xlim set_ylim plot scatter hist boxplot imshow cmap alpha bins tick_params annotate quiver contour barh stackplot subplots_adjust axhline axvline semilogx semilogy loglog polar streamplot hexbin pcolor tricontour errorbar clabel set_aspect violinplot set_axis_off spines text hatch plt axis plt.bar() plt.axis import figure pyplot highlight_text pypalettes plt.subplots() xlabel ylabel title legend colorbar savefig tight_layout grid set_xlim set_ylim plot scatter hist boxplot imshow cmap alpha bins tick_params annotate quiver contour barh stackplot subplots_adjust axhline axvline semilogx semilogy loglog polar streamplot hexbin pcolor tricontour errorbar clabel set_aspect violinplot set_axis_off spines text hatch plt axis plt.bar() plt.axis import figure pyplot highlight_text pypalettes plt.subplots() xlabel ylabel title legend colorbar savefig tight_layout grid set_xlim set_ylim plot scatter hist boxplot imshow cmap alpha bins tick_params annotate quiver contour barh stackplot subplots_adjust axhline axvline semilogx semilogy loglog polar streamplot hexbin pcolor tricontour errorbar clabel set_aspect violinplot set_axis_off spines text hatch plt axis plt.bar() plt.axis import figure pyplot highlight_text pypalettes plt.subplots() xlabel ylabel title legend colorbar savefig tight_layout grid set_xlim set_ylim plot scatter hist boxplot imshow cmap alpha bins tick_params annotate quiver contour barh stackplot subplots_adjust axhline axvline semilogx semilogy loglog polar streamplot hexbin pcolor tricontour errorbar clabel set_aspect violinplot set_axis_off spines text hatch plt axis plt.bar() plt.axis import figure pyplot highlight_text pypalettes plt.subplots() xlabel ylabel title legend colorbar savefig tight_layout grid set_xlim set_ylim plot scatter hist boxplot imshow cmap alpha bins tick_params annotate quiver contour barh stackplot subplots_adjust axhline axvline semilogx semilogy loglog polar streamplot hexbin pcolor tricontour errorbar clabel set_aspect violinplot set_axis_off spines text hatch plt axis plt.bar() plt.axis import figure pyplot highlight_text pypalettes plt.subplots() xlabel ylabel title legend colorbar savefig tight_layout grid set_xlim set_ylim plot scatter hist boxplot imshow cmap alpha bins tick_params annotate quiver contour barh stackplot subplots_adjust axhline axvline semilogx semilogy loglog polar streamplot hexbin pcolor tricontour errorbar clabel set_aspect violinplot set_axis_off spines text hatch plt axis plt.bar() plt.axis import figure pyplot highlight_text pypalettes plt.subplots() xlabel ylabel title legend colorbar savefig tight_layout grid set_xlim set_ylim plot scatter hist boxplot imshow cmap alpha bins tick_params annotate quiver contour barh stackplot subplots_adjust axhline axvline semilogx semilogy loglog polar streamplot hexbin pcolor tricontour errorbar clabel set_aspect violinplot set_axis_off spines text hatch plt axis plt.bar() plt.axis import figure pyplot highlight_text pypalettes plt.subplots() xlabel ylabel title legend colorbar savefig tight_layout grid set_xlim set_ylim plot scatter hist boxplot imshow cmap alpha bins tick_params annotate quiver contour barh stackplot subplots_adjust axhline axvline semilogx semilogy loglog polar streamplot hexbin pcolor tricontour errorbar clabel set_aspect violinplot set_axis_off spines text hatch plt axis plt.bar() plt.axis import figure pyplot highlight_text pypalettes plt.subplots() xlabel ylabel title legend colorbar savefig tight_layout grid set_xlim set_ylim plot scatter hist boxplot imshow cmap alpha bins tick_params annotate quiver contour barh stackplot subplots_adjust axhline axvline semilogx semilogy loglog polar streamplot hexbin pcolor tricontour errorbar clabel set_aspect violinplot set_axis_off spines text hatch plt axis plt.bar() plt.axis import figure pyplot highlight_text pypalettes plt.subplots() xlabel ylabel title legend colorbar savefig tight_layout grid set_xlim set_ylim plot scatter hist boxplot imshow cmap alpha bins tick_params annotate quiver contour barh stackplot subplots_adjust axhline axvline semilogx semilogy loglog polar streamplot hexbin pcolor tricontour errorbar clabel set_aspect violinplot set_axis_off spines text hatch plt axis plt.bar() plt.axis import figure pyplot highlight_text pypalettes plt.subplots() xlabel ylabel title legend colorbar savefig tight_layout grid set_xlim set_ylim plot scatter hist boxplot imshow cmap alpha bins tick_params annotate quiver contour barh stackplot subplots_adjust axhline axvline semilogx semilogy loglog polar streamplot hexbin pcolor tricontour errorbar clabel set_aspect violinplot set_axis_off spines text hatch plt axis plt.bar() plt.axis import figure pyplot highlight_text pypalettes plt.subplots() xlabel ylabel title legend colorbar savefig tight_layout grid set_xlim set_ylim plot scatter hist boxplot imshow cmap alpha bins tick_params annotate quiver contour barh stackplot subplots_adjust axhline axvline semilogx semilogy loglog polar streamplot hexbin pcolor tricontour errorbar clabel set_aspect violinplot set_axis_off spines text hatch plt axis plt.bar() plt.axis import figure pyplot highlight_text pypalettes plt.subplots() xlabel ylabel title legend colorbar savefig tight_layout grid set_xlim set_ylim plot scatter hist boxplot imshow cmap alpha bins tick_params annotate quiver contour barh stackplot subplots_adjust axhline axvline semilogx semilogy loglog polar streamplot hexbin pcolor tricontour errorbar clabel set_aspect violinplot set_axis_off spines text hatch plt axis plt.bar() plt.axis import figure pyplot highlight_text pypalettes plt.subplots() xlabel ylabel title legend colorbar savefig tight_layout grid set_xlim set_ylim plot scatter hist boxplot imshow cmap alpha bins tick_params annotate quiver contour barh stackplot subplots_adjust axhline axvline semilogx semilogy loglog polar streamplot hexbin pcolor tricontour errorbar clabel set_aspect violinplot set_axis_off spines text hatch plt axis plt.bar() plt.axis import figure pyplot highlight_text pypalettes plt.subplots() xlabel ylabel title legend colorbar savefig tight_layout grid set_xlim set_ylim plot scatter hist boxplot imshow cmap alpha bins tick_params annotate quiver contour barh stackplot subplots_adjust axhline axvline semilogx semilogy loglog polar streamplot hexbin pcolor tricontour errorbar clabel set_aspect violinplot set_axis_off spines text hatch plt axis plt.bar() plt.axis import figure pyplot highlight_text pypalettes plt.subplots() xlabel ylabel title legend colorbar savefig tight_layout grid set_xlim set_ylim plot scatter hist boxplot imshow cmap alpha bins tick_params annotate quiver contour barh stackplot subplots_adjust axhline axvline semilogx semilogy loglog polar streamplot hexbin pcolor tricontour errorbar clabel set_aspect violinplot set_axis_off spines text hatch plt axis plt.bar() plt.axis import figure pyplot highlight_text pypalettes plt.subplots() xlabel ylabel title legend colorbar savefig tight_layout grid set_xlim set_ylim plot scatter hist boxplot imshow cmap alpha bins tick_params annotate quiver contour barh stackplot subplots_adjust axhline axvline semilogx semilogy loglog polar streamplot hexbin pcolor tricontour errorbar clabel set_aspect violinplot set_axis_off spines text hatch plt axis plt.bar() plt.axis import figure pyplot highlight_text pypalettes plt.subplots() xlabel ylabel title legend colorbar savefig tight_layout grid set_xlim set_ylim plot scatter hist boxplot imshow cmap alpha bins tick_params annotate quiver contour barh stackplot subplots_adjust axhline axvline semilogx semilogy loglog polar streamplot hexbin pcolor tricontour errorbar clabel set_aspect violinplot set_axis_off spines text hatch plt axis plt.bar() plt.axis import figure pyplot highlight_text pypalettes plt.subplots() xlabel ylabel title legend colorbar savefig tight_layout grid set_xlim set_ylim plot scatter hist boxplot imshow cmap alpha bins tick_params annotate quiver contour barh stackplot subplots_adjust axhline axvline semilogx semilogy loglog polar streamplot hexbin pcolor tricontour errorbar clabel set_aspect violinplot set_axis_off spines text hatch plt axis plt.bar() plt.axis import figure pyplot highlight_text pypalettes plt.subplots() xlabel ylabel title legend colorbar savefig tight_layout grid set_xlim set_ylim plot scatter hist boxplot imshow cmap alpha bins tick_params annotate quiver contour barh stackplot subplots_adjust axhline axvline semilogx semilogy loglog polar streamplot hexbin pcolor tricontour errorbar clabel set_aspect violinplot set_axis_off spines text hatch plt axis plt.bar() plt.axis import figure pyplot highlight_text pypalettes plt.subplots() xlabel ylabel title legend colorbar savefig tight_layout grid set_xlim set_ylim plot scatter hist boxplot imshow cmap alpha bins tick_params annotate quiver contour barh stackplot subplots_adjust axhline axvline semilogx semilogy loglog polar streamplot hexbin pcolor tricontour errorbar clabel set_aspect violinplot set_axis_off spines text hatch plt axis plt.bar() plt.axis import figure pyplot highlight_text pypalettes plt.subplots() xlabel ylabel title legend colorbar savefig tight_layout grid set_xlim set_ylim plot scatter hist boxplot imshow cmap alpha bins tick_params annotate quiver contour barh stackplot subplots_adjust axhline axvline semilogx semilogy loglog polar streamplot hexbin pcolor tricontour errorbar clabel set_aspect violinplot set_axis_off spines text hatch plt axis plt.bar() plt.axis import figure pyplot highlight_text pypalettes plt.subplots() xlabel ylabel title legend colorbar savefig tight_layout grid set_xlim set_ylim plot scatter hist boxplot imshow cmap alpha bins tick_params annotate quiver contour barh stackplot subplots_adjust axhline axvline semilogx semilogy loglog polar streamplot hexbin pcolor tricontour errorbar clabel set_aspect violinplot set_axis_off spines text hatch plt axis plt.bar() plt.axis import figure pyplot highlight_text pypalettes plt.subplots() xlabel ylabel title legend colorbar savefig tight_layout grid set_xlim set_ylim plot scatter hist boxplot imshow cmap alpha bins tick_params annotate quiver contour barh stackplot subplots_adjust axhline axvline semilogx semilogy loglog polar streamplot hexbin pcolor tricontour errorbar clabel set_aspect violinplot set_axis_off spines text hatch plt axis plt.bar() plt.axis import figure pyplot highlight_text pypalettes plt.subplots() xlabel ylabel title legend colorbar savefig tight_layout grid set_xlim set_ylim plot scatter hist boxplot imshow cmap alpha bins tick_params annotate quiver contour barh stackplot subplots_adjust axhline axvline semilogx semilogy loglog polar streamplot hexbin pcolor tricontour errorbar clabel set_aspect violinplot set_axis_off spines text hatch plt axis plt.bar() plt.axis import figure pyplot highlight_text pypalettes plt.subplots() xlabel ylabel title legend colorbar savefig tight_layout grid set_xlim set_ylim plot scatter hist boxplot imshow cmap alpha bins tick_params annotate quiver contour barh stackplot subplots_adjust axhline axvline semilogx semilogy loglog polar streamplot hexbin pcolor tricontour errorbar clabel set_aspect violinplot set_axis_off spines text hatch plt axis plt.bar() plt.axis import figure pyplot highlight_text pypalettes plt.subplots() xlabel ylabel title legend colorbar savefig tight_layout grid set_xlim set_ylim plot scatter hist boxplot imshow cmap alpha bins tick_params annotate quiver contour barh stackplot subplots_adjust axhline axvline semilogx semilogy loglog polar streamplot hexbin pcolor tricontour errorbar clabel set_aspect violinplot set_axis_off spines text hatch plt axis plt.bar() plt.axis import figure pyplot highlight_text pypalettes plt.subplots() xlabel ylabel title legend colorbar savefig tight_layout grid set_xlim set_ylim plot scatter hist boxplot imshow cmap alpha bins tick_params annotate quiver contour barh stackplot subplots_adjust axhline axvline semilogx semilogy loglog polar streamplot hexbin pcolor tricontour errorbar clabel set_aspect violinplot set_axis_off spines text hatch plt axis plt.bar() plt.axis import figure pyplot highlight_text pypalettes plt.subplots() xlabel ylabel title legend colorbar savefig tight_layout grid set_xlim set_ylim plot scatter hist boxplot imshow cmap alpha bins tick_params annotate quiver contour barh stackplot subplots_adjust axhline axvline semilogx semilogy loglog polar streamplot hexbin pcolor tricontour errorbar clabel set_aspect violinplot set_axis_off spines text hatch plt axis plt.bar() plt.axis import figure pyplot highlight_text pypalettes plt.subplots() xlabel ylabel title legend colorbar savefig tight_layout grid set_xlim set_ylim plot scatter hist boxplot imshow cmap alpha bins tick_params annotate quiver contour barh stackplot subplots_adjust axhline axvline semilogx semilogy loglog polar streamplot hexbin pcolor tricontour errorbar clabel set_aspect violinplot set_axis_off spines text hatch plt axis plt.bar() plt.axis import figure pyplot highlight_text pypalettes plt.subplots() xlabel ylabel title legend colorbar savefig tight_layout grid set_xlim set_ylim plot scatter hist boxplot imshow cmap alpha bins tick_params annotate quiver contour barh stackplot subplots_adjust axhline axvline semilogx semilogy loglog polar streamplot hexbin pcolor tricontour errorbar clabel set_aspect violinplot set_axis_off spines text hatch plt axis plt.bar() plt.axis import figure pyplot highlight_text pypalettes plt.subplots() xlabel ylabel title legend colorbar savefig tight_layout grid set_xlim set_ylim plot scatter hist boxplot imshow cmap alpha bins tick_params annotate quiver contour barh stackplot subplots_adjust axhline axvline semilogx semilogy loglog polar streamplot hexbin pcolor tricontour errorbar clabel set_aspect violinplot set_axis_off spines text hatch plt axis plt.bar() plt.axis import figure pyplot highlight_text pypalettes plt.subplots() xlabel ylabel title legend colorbar savefig tight_layout grid set_xlim set_ylim plot scatter hist boxplot imshow cmap alpha bins tick_params annotate quiver contour barh stackplot subplots_adjust axhline axvline semilogx semilogy loglog polar streamplot hexbin pcolor tricontour errorbar clabel set_aspect violinplot set_axis_off spines text hatch plt axis plt.bar() plt.axis import figure pyplot highlight_text pypalettes plt.subplots() xlabel ylabel title legend colorbar savefig tight_layout grid set_xlim set_ylim plot scatter hist boxplot imshow cmap alpha bins tick_params annotate quiver contour barh stackplot subplots_adjust axhline axvline semilogx semilogy loglog polar streamplot hexbin pcolor tricontour errorbar clabel set_aspect violinplot set_axis_off spines text hatch plt axis plt.bar() plt.axis import figure pyplot highlight_text pypalettes plt.subplots() xlabel ylabel title legend colorbar savefig tight_layout grid set_xlim set_ylim plot scatter hist boxplot imshow cmap alpha bins tick_params annotate quiver contour barh stackplot subplots_adjust axhline axvline semilogx semilogy loglog polar streamplot hexbin pcolor tricontour errorbar clabel set_aspect violinplot set_axis_off spines text hatch plt axis plt.bar() plt.axis import figure pyplot highlight_text pypalettes plt.subplots() xlabel ylabel title legend colorbar savefig tight_layout grid set_xlim set_ylim plot scatter hist boxplot imshow cmap alpha bins tick_params annotate quiver contour barh stackplot subplots_adjust axhline axvline semilogx semilogy loglog polar streamplot hexbin pcolor tricontour errorbar clabel set_aspect violinplot set_axis_off spines text hatch plt axis plt.bar() plt.axis import figure pyplot highlight_text pypalettes plt.subplots() xlabel ylabel title legend colorbar savefig tight_layout grid set_xlim set_ylim plot scatter hist boxplot imshow cmap alpha bins tick_params annotate quiver contour barh stackplot subplots_adjust axhline axvline semilogx semilogy loglog polar streamplot hexbin pcolor tricontour errorbar clabel set_aspect violinplot set_axis_off spines text hatch plt axis plt.bar() plt.axis import figure pyplot highlight_text pypalettes plt.subplots() xlabel ylabel title legend colorbar savefig tight_layout grid set_xlim set_ylim plot scatter hist boxplot imshow cmap alpha bins tick_params annotate quiver contour barh stackplot subplots_adjust axhline axvline semilogx semilogy loglog polar streamplot hexbin pcolor tricontour errorbar clabel set_aspect violinplot set_axis_off spines text hatch plt axis plt.bar() plt.axis import figure pyplot highlight_text pypalettes plt.subplots() xlabel ylabel title legend colorbar savefig tight_layout grid set_xlim set_ylim plot scatter hist boxplot imshow cmap alpha bins tick_params annotate quiver contour barh stackplot subplots_adjust axhline axvline semilogx semilogy loglog polar streamplot hexbin pcolor tricontour errorbar clabel set_aspect violinplot set_axis_off spines text hatch plt axis plt.bar() plt.axis import figure pyplot highlight_text pypalettes plt.subplots() xlabel ylabel title legend colorbar savefig tight_layout grid set_xlim set_ylim plot scatter hist boxplot imshow cmap alpha bins tick_params annotate quiver contour barh stackplot subplots_adjust axhline axvline semilogx semilogy loglog polar streamplot hexbin pcolor tricontour errorbar clabel set_aspect violinplot set_axis_off spines text hatch plt axis plt.bar() plt.axis import figure pyplot highlight_text pypalettes plt.subplots() xlabel ylabel title legend colorbar savefig tight_layout grid set_xlim set_ylim plot scatter hist boxplot imshow cmap alpha bins tick_params annotate quiver contour barh stackplot subplots_adjust axhline axvline semilogx semilogy loglog polar streamplot hexbin pcolor tricontour errorbar clabel set_aspect violinplot set_axis_off spines text hatch plt axis plt.bar() plt.axis import figure pyplot highlight_text pypalettes plt.subplots() xlabel ylabel title legend colorbar savefig tight_layout grid set_xlim set_ylim plot scatter hist boxplot imshow cmap alpha bins tick_params annotate quiver contour barh stackplot subplots_adjust axhline axvline semilogx semilogy loglog polar streamplot hexbin pcolor tricontour errorbar clabel set_aspect violinplot set_axis_off spines text hatch plt axis plt.bar() plt.axis import figure pyplot highlight_text pypalettes plt.subplots() xlabel ylabel title legend colorbar savefig tight_layout grid set_xlim set_ylim plot scatter hist boxplot imshow cmap alpha bins tick_params annotate quiver contour barh stackplot subplots_adjust axhline axvline semilogx semilogy loglog polar streamplot hexbin pcolor tricontour errorbar clabel set_aspect violinplot set_axis_off spines text hatch plt axis plt.bar() plt.axis import figure pyplot highlight_text pypalettes plt.subplots() xlabel ylabel title legend colorbar savefig tight_layout grid set_xlim set_ylim plot scatter hist boxplot imshow cmap alpha bins tick_params annotate quiver contour barh stackplot subplots_adjust axhline axvline semilogx semilogy loglog polar streamplot hexbin pcolor tricontour errorbar clabel set_aspect violinplot set_axis_off spines text hatch plt axis plt.bar() plt.axis import figure pyplot highlight_text pypalettes plt.subplots() xlabel ylabel title legend colorbar savefig tight_layout grid set_xlim set_ylim plot scatter hist boxplot imshow cmap alpha bins tick_params annotate quiver contour barh stackplot subplots_adjust axhline axvline semilogx semilogy loglog polar streamplot hexbin pcolor tricontour errorbar clabel set_aspect violinplot set_axis_off spines text hatch plt axis plt.bar() plt.axis import figure pyplot highlight_text pypalettes plt.subplots() xlabel ylabel title legend colorbar savefig tight_layout grid set_xlim set_ylim plot scatter hist boxplot imshow cmap alpha bins tick_params annotate quiver contour barh stackplot subplots_adjust axhline axvline semilogx semilogy loglog polar streamplot hexbin pcolor tricontour errorbar clabel set_aspect violinplot set_axis_off spines text hatch plt axis plt.bar() plt.axis import figure pyplot highlight_text pypalettes plt.subplots() xlabel ylabel title legend colorbar savefig tight_layout grid set_xlim set_ylim plot scatter hist boxplot imshow cmap alpha bins tick_params annotate quiver contour barh stackplot subplots_adjust axhline axvline semilogx semilogy loglog polar streamplot hexbin pcolor tricontour errorbar clabel set_aspect violinplot set_axis_off spines text hatch plt axis plt.bar() plt.axis import figure pyplot highlight_text pypalettes plt.subplots() xlabel ylabel title legend colorbar savefig tight_layout grid set_xlim set_ylim plot scatter hist boxplot imshow cmap alpha bins tick_params annotate quiver contour barh stackplot subplots_adjust axhline axvline semilogx semilogy loglog polar streamplot hexbin pcolor tricontour errorbar clabel set_aspect violinplot set_axis_off spines text hatch plt axis plt.bar() plt.axis import figure pyplot highlight_text pypalettes plt.subplots() xlabel ylabel title legend colorbar savefig tight_layout grid set_xlim set_ylim plot scatter hist boxplot imshow cmap alpha bins tick_params annotate quiver contour barh stackplot subplots_adjust axhline axvline semilogx semilogy loglog polar streamplot hexbin pcolor tricontour errorbar clabel set_aspect violinplot set_axis_off spines text hatch plt axis plt.bar() plt.axis import figure pyplot highlight_text pypalettes plt.subplots() xlabel ylabel title legend colorbar savefig tight_layout grid set_xlim set_ylim plot scatter hist boxplot imshow cmap alpha bins tick_params annotate quiver contour barh stackplot subplots_adjust axhline axvline semilogx semilogy loglog polar streamplot hexbin pcolor tricontour errorbar clabel set_aspect violinplot set_axis_off spines text hatch plt axis plt.bar() plt.axis import figure pyplot highlight_text pypalettes plt.subplots() xlabel ylabel title legend colorbar savefig tight_layout grid set_xlim set_ylim plot scatter hist boxplot imshow cmap alpha bins tick_params annotate quiver contour barh stackplot subplots_adjust axhline axvline semilogx semilogy loglog polar streamplot hexbin pcolor tricontour errorbar clabel set_aspect violinplot set_axis_off spines text hatch plt axis plt.bar() plt.axis import figure pyplot highlight_text pypalettes plt.subplots() xlabel ylabel title legend colorbar savefig tight_layout grid set_xlim set_ylim plot scatter hist boxplot imshow cmap alpha bins tick_params annotate quiver contour barh stackplot subplots_adjust axhline axvline semilogx semilogy loglog polar streamplot hexbin pcolor tricontour errorbar clabel set_aspect violinplot set_axis_off spines text hatch plt axis plt.bar() plt.axis import figure pyplot highlight_text pypalettes plt.subplots() xlabel ylabel title legend colorbar savefig tight_layout grid set_xlim set_ylim plot scatter hist boxplot imshow cmap alpha bins tick_params annotate quiver contour barh stackplot subplots_adjust axhline axvline semilogx semilogy loglog polar streamplot hexbin pcolor tricontour errorbar clabel set_aspect violinplot set_axis_off spines text hatch plt axis plt.bar() plt.axis import figure pyplot highlight_text pypalettes plt.subplots() xlabel ylabel title legend colorbar savefig tight_layout grid set_xlim set_ylim plot scatter hist boxplot imshow cmap alpha bins tick_params annotate quiver contour barh stackplot subplots_adjust axhline axvline semilogx semilogy loglog polar streamplot hexbin pcolor tricontour errorbar clabel set_aspect violinplot set_axis_off spines text hatch plt axis plt.bar() plt.axis import figure pyplot highlight_text pypalettes plt.subplots() xlabel ylabel title legend colorbar savefig tight_layout grid set_xlim set_ylim plot scatter hist boxplot imshow cmap alpha bins tick_params annotate quiver contour barh stackplot subplots_adjust axhline axvline semilogx semilogy loglog polar streamplot hexbin pcolor tricontour errorbar clabel set_aspect violinplot set_axis_off spines text hatch plt axis plt.bar() plt.axis import figure pyplot highlight_text pypalettes plt.subplots() xlabel ylabel title legend colorbar savefig tight_layout grid set_xlim set_ylim plot scatter hist boxplot imshow cmap alpha bins tick_params annotate quiver contour barh stackplot subplots_adjust axhline axvline semilogx semilogy loglog polar streamplot hexbin pcolor tricontour errorbar clabel set_aspect violinplot set_axis_off spines text hatch plt axis plt.bar() plt.axis import figure pyplot highlight_text pypalettes plt.subplots() xlabel ylabel title legend colorbar savefig tight_layout grid set_xlim set_ylim plot scatter hist boxplot imshow cmap alpha bins tick_params annotate quiver contour barh stackplot subplots_adjust axhline axvline semilogx semilogy loglog polar streamplot hexbin pcolor tricontour errorbar clabel set_aspect violinplot set_axis_off spines text hatch plt axis plt.bar() plt.axis import figure pyplot highlight_text pypalettes plt.subplots() xlabel ylabel title legend colorbar savefig tight_layout grid set_xlim set_ylim plot scatter hist boxplot imshow cmap alpha bins tick_params annotate quiver contour barh stackplot subplots_adjust axhline axvline semilogx semilogy loglog polar streamplot hexbin pcolor tricontour errorbar clabel set_aspect violinplot set_axis_off spines text hatch plt axis plt.bar() plt.axis import figure pyplot highlight_text pypalettes plt.subplots() xlabel ylabel title legend colorbar savefig tight_layout grid set_xlim set_ylim plot scatter hist boxplot imshow cmap alpha bins tick_params annotate quiver contour barh stackplot subplots_adjust axhline axvline semilogx semilogy loglog polar streamplot hexbin pcolor tricontour errorbar clabel set_aspect violinplot set_axis_off spines text hatch plt axis plt.bar() plt.axis import figure pyplot highlight_text pypalettes plt.subplots() xlabel ylabel title legend colorbar savefig tight_layout grid set_xlim set_ylim plot scatter hist boxplot imshow cmap alpha bins tick_params annotate quiver contour barh stackplot subplots_adjust axhline axvline semilogx semilogy loglog polar streamplot hexbin pcolor tricontour errorbar clabel set_aspect violinplot set_axis_off spines text hatch plt axis plt.bar() plt.axis import figure pyplot highlight_text pypalettes plt.subplots() xlabel ylabel title legend colorbar savefig tight_layout grid set_xlim set_ylim plot scatter hist boxplot imshow cmap alpha bins tick_params annotate quiver contour barh stackplot subplots_adjust axhline axvline semilogx semilogy loglog polar streamplot hexbin pcolor tricontour errorbar clabel set_aspect violinplot set_axis_off spines text hatch plt axis plt.bar() plt.axis import figure pyplot highlight_text pypalettes plt.subplots() xlabel ylabel title legend colorbar savefig tight_layout grid set_xlim set_ylim plot scatter hist boxplot imshow cmap alpha bins tick_params annotate quiver contour barh stackplot subplots_adjust axhline axvline semilogx semilogy loglog polar streamplot hexbin pcolor tricontour errorbar clabel set_aspect violinplot set_axis_off spines text hatch plt axis plt.bar() plt.axis import figure pyplot highlight_text pypalettes plt.subplots() xlabel ylabel title legend colorbar savefig tight_layout grid set_xlim set_ylim plot scatter hist boxplot imshow cmap alpha bins tick_params annotate quiver contour barh stackplot subplots_adjust axhline axvline semilogx semilogy loglog polar streamplot hexbin pcolor tricontour errorbar clabel set_aspect violinplot set_axis_off spines text hatch plt axis plt.bar() plt.axis import figure pyplot highlight_text pypalettes plt.subplots() xlabel ylabel title legend colorbar savefig tight_layout grid set_xlim set_ylim plot scatter hist boxplot imshow cmap alpha bins tick_params annotate quiver contour barh stackplot subplots_adjust axhline axvline semilogx semilogy loglog polar streamplot hexbin pcolor tricontour errorbar clabel set_aspect violinplot set_axis_off spines text hatch plt axis plt.bar() plt.axis import figure pyplot highlight_text pypalettes plt.subplots() xlabel ylabel title legend colorbar savefig tight_layout grid set_xlim set_ylim plot scatter hist boxplot imshow cmap alpha bins tick_params annotate quiver contour barh stackplot subplots_adjust axhline axvline semilogx semilogy loglog polar streamplot hexbin pcolor tricontour errorbar clabel set_aspect violinplot set_axis_off spines text hatch plt axis plt.bar() plt.axis import figure pyplot highlight_text pypalettes plt.subplots() xlabel ylabel title legend colorbar savefig tight_layout grid set_xlim set_ylim plot scatter hist boxplot imshow cmap alpha bins tick_params annotate quiver contour barh stackplot subplots_adjust axhline axvline semilogx semilogy loglog polar streamplot hexbin pcolor tricontour errorbar clabel set_aspect violinplot set_axis_off spines text hatch plt axis plt.bar() plt.axis import figure pyplot highlight_text pypalettes plt.subplots() xlabel ylabel title legend colorbar savefig tight_layout grid set_xlim set_ylim plot scatter hist boxplot imshow cmap alpha bins tick_params annotate quiver contour barh stackplot subplots_adjust axhline axvline semilogx semilogy loglog polar streamplot hexbin pcolor tricontour errorbar clabel set_aspect violinplot set_axis_off spines text hatch plt axis plt.bar() plt.axis import figure pyplot highlight_text pypalettes plt.subplots() xlabel ylabel title legend colorbar savefig tight_layout grid set_xlim set_ylim plot scatter hist boxplot imshow cmap alpha bins tick_params annotate quiver contour barh stackplot subplots_adjust axhline axvline semilogx semilogy loglog polar streamplot hexbin pcolor tricontour errorbar clabel set_aspect violinplot set_axis_off spines text hatch plt axis plt.bar() plt.axis import figure pyplot highlight_text pypalettes plt.subplots() xlabel ylabel title legend colorbar savefig tight_layout grid set_xlim set_ylim plot scatter hist boxplot imshow cmap alpha bins tick_params annotate quiver contour barh stackplot subplots_adjust axhline axvline semilogx semilogy loglog polar streamplot hexbin pcolor tricontour errorbar clabel set_aspect violinplot set_axis_off spines text hatch plt axis plt.bar() plt.axis import figure pyplot highlight_text pypalettes plt.subplots() xlabel ylabel title legend colorbar savefig tight_layout grid set_xlim set_ylim plot scatter hist boxplot imshow cmap alpha bins tick_params annotate quiver contour barh stackplot subplots_adjust axhline axvline semilogx semilogy loglog polar streamplot hexbin pcolor tricontour errorbar clabel set_aspect violinplot set_axis_off spines text hatch plt axis plt.bar() plt.axis import figure pyplot highlight_text pypalettes plt.subplots() xlabel ylabel title legend colorbar savefig tight_layout grid set_xlim set_ylim plot scatter hist boxplot imshow cmap alpha bins tick_params annotate quiver contour barh stackplot subplots_adjust axhline axvline semilogx semilogy loglog polar streamplot hexbin pcolor tricontour errorbar clabel set_aspect violinplot set_axis_off spines text hatch plt axis plt.bar() plt.axis import figure pyplot highlight_text pypalettes plt.subplots() xlabel ylabel title legend colorbar savefig tight_layout grid set_xlim set_ylim plot scatter hist boxplot imshow cmap alpha bins tick_params annotate quiver contour barh stackplot subplots_adjust axhline axvline semilogx semilogy loglog polar streamplot hexbin pcolor tricontour errorbar clabel set_aspect violinplot set_axis_off spines text hatch plt axis plt.bar() plt.axis import figure pyplot highlight_text pypalettes plt.subplots() xlabel ylabel title legend colorbar savefig tight_layout grid set_xlim set_ylim plot scatter hist boxplot imshow cmap alpha bins tick_params annotate quiver contour barh stackplot subplots_adjust axhline axvline semilogx semilogy loglog polar streamplot hexbin pcolor tricontour errorbar clabel set_aspect violinplot set_axis_off spines text hatch plt axis plt.bar() plt.axis import figure pyplot highlight_text pypalettes plt.subplots() xlabel ylabel title legend colorbar savefig tight_layout grid set_xlim set_ylim plot scatter hist boxplot imshow cmap alpha bins tick_params annotate quiver contour barh stackplot subplots_adjust axhline axvline semilogx semilogy loglog polar streamplot hexbin pcolor tricontour errorbar clabel set_aspect violinplot set_axis_off spines text hatch plt axis plt.bar() plt.axis import figure pyplot highlight_text pypalettes plt.subplots() xlabel ylabel title legend colorbar savefig tight_layout grid set_xlim set_ylim plot scatter hist boxplot imshow cmap alpha bins tick_params annotate quiver contour barh stackplot subplots_adjust axhline axvline semilogx semilogy loglog polar streamplot hexbin pcolor tricontour errorbar clabel set_aspect violinplot set_axis_off spines text hatch plt axis plt.bar() plt.axis import figure pyplot highlight_text pypalettes plt.subplots() xlabel ylabel title legend colorbar savefig tight_layout grid set_xlim set_ylim plot scatter hist boxplot imshow cmap alpha bins tick_params annotate quiver contour barh stackplot subplots_adjust axhline axvline semilogx semilogy loglog polar streamplot hexbin pcolor tricontour errorbar clabel set_aspect violinplot set_axis_off spines text hatch plt axis plt.bar() plt.axis import figure pyplot highlight_text pypalettes plt.subplots() xlabel ylabel title legend colorbar savefig tight_layout grid set_xlim set_ylim plot scatter hist boxplot imshow cmap alpha bins tick_params annotate quiver contour barh stackplot subplots_adjust axhline axvline semilogx semilogy loglog polar streamplot hexbin pcolor tricontour errorbar clabel set_aspect violinplot set_axis_off spines text hatch plt axis plt.bar() plt.axis import figure pyplot highlight_text pypalettes plt.subplots() xlabel ylabel title legend colorbar savefig tight_layout grid set_xlim set_ylim plot scatter hist boxplot imshow cmap alpha bins tick_params annotate quiver contour barh stackplot subplots_adjust axhline axvline semilogx semilogy loglog polar streamplot hexbin pcolor tricontour errorbar clabel set_aspect violinplot set_axis_off spines text hatch plt axis plt.bar() plt.axis import figure pyplot highlight_text pypalettes plt.subplots() xlabel ylabel title legend colorbar savefig tight_layout grid set_xlim set_ylim plot scatter hist boxplot imshow cmap alpha bins tick_params annotate quiver contour barh stackplot subplots_adjust axhline axvline semilogx semilogy loglog polar streamplot hexbin pcolor tricontour errorbar clabel set_aspect violinplot set_axis_off spines text hatch plt axis plt.bar() plt.axis import figure pyplot highlight_text pypalettes plt.subplots() xlabel ylabel title legend colorbar savefig tight_layout grid set_xlim set_ylim plot scatter hist boxplot imshow cmap alpha bins tick_params annotate quiver contour barh stackplot subplots_adjust axhline axvline semilogx semilogy loglog polar streamplot hexbin pcolor tricontour errorbar clabel set_aspect violinplot set_axis_off spines text hatch plt axis plt.bar() plt.axis import figure pyplot highlight_text pypalettes plt.subplots() xlabel ylabel title legend colorbar savefig tight_layout grid set_xlim set_ylim plot scatter hist boxplot imshow cmap alpha bins tick_params annotate quiver contour barh stackplot subplots_adjust axhline axvline semilogx semilogy loglog polar streamplot hexbin pcolor tricontour errorbar clabel set_aspect violinplot set_axis_off spines text hatch plt axis plt.bar() plt.axis import figure pyplot highlight_text pypalettes plt.subplots() xlabel ylabel title legend colorbar savefig tight_layout grid set_xlim set_ylim plot scatter hist boxplot imshow cmap alpha bins tick_params annotate quiver contour barh stackplot subplots_adjust axhline axvline semilogx semilogy loglog polar streamplot hexbin pcolor tricontour errorbar clabel set_aspect violinplot set_axis_off spines text hatch plt axis plt.bar() plt.axis import figure pyplot highlight_text pypalettes plt.subplots() xlabel ylabel title legend colorbar savefig tight_layout grid set_xlim set_ylim plot scatter hist boxplot imshow cmap alpha bins tick_params annotate quiver contour barh stackplot subplots_adjust axhline axvline semilogx semilogy loglog polar streamplot hexbin pcolor tricontour errorbar clabel set_aspect violinplot set_axis_off spines text hatch plt axis plt.bar() plt.axis import figure pyplot highlight_text pypalettes plt.subplots() xlabel ylabel title legend colorbar savefig tight_layout grid set_xlim set_ylim plot scatter hist boxplot imshow cmap alpha bins tick_params annotate quiver contour barh stackplot subplots_adjust axhline axvline semilogx semilogy loglog polar streamplot hexbin pcolor tricontour errorbar clabel set_aspect violinplot set_axis_off spines text hatch plt axis plt.bar() plt.axis import figure pyplot highlight_text pypalettes plt.subplots() xlabel ylabel title legend colorbar savefig tight_layout grid set_xlim set_ylim plot scatter hist boxplot imshow cmap alpha bins tick_params annotate quiver contour barh stackplot subplots_adjust axhline axvline semilogx semilogy loglog polar streamplot hexbin pcolor tricontour errorbar clabel set_aspect violinplot set_axis_off spines text hatch plt axis plt.bar() plt.axis import figure pyplot highlight_text pypalettes plt.subplots() xlabel ylabel title legend colorbar savefig tight_layout grid set_xlim set_ylim plot scatter hist boxplot imshow cmap alpha bins tick_params annotate quiver contour barh stackplot subplots_adjust axhline axvline semilogx semilogy loglog polar streamplot hexbin pcolor tricontour errorbar clabel set_aspect violinplot set_axis_off spines text hatch plt axis plt.bar() plt.axis import figure pyplot highlight_text pypalettes plt.subplots() xlabel ylabel title legend colorbar savefig tight_layout grid set_xlim set_ylim plot scatter hist boxplot imshow cmap alpha bins tick_params annotate quiver contour barh stackplot subplots_adjust axhline axvline semilogx semilogy loglog polar streamplot hexbin pcolor tricontour errorbar clabel set_aspect violinplot set_axis_off spines text hatch plt axis plt.bar() plt.axis import figure pyplot highlight_text pypalettes plt.subplots() xlabel ylabel title legend colorbar savefig tight_layout grid set_xlim set_ylim plot scatter hist boxplot imshow cmap alpha bins tick_params annotate quiver contour barh stackplot subplots_adjust axhline axvline semilogx semilogy loglog polar streamplot hexbin pcolor tricontour errorbar clabel set_aspect violinplot set_axis_off spines text hatch plt axis plt.bar() plt.axis import figure pyplot highlight_text pypalettes plt.subplots() xlabel ylabel title legend colorbar savefig tight_layout grid set_xlim set_ylim plot scatter hist boxplot imshow cmap alpha bins tick_params annotate quiver contour barh stackplot subplots_adjust axhline axvline semilogx semilogy loglog polar streamplot hexbin pcolor tricontour errorbar clabel set_aspect violinplot set_axis_off spines text hatch plt axis plt.bar() plt.axis import figure pyplot highlight_text pypalettes plt.subplots() xlabel ylabel title legend colorbar savefig tight_layout grid set_xlim set_ylim plot scatter hist boxplot imshow cmap alpha bins tick_params annotate quiver contour barh stackplot subplots_adjust axhline axvline semilogx semilogy loglog polar streamplot hexbin pcolor tricontour errorbar clabel set_aspect violinplot set_axis_off spines text hatch plt axis plt.bar() plt.axis import figure pyplot highlight_text pypalettes plt.subplots() xlabel ylabel title legend colorbar savefig tight_layout grid set_xlim set_ylim plot scatter hist boxplot imshow cmap alpha bins tick_params annotate quiver contour barh stackplot subplots_adjust axhline axvline semilogx semilogy loglog polar streamplot hexbin pcolor tricontour errorbar clabel set_aspect violinplot set_axis_off spines text hatch plt axis plt.bar() plt.axis import figure pyplot highlight_text pypalettes plt.subplots() xlabel ylabel title legend colorbar savefig tight_layout grid set_xlim set_ylim plot scatter hist boxplot imshow cmap alpha bins tick_params annotate quiver contour barh stackplot subplots_adjust axhline axvline semilogx semilogy loglog polar streamplot hexbin pcolor tricontour errorbar clabel set_aspect violinplot set_axis_off spines text hatch plt axis plt.bar() plt.axis import figure pyplot highlight_text pypalettes plt.subplots() xlabel ylabel title legend colorbar savefig tight_layout grid set_xlim set_ylim plot scatter hist boxplot imshow cmap alpha bins tick_params annotate quiver contour barh stackplot subplots_adjust axhline axvline semilogx semilogy loglog polar streamplot hexbin pcolor tricontour errorbar clabel set_aspect violinplot set_axis_off spines text hatch plt axis plt.bar() plt.axis import figure pyplot highlight_text pypalettes plt.subplots() xlabel ylabel title legend colorbar savefig tight_layout grid set_xlim set_ylim plot scatter hist boxplot imshow cmap alpha bins tick_params annotate quiver contour barh stackplot subplots_adjust axhline axvline semilogx semilogy loglog polar streamplot hexbin pcolor tricontour errorbar clabel set_aspect violinplot set_axis_off spines text hatch plt axis plt.bar() plt.axis import figure pyplot highlight_text pypalettes plt.subplots() xlabel ylabel title legend colorbar savefig tight_layout grid set_xlim set_ylim plot scatter hist boxplot imshow cmap alpha bins tick_params annotate quiver contour barh stackplot subplots_adjust axhline axvline semilogx semilogy loglog polar streamplot hexbin pcolor tricontour errorbar clabel set_aspect violinplot set_axis_off spines text hatch plt axis plt.bar() plt.axis import figure pyplot highlight_text pypalettes plt.subplots() xlabel ylabel title legend colorbar savefig tight_layout grid set_xlim set_ylim plot scatter hist boxplot imshow cmap alpha bins tick_params annotate quiver contour barh stackplot subplots_adjust axhline axvline semilogx semilogy loglog polar streamplot hexbin pcolor tricontour errorbar clabel set_aspect violinplot set_axis_off spines text hatch plt axis plt.bar() plt.axis import figure pyplot highlight_text pypalettes plt.subplots() xlabel ylabel title legend colorbar savefig tight_layout grid set_xlim set_ylim plot scatter hist boxplot imshow cmap alpha bins tick_params annotate quiver contour barh stackplot subplots_adjust axhline axvline semilogx semilogy loglog polar streamplot hexbin pcolor tricontour errorbar clabel set_aspect violinplot set_axis_off spines text hatch plt axis plt.bar() plt.axis import figure pyplot highlight_text pypalettes plt.subplots() xlabel ylabel title legend colorbar savefig tight_layout grid set_xlim set_ylim plot scatter hist boxplot imshow cmap alpha bins tick_params annotate quiver contour barh stackplot subplots_adjust axhline axvline semilogx semilogy loglog polar streamplot hexbin pcolor tricontour errorbar clabel set_aspect violinplot set_axis_off spines text hatch plt axis plt.bar() plt.axis import figure pyplot highlight_text pypalettes plt.subplots() xlabel ylabel title legend colorbar savefig tight_layout grid set_xlim set_ylim plot scatter hist boxplot imshow cmap alpha bins tick_params annotate quiver contour barh stackplot subplots_adjust axhline axvline semilogx semilogy loglog polar streamplot hexbin pcolor tricontour errorbar clabel set_aspect violinplot set_axis_off spines text hatch plt axis plt.bar() plt.axis import figure pyplot highlight_text pypalettes plt.subplots() xlabel ylabel title legend colorbar savefig tight_layout grid set_xlim set_ylim plot scatter hist boxplot imshow cmap alpha bins tick_params annotate quiver contour barh stackplot subplots_adjust axhline axvline semilogx semilogy loglog polar streamplot hexbin pcolor tricontour errorbar clabel set_aspect violinplot set_axis_off spines text hatch plt axis plt.bar() plt.axis import figure pyplot highlight_text pypalettes plt.subplots() xlabel ylabel title legend colorbar savefig tight_layout grid set_xlim set_ylim plot scatter hist boxplot imshow cmap alpha bins tick_params annotate quiver contour barh stackplot subplots_adjust axhline axvline semilogx semilogy loglog polar streamplot hexbin pcolor tricontour errorbar clabel set_aspect violinplot set_axis_off spines text hatch plt axis plt.bar() plt.axis import figure pyplot highlight_text pypalettes plt.subplots() xlabel ylabel title legend colorbar savefig tight_layout grid set_xlim set_ylim plot scatter hist boxplot imshow cmap alpha bins tick_params annotate quiver contour barh stackplot subplots_adjust axhline axvline semilogx semilogy loglog polar streamplot hexbin pcolor tricontour errorbar clabel set_aspect violinplot set_axis_off spines text hatch plt axis plt.bar() plt.axis import figure pyplot highlight_text pypalettes plt.subplots() xlabel ylabel title legend colorbar savefig tight_layout grid set_xlim set_ylim plot scatter hist boxplot imshow cmap alpha bins tick_params annotate quiver contour barh stackplot subplots_adjust axhline axvline semilogx semilogy loglog polar streamplot hexbin pcolor tricontour errorbar clabel set_aspect violinplot set_axis_off spines text hatch plt axis plt.bar() plt.axis import figure pyplot highlight_text pypalettes plt.subplots() xlabel ylabel title legend colorbar savefig tight_layout grid set_xlim set_ylim plot scatter hist boxplot imshow cmap alpha bins tick_params annotate quiver contour barh stackplot subplots_adjust axhline axvline semilogx semilogy loglog polar streamplot hexbin pcolor tricontour errorbar clabel set_aspect violinplot set_axis_off spines text hatch plt axis plt.bar() plt.axis import figure pyplot highlight_text pypalettes plt.subplots() xlabel ylabel title legend colorbar savefig tight_layout grid set_xlim set_ylim plot scatter hist boxplot imshow cmap alpha bins tick_params annotate quiver contour barh stackplot subplots_adjust axhline axvline semilogx semilogy loglog polar streamplot hexbin pcolor tricontour errorbar clabel set_aspect violinplot set_axis_off spines text hatch plt axis plt.bar() plt.axis import figure pyplot highlight_text pypalettes plt.subplots() xlabel ylabel title legend colorbar savefig tight_layout grid set_xlim set_ylim plot scatter hist boxplot imshow cmap alpha bins tick_params annotate quiver contour barh stackplot subplots_adjust axhline axvline semilogx semilogy loglog polar streamplot hexbin pcolor tricontour errorbar clabel set_aspect violinplot set_axis_off spines text hatch plt axis plt.bar() plt.axis import figure pyplot highlight_text pypalettes plt.subplots() xlabel ylabel title legend colorbar savefig tight_layout grid set_xlim set_ylim plot scatter hist boxplot imshow cmap alpha bins tick_params annotate quiver contour barh stackplot subplots_adjust axhline axvline semilogx semilogy loglog polar streamplot hexbin pcolor tricontour errorbar clabel set_aspect violinplot set_axis_off spines text hatch plt axis plt.bar() plt.axis import figure pyplot highlight_text pypalettes plt.subplots() xlabel ylabel title legend colorbar savefig tight_layout grid set_xlim set_ylim plot scatter hist boxplot imshow cmap alpha bins tick_params annotate quiver contour barh stackplot subplots_adjust axhline axvline semilogx semilogy loglog polar streamplot hexbin pcolor tricontour errorbar clabel set_aspect violinplot set_axis_off spines text hatch plt axis plt.bar() plt.axis import figure pyplot highlight_text pypalettes plt.subplots() xlabel ylabel title legend colorbar savefig tight_layout grid set_xlim set_ylim plot scatter hist boxplot imshow cmap alpha bins tick_params annotate quiver contour barh stackplot subplots_adjust axhline axvline semilogx semilogy loglog polar streamplot hexbin pcolor tricontour errorbar clabel set_aspect violinplot set_axis_off spines text hatch plt axis plt.bar() plt.axis import figure pyplot highlight_text pypalettes plt.subplots() xlabel ylabel title legend colorbar savefig tight_layout grid set_xlim set_ylim plot scatter hist boxplot imshow cmap alpha bins tick_params annotate quiver contour barh stackplot subplots_adjust axhline axvline semilogx semilogy loglog polar streamplot hexbin pcolor tricontour errorbar clabel set_aspect violinplot set_axis_off spines text hatch plt axis plt.bar() plt.axis import figure pyplot highlight_text pypalettes plt.subplots() xlabel ylabel title legend colorbar savefig tight_layout grid set_xlim set_ylim plot scatter hist boxplot imshow cmap alpha bins tick_params annotate quiver contour barh stackplot subplots_adjust axhline axvline semilogx semilogy loglog polar streamplot hexbin pcolor tricontour errorbar clabel set_aspect violinplot set_axis_off spines text hatch plt axis plt.bar() plt.axis import figure pyplot highlight_text pypalettes plt.subplots() xlabel ylabel title legend colorbar savefig tight_layout grid set_xlim set_ylim plot scatter hist boxplot imshow cmap alpha bins tick_params annotate quiver contour barh stackplot subplots_adjust axhline axvline semilogx semilogy loglog polar streamplot hexbin pcolor tricontour errorbar clabel set_aspect violinplot set_axis_off spines text hatch plt axis plt.bar() plt.axis import figure pyplot highlight_text pypalettes plt.subplots() xlabel ylabel title legend colorbar savefig tight_layout grid set_xlim set_ylim plot scatter hist boxplot imshow cmap alpha bins tick_params annotate quiver contour barh stackplot subplots_adjust axhline axvline semilogx semilogy loglog polar streamplot hexbin pcolor tricontour errorbar clabel set_aspect violinplot set_axis_off spines text hatch plt axis plt.bar() plt.axis import figure pyplot highlight_text pypalettes plt.subplots() xlabel ylabel title legend colorbar savefig tight_layout grid set_xlim set_ylim plot scatter hist boxplot imshow cmap alpha bins tick_params annotate quiver contour barh stackplot subplots_adjust axhline axvline semilogx semilogy loglog polar streamplot hexbin pcolor tricontour errorbar clabel set_aspect violinplot set_axis_off spines text hatch plt axis plt.bar() plt.axis import figure pyplot highlight_text pypalettes plt.subplots() xlabel ylabel title legend colorbar savefig tight_layout grid set_xlim set_ylim plot scatter hist boxplot imshow cmap alpha bins tick_params annotate quiver contour barh stackplot subplots_adjust axhline axvline semilogx semilogy loglog polar streamplot hexbin pcolor tricontour errorbar clabel set_aspect violinplot set_axis_off spines text hatch plt axis plt.bar() plt.axis import figure pyplot highlight_text pypalettes plt.subplots() xlabel ylabel title legend colorbar savefig tight_layout grid set_xlim set_ylim plot scatter hist boxplot imshow cmap alpha bins tick_params annotate quiver contour barh stackplot subplots_adjust axhline axvline semilogx semilogy loglog polar streamplot hexbin pcolor tricontour errorbar clabel set_aspect violinplot set_axis_off spines text hatch plt axis plt.bar() plt.axis import figure pyplot highlight_text pypalettes plt.subplots() xlabel ylabel title legend colorbar savefig tight_layout grid set_xlim set_ylim plot scatter hist boxplot imshow cmap alpha bins tick_params annotate quiver contour barh stackplot subplots_adjust axhline axvline semilogx semilogy loglog polar streamplot hexbin pcolor tricontour errorbar clabel set_aspect violinplot set_axis_off spines text hatch plt axis plt.bar() plt.axis import figure pyplot highlight_text pypalettes plt.subplots() xlabel ylabel title legend colorbar savefig tight_layout grid set_xlim set_ylim plot scatter hist boxplot imshow cmap alpha bins tick_params annotate quiver contour barh stackplot subplots_adjust axhline axvline semilogx semilogy loglog polar streamplot hexbin pcolor tricontour errorbar clabel set_aspect violinplot set_axis_off spines text hatch plt axis plt.bar() plt.axis import figure pyplot highlight_text pypalettes plt.subplots() xlabel ylabel title legend colorbar savefig tight_layout grid set_xlim set_ylim plot scatter hist boxplot imshow cmap alpha bins tick_params annotate quiver contour barh stackplot subplots_adjust axhline axvline semilogx semilogy loglog polar streamplot hexbin pcolor tricontour errorbar clabel set_aspect violinplot set_axis_off spines text hatch plt axis plt.bar() plt.axis import figure pyplot highlight_text pypalettes plt.subplots() xlabel ylabel title legend colorbar savefig tight_layout grid set_xlim set_ylim plot scatter hist boxplot imshow cmap alpha bins tick_params annotate quiver contour barh stackplot subplots_adjust axhline axvline semilogx semilogy loglog polar streamplot hexbin pcolor tricontour errorbar clabel set_aspect violinplot set_axis_off spines text hatch plt axis plt.bar() plt.axis import figure pyplot highlight_text pypalettes plt.subplots() xlabel ylabel title legend colorbar savefig tight_layout grid set_xlim set_ylim plot scatter hist boxplot imshow cmap alpha bins tick_params annotate quiver contour barh stackplot subplots_adjust axhline axvline semilogx semilogy loglog polar streamplot hexbin pcolor tricontour errorbar clabel set_aspect violinplot set_axis_off spines text hatch plt axis plt.bar() plt.axis import figure pyplot highlight_text pypalettes plt.subplots() xlabel ylabel title legend colorbar savefig tight_layout grid set_xlim set_ylim plot scatter hist boxplot imshow cmap alpha bins tick_params annotate quiver contour barh stackplot subplots_adjust axhline axvline semilogx semilogy loglog polar streamplot hexbin pcolor tricontour errorbar clabel set_aspect violinplot set_axis_off spines text hatch plt axis plt.bar() plt.axis import figure pyplot highlight_text pypalettes plt.subplots() xlabel ylabel title legend colorbar savefig tight_layout grid set_xlim set_ylim plot scatter hist boxplot imshow cmap alpha bins tick_params annotate quiver contour barh stackplot subplots_adjust axhline axvline semilogx semilogy loglog polar streamplot hexbin pcolor tricontour errorbar clabel set_aspect violinplot set_axis_off spines text hatch plt axis plt.bar() plt.axis import figure pyplot highlight_text pypalettes plt.subplots() xlabel ylabel title legend colorbar savefig tight_layout grid set_xlim set_ylim plot scatter hist boxplot imshow cmap alpha bins tick_params annotate quiver contour barh stackplot subplots_adjust axhline axvline semilogx semilogy loglog polar streamplot hexbin pcolor tricontour errorbar clabel set_aspect violinplot set_axis_off spines text hatch plt axis plt.bar() plt.axis import figure pyplot highlight_text pypalettes plt.subplots() xlabel ylabel title legend colorbar savefig tight_layout grid set_xlim set_ylim plot scatter hist boxplot imshow cmap alpha bins tick_params annotate quiver contour barh stackplot subplots_adjust axhline axvline semilogx semilogy loglog polar streamplot hexbin pcolor tricontour errorbar clabel set_aspect violinplot set_axis_off spines text hatch plt axis plt.bar() plt.axis import figure pyplot highlight_text pypalettes plt.subplots() xlabel ylabel title legend colorbar savefig tight_layout grid set_xlim set_ylim plot scatter hist boxplot imshow cmap alpha bins tick_params annotate quiver contour barh stackplot subplots_adjust axhline axvline semilogx semilogy loglog polar streamplot hexbin pcolor tricontour errorbar clabel set_aspect violinplot set_axis_off spines text hatch plt axis plt.bar() plt.axis import figure pyplot highlight_text pypalettes plt.subplots() xlabel ylabel title legend colorbar savefig tight_layout grid set_xlim set_ylim plot scatter hist boxplot imshow cmap alpha bins tick_params annotate quiver contour barh stackplot subplots_adjust axhline axvline semilogx semilogy loglog polar streamplot hexbin pcolor tricontour errorbar clabel set_aspect violinplot set_axis_off spines text hatch plt axis plt.bar() plt.axis import figure pyplot highlight_text pypalettes plt.subplots() xlabel ylabel title legend colorbar savefig tight_layout grid set_xlim set_ylim plot scatter hist boxplot imshow cmap alpha bins tick_params annotate quiver contour barh stackplot subplots_adjust axhline axvline semilogx semilogy loglog polar streamplot hexbin pcolor tricontour errorbar clabel set_aspect violinplot set_axis_off spines text hatch plt axis plt.bar() plt.axis import figure pyplot highlight_text pypalettes plt.subplots() xlabel ylabel title legend colorbar savefig tight_layout grid set_xlim set_ylim plot scatter hist boxplot imshow cmap alpha bins tick_params annotate quiver contour barh stackplot subplots_adjust axhline axvline semilogx semilogy loglog polar streamplot hexbin pcolor tricontour errorbar clabel set_aspect violinplot set_axis_off spines text hatch plt axis plt.bar() plt.axis import figure pyplot highlight_text pypalettes plt.subplots() xlabel ylabel title legend colorbar savefig tight_layout grid set_xlim set_ylim plot scatter hist boxplot imshow cmap alpha bins tick_params annotate quiver contour barh stackplot subplots_adjust axhline axvline semilogx semilogy loglog polar streamplot hexbin pcolor tricontour errorbar clabel set_aspect violinplot set_axis_off spines text hatch plt axis plt.bar() plt.axis import figure pyplot highlight_text pypalettes plt.subplots() xlabel ylabel title legend colorbar savefig tight_layout grid set_xlim set_ylim plot scatter hist boxplot imshow cmap alpha bins tick_params annotate quiver contour barh stackplot subplots_adjust axhline axvline semilogx semilogy loglog polar streamplot hexbin pcolor tricontour errorbar clabel set_aspect violinplot set_axis_off spines text hatch plt axis plt.bar() plt.axis import figure pyplot highlight_text pypalettes plt.subplots() xlabel ylabel title legend colorbar savefig tight_layout grid set_xlim set_ylim plot scatter hist boxplot imshow cmap alpha bins tick_params annotate quiver contour barh stackplot subplots_adjust axhline axvline semilogx semilogy loglog polar streamplot hexbin pcolor tricontour errorbar clabel set_aspect violinplot set_axis_off spines text hatch plt axis plt.bar() plt.axis import figure pyplot highlight_text pypalettes plt.subplots() xlabel ylabel title legend colorbar savefig tight_layout grid set_xlim set_ylim plot scatter hist boxplot imshow cmap alpha bins tick_params annotate quiver contour barh stackplot subplots_adjust axhline axvline semilogx semilogy loglog polar streamplot hexbin pcolor tricontour errorbar clabel set_aspect violinplot set_axis_off spines text hatch plt axis plt.bar() plt.axis import figure pyplot highlight_text pypalettes plt.subplots() xlabel ylabel title legend colorbar savefig tight_layout grid set_xlim set_ylim plot scatter hist boxplot imshow cmap alpha bins tick_params annotate quiver contour barh stackplot subplots_adjust axhline axvline semilogx semilogy loglog polar streamplot hexbin pcolor tricontour errorbar clabel set_aspect violinplot set_axis_off spines text hatch plt axis plt.bar() plt.axis import figure pyplot highlight_text pypalettes plt.subplots() xlabel ylabel title legend colorbar savefig tight_layout grid set_xlim set_ylim plot scatter hist boxplot imshow cmap alpha bins tick_params annotate quiver contour barh stackplot subplots_adjust axhline axvline semilogx semilogy loglog polar streamplot hexbin pcolor tricontour errorbar clabel set_aspect violinplot set_axis_off spines text hatch plt axis plt.bar() plt.axis import figure pyplot highlight_text pypalettes plt.subplots() xlabel ylabel title legend colorbar savefig tight_layout grid set_xlim set_ylim plot scatter hist boxplot imshow cmap alpha bins tick_params annotate quiver contour barh stackplot subplots_adjust axhline axvline semilogx semilogy loglog polar streamplot hexbin pcolor tricontour errorbar clabel set_aspect violinplot set_axis_off spines text hatch plt axis plt.bar() plt.axis import figure pyplot highlight_text pypalettes plt.subplots() xlabel ylabel title legend colorbar savefig tight_layout grid set_xlim set_ylim plot scatter hist boxplot imshow cmap alpha bins tick_params annotate quiver contour barh stackplot subplots_adjust axhline axvline semilogx semilogy loglog polar streamplot hexbin pcolor tricontour errorbar clabel set_aspect violinplot set_axis_off spines text hatch plt axis plt.bar() plt.axis import figure pyplot highlight_text pypalettes plt.subplots() xlabel ylabel title legend colorbar savefig tight_layout grid set_xlim set_ylim plot scatter hist boxplot imshow cmap alpha bins tick_params annotate quiver contour barh stackplot subplots_adjust axhline axvline semilogx semilogy loglog polar streamplot hexbin pcolor tricontour errorbar clabel set_aspect violinplot set_axis_off spines text hatch plt axis plt.bar() plt.axis import figure pyplot highlight_text pypalettes plt.subplots() xlabel ylabel title legend colorbar savefig tight_layout grid set_xlim set_ylim plot scatter hist boxplot imshow cmap alpha bins tick_params annotate quiver contour barh stackplot subplots_adjust axhline axvline semilogx semilogy loglog polar streamplot hexbin pcolor tricontour errorbar clabel set_aspect violinplot set_axis_off spines text hatch plt axis plt.bar() plt.axis import figure pyplot highlight_text pypalettes plt.subplots() xlabel ylabel title legend colorbar savefig tight_layout grid set_xlim set_ylim plot scatter hist boxplot imshow cmap alpha bins tick_params annotate quiver contour barh stackplot subplots_adjust axhline axvline semilogx semilogy loglog polar streamplot hexbin pcolor tricontour errorbar clabel set_aspect violinplot set_axis_off spines text hatch plt axis plt.bar() plt.axis import figure pyplot highlight_text pypalettes plt.subplots() xlabel ylabel title legend colorbar savefig tight_layout grid set_xlim set_ylim plot scatter hist boxplot imshow cmap alpha bins tick_params annotate quiver contour barh stackplot subplots_adjust axhline axvline semilogx semilogy loglog polar streamplot hexbin pcolor tricontour errorbar clabel set_aspect violinplot set_axis_off spines text hatch plt axis plt.bar() plt.axis import figure pyplot highlight_text pypalettes plt.subplots() xlabel ylabel title legend colorbar savefig tight_layout grid set_xlim set_ylim plot scatter hist boxplot imshow cmap alpha bins tick_params annotate quiver contour barh stackplot subplots_adjust axhline axvline semilogx semilogy loglog polar streamplot hexbin pcolor tricontour errorbar clabel set_aspect violinplot set_axis_off spines text hatch plt axis plt.bar() plt.axis import figure pyplot highlight_text pypalettes plt.subplots() xlabel ylabel title legend colorbar savefig tight_layout grid set_xlim set_ylim plot scatter hist boxplot imshow cmap alpha bins tick_params annotate quiver contour barh stackplot subplots_adjust axhline axvline semilogx semilogy loglog polar streamplot hexbin pcolor tricontour errorbar clabel set_aspect violinplot set_axis_off spines text hatch plt axis plt.bar() plt.axis import figure pyplot highlight_text pypalettes plt.subplots() xlabel ylabel title legend colorbar savefig tight_layout grid set_xlim set_ylim plot scatter hist boxplot imshow cmap alpha bins tick_params annotate quiver contour barh stackplot subplots_adjust axhline axvline semilogx semilogy loglog polar streamplot hexbin pcolor tricontour errorbar clabel set_aspect violinplot set_axis_off spines text hatch plt axis plt.bar() plt.axis import figure pyplot highlight_text pypalettes plt.subplots() xlabel ylabel title legend colorbar savefig tight_layout grid set_xlim set_ylim plot scatter hist boxplot imshow cmap alpha bins tick_params annotate quiver contour barh stackplot subplots_adjust axhline axvline semilogx semilogy loglog polar streamplot hexbin pcolor tricontour errorbar clabel set_aspect violinplot set_axis_off spines text hatch plt axis plt.bar() plt.axis import figure pyplot highlight_text pypalettes plt.subplots() xlabel ylabel title legend colorbar savefig tight_layout grid set_xlim set_ylim plot scatter hist boxplot imshow cmap alpha bins tick_params annotate quiver contour barh stackplot subplots_adjust axhline axvline semilogx semilogy loglog polar streamplot hexbin pcolor tricontour errorbar clabel set_aspect violinplot set_axis_off spines text hatch plt axis plt.bar() plt.axis import figure pyplot highlight_text pypalettes plt.subplots() xlabel ylabel title legend colorbar savefig tight_layout grid set_xlim set_ylim plot scatter hist boxplot imshow cmap alpha bins tick_params annotate quiver contour barh stackplot subplots_adjust axhline axvline semilogx semilogy loglog polar streamplot hexbin pcolor tricontour errorbar clabel set_aspect violinplot set_axis_off spines text hatch plt axis plt.bar() plt.axis import figure pyplot highlight_text pypalettes plt.subplots() xlabel ylabel title legend colorbar savefig tight_layout grid set_xlim set_ylim plot scatter hist boxplot imshow cmap alpha bins tick_params annotate quiver contour barh stackplot subplots_adjust axhline axvline semilogx semilogy loglog polar streamplot hexbin pcolor tricontour errorbar clabel set_aspect violinplot set_axis_off spines text hatch plt axis plt.bar() plt.axis import figure pyplot highlight_text pypalettes plt.subplots() xlabel ylabel title legend colorbar savefig tight_layout grid set_xlim set_ylim plot scatter hist boxplot imshow cmap alpha bins tick_params annotate quiver contour barh stackplot subplots_adjust axhline axvline semilogx semilogy loglog polar streamplot hexbin pcolor tricontour errorbar clabel set_aspect violinplot set_axis_off spines text hatch plt axis plt.bar() plt.axis import figure pyplot highlight_text pypalettes plt.subplots() xlabel ylabel title legend colorbar savefig tight_layout grid set_xlim set_ylim plot scatter hist boxplot imshow cmap alpha bins tick_params annotate quiver contour barh stackplot subplots_adjust axhline axvline semilogx semilogy loglog polar streamplot hexbin pcolor tricontour errorbar clabel set_aspect violinplot set_axis_off spines text hatch plt axis plt.bar() plt.axis import figure pyplot highlight_text pypalettes plt.subplots() xlabel ylabel title legend colorbar savefig tight_layout grid set_xlim set_ylim plot scatter hist boxplot imshow cmap alpha bins tick_params annotate quiver contour barh stackplot subplots_adjust axhline axvline semilogx semilogy loglog polar streamplot hexbin pcolor tricontour errorbar clabel set_aspect violinplot set_axis_off spines text hatch plt axis plt.bar() plt.axis import figure pyplot highlight_text pypalettes plt.subplots() xlabel ylabel title legend colorbar savefig tight_layout grid set_xlim set_ylim plot scatter hist boxplot imshow cmap alpha bins tick_params annotate quiver contour barh stackplot subplots_adjust axhline axvline semilogx semilogy loglog polar streamplot hexbin pcolor tricontour errorbar clabel set_aspect violinplot set_axis_off spines text hatch plt axis plt.bar() plt.axis import figure pyplot highlight_text pypalettes plt.subplots() xlabel ylabel title legend colorbar savefig tight_layout grid set_xlim set_ylim plot scatter hist boxplot imshow cmap alpha bins tick_params annotate quiver contour barh stackplot subplots_adjust axhline axvline semilogx semilogy loglog polar streamplot hexbin pcolor tricontour errorbar clabel set_aspect violinplot set_axis_off spines text hatch plt axis plt.bar() plt.axis import figure pyplot highlight_text pypalettes plt.subplots() xlabel ylabel title legend colorbar savefig tight_layout grid set_xlim set_ylim plot scatter hist boxplot imshow cmap alpha bins tick_params annotate quiver contour barh stackplot subplots_adjust axhline axvline semilogx semilogy loglog polar streamplot hexbin pcolor tricontour errorbar clabel set_aspect violinplot set_axis_off spines text hatch plt axis plt.bar() plt.axis import figure pyplot highlight_text pypalettes plt.subplots() xlabel ylabel title legend colorbar savefig tight_layout grid set_xlim set_ylim plot scatter hist boxplot imshow cmap alpha bins tick_params annotate quiver contour barh stackplot subplots_adjust axhline axvline semilogx semilogy loglog polar streamplot hexbin pcolor tricontour errorbar clabel set_aspect violinplot set_axis_off spines text hatch plt axis plt.bar() plt.axis import figure pyplot highlight_text pypalettes plt.subplots() xlabel ylabel title legend colorbar savefig tight_layout grid set_xlim set_ylim plot scatter hist boxplot imshow cmap alpha bins tick_params annotate quiver contour barh stackplot subplots_adjust axhline axvline semilogx semilogy loglog polar streamplot hexbin pcolor tricontour errorbar clabel set_aspect violinplot set_axis_off spines text hatch plt axis plt.bar() plt.axis import figure pyplot highlight_text pypalettes plt.subplots() xlabel ylabel title legend colorbar savefig tight_layout grid set_xlim set_ylim plot scatter hist boxplot imshow cmap alpha bins tick_params annotate quiver contour barh stackplot subplots_adjust axhline axvline semilogx semilogy loglog polar streamplot hexbin pcolor tricontour errorbar clabel set_aspect violinplot set_axis_off spines text hatch plt axis plt.bar() plt.axis import figure pyplot highlight_text pypalettes plt.subplots() xlabel ylabel title legend colorbar savefig tight_layout grid set_xlim set_ylim plot scatter hist boxplot imshow cmap alpha bins tick_params annotate quiver contour barh stackplot subplots_adjust axhline axvline semilogx semilogy loglog polar streamplot hexbin pcolor tricontour errorbar clabel set_aspect violinplot set_axis_off spines text hatch plt axis plt.bar() plt.axis import figure pyplot highlight_text pypalettes plt.subplots() xlabel ylabel title legend colorbar savefig tight_layout grid set_xlim set_ylim plot scatter hist boxplot imshow cmap alpha bins tick_params annotate quiver contour barh stackplot subplots_adjust axhline axvline semilogx semilogy loglog polar streamplot hexbin pcolor tricontour errorbar clabel set_aspect violinplot set_axis_off spines text hatch plt axis plt.bar() plt.axis import figure pyplot highlight_text pypalettes plt.subplots() xlabel ylabel title legend colorbar savefig tight_layout grid set_xlim set_ylim plot scatter hist boxplot imshow cmap alpha bins tick_params annotate quiver contour barh stackplot subplots_adjust axhline axvline semilogx semilogy loglog polar streamplot hexbin pcolor tricontour errorbar clabel set_aspect violinplot set_axis_off spines text hatch plt axis plt.bar() plt.axis import figure pyplot highlight_text pypalettes plt.subplots() xlabel ylabel title legend colorbar savefig tight_layout grid set_xlim set_ylim plot scatter hist boxplot imshow cmap alpha bins tick_params annotate quiver contour barh stackplot subplots_adjust axhline axvline semilogx semilogy loglog polar streamplot hexbin pcolor tricontour errorbar clabel set_aspect violinplot set_axis_off spines text hatch plt axis plt.bar() plt.axis import figure pyplot highlight_text pypalettes plt.subplots() xlabel ylabel title legend colorbar savefig tight_layout grid set_xlim set_ylim plot scatter hist boxplot imshow cmap alpha bins tick_params annotate quiver contour barh stackplot subplots_adjust axhline axvline semilogx semilogy loglog polar streamplot hexbin pcolor tricontour errorbar clabel set_aspect violinplot set_axis_off spines text hatch plt axis plt.bar() plt.axis import figure pyplot highlight_text pypalettes plt.subplots() xlabel ylabel title legend colorbar savefig tight_layout grid set_xlim set_ylim plot scatter hist boxplot imshow cmap alpha bins tick_params annotate quiver contour barh stackplot subplots_adjust axhline axvline semilogx semilogy loglog polar streamplot hexbin pcolor tricontour errorbar clabel set_aspect violinplot set_axis_off spines text hatch plt axis plt.bar() plt.axis import figure pyplot highlight_text pypalettes plt.subplots() xlabel ylabel title legend colorbar savefig tight_layout grid set_xlim set_ylim plot scatter hist boxplot imshow cmap alpha bins tick_params annotate quiver contour barh stackplot subplots_adjust axhline axvline semilogx semilogy loglog polar streamplot hexbin pcolor tricontour errorbar clabel set_aspect violinplot set_axis_off spines text hatch plt axis plt.bar() plt.axis import figure pyplot highlight_text pypalettes plt.subplots() xlabel ylabel title legend colorbar savefig tight_layout grid set_xlim set_ylim plot scatter hist boxplot imshow cmap alpha bins tick_params annotate quiver contour barh stackplot subplots_adjust axhline axvline semilogx semilogy loglog polar streamplot hexbin pcolor tricontour errorbar clabel set_aspect violinplot set_axis_off spines text hatch plt axis plt.bar() plt.axis import figure pyplot highlight_text pypalettes plt.subplots() xlabel ylabel title legend colorbar savefig tight_layout grid set_xlim set_ylim plot scatter hist boxplot imshow cmap alpha bins tick_params annotate quiver contour barh stackplot subplots_adjust axhline axvline semilogx semilogy loglog polar streamplot hexbin pcolor tricontour errorbar clabel set_aspect violinplot set_axis_off spines text hatch plt axis plt.bar() plt.axis import figure pyplot highlight_text pypalettes plt.subplots() xlabel ylabel title legend colorbar savefig tight_layout grid set_xlim set_ylim plot scatter hist boxplot imshow cmap alpha bins tick_params annotate quiver contour barh stackplot subplots_adjust axhline axvline semilogx semilogy loglog polar streamplot hexbin pcolor tricontour errorbar clabel set_aspect violinplot set_axis_off spines text hatch plt axis plt.bar() plt.axis import figure pyplot highlight_text pypalettes plt.subplots() xlabel ylabel title legend colorbar savefig tight_layout grid set_xlim set_ylim plot scatter hist boxplot imshow cmap alpha bins tick_params annotate quiver contour barh stackplot subplots_adjust axhline axvline semilogx semilogy loglog polar streamplot hexbin pcolor tricontour errorbar clabel set_aspect violinplot set_axis_off spines text hatch plt axis plt.bar() plt.axis import figure pyplot highlight_text pypalettes plt.subplots() xlabel ylabel title legend colorbar savefig tight_layout grid set_xlim set_ylim plot scatter hist boxplot imshow cmap alpha bins tick_params annotate quiver contour barh stackplot subplots_adjust axhline axvline semilogx semilogy loglog polar streamplot hexbin pcolor tricontour errorbar clabel set_aspect violinplot set_axis_off spines text hatch plt axis plt.bar() plt.axis import figure pyplot highlight_text pypalettes plt.subplots() xlabel ylabel title legend colorbar savefig tight_layout grid set_xlim set_ylim plot scatter hist boxplot imshow cmap alpha bins tick_params annotate quiver contour barh stackplot subplots_adjust axhline axvline semilogx semilogy loglog polar streamplot hexbin pcolor tricontour errorbar clabel set_aspect violinplot set_axis_off spines text hatch plt axis plt.bar() plt.axis import figure pyplot highlight_text pypalettes plt.subplots() xlabel ylabel title legend colorbar savefig tight_layout grid set_xlim set_ylim plot scatter hist boxplot imshow cmap alpha bins tick_params annotate quiver contour barh stackplot subplots_adjust axhline axvline semilogx semilogy loglog polar streamplot hexbin pcolor tricontour errorbar clabel set_aspect violinplot set_axis_off spines text hatch plt axis plt.bar() plt.axis import figure pyplot highlight_text pypalettes plt.subplots() xlabel ylabel title legend colorbar savefig tight_layout grid set_xlim set_ylim plot scatter hist boxplot imshow cmap alpha bins tick_params annotate quiver contour barh stackplot subplots_adjust axhline axvline semilogx semilogy loglog polar streamplot hexbin pcolor tricontour errorbar clabel set_aspect violinplot set_axis_off spines text hatch plt axis plt.bar() plt.axis import figure pyplot highlight_text pypalettes plt.subplots() xlabel ylabel title legend colorbar savefig tight_layout grid set_xlim set_ylim plot scatter hist boxplot imshow cmap alpha bins tick_params annotate quiver contour barh stackplot subplots_adjust axhline axvline semilogx semilogy loglog polar streamplot hexbin pcolor tricontour errorbar clabel set_aspect violinplot set_axis_off spines text hatch plt axis plt.bar() plt.axis import figure pyplot highlight_text pypalettes plt.subplots() xlabel ylabel title legend colorbar savefig tight_layout grid set_xlim set_ylim plot scatter hist boxplot imshow cmap alpha bins tick_params annotate quiver contour barh stackplot subplots_adjust axhline axvline semilogx semilogy loglog polar streamplot hexbin pcolor tricontour errorbar clabel set_aspect violinplot set_axis_off spines text hatch plt axis plt.bar() plt.axis import figure pyplot highlight_text pypalettes plt.subplots() xlabel ylabel title legend colorbar savefig tight_layout grid set_xlim set_ylim plot scatter hist boxplot imshow cmap alpha bins tick_params annotate quiver contour barh stackplot subplots_adjust axhline axvline semilogx semilogy loglog polar streamplot hexbin pcolor tricontour errorbar clabel set_aspect violinplot set_axis_off spines text hatch plt axis plt.bar() plt.axis import figure pyplot highlight_text pypalettes plt.subplots() xlabel ylabel title legend colorbar savefig tight_layout grid set_xlim set_ylim plot scatter hist boxplot imshow cmap alpha bins tick_params annotate quiver contour barh stackplot subplots_adjust axhline axvline semilogx semilogy loglog polar streamplot hexbin pcolor tricontour errorbar clabel set_aspect violinplot set_axis_off spines text hatch plt axis plt.bar() plt.axis import figure pyplot highlight_text pypalettes plt.subplots() xlabel ylabel title legend colorbar savefig tight_layout grid set_xlim set_ylim plot scatter hist boxplot imshow cmap alpha bins tick_params annotate quiver contour barh stackplot subplots_adjust axhline axvline semilogx semilogy loglog polar streamplot hexbin pcolor tricontour errorbar clabel set_aspect violinplot set_axis_off spines text hatch plt axis plt.bar() plt.axis import figure pyplot highlight_text pypalettes plt.subplots() xlabel ylabel title legend colorbar savefig tight_layout grid set_xlim set_ylim plot scatter hist boxplot imshow cmap alpha bins tick_params annotate quiver contour barh stackplot subplots_adjust axhline axvline semilogx semilogy loglog polar streamplot hexbin pcolor tricontour errorbar clabel set_aspect violinplot set_axis_off spines text hatch plt axis plt.bar() plt.axis import figure pyplot highlight_text pypalettes plt.subplots() xlabel ylabel title legend colorbar savefig tight_layout grid set_xlim set_ylim plot scatter hist boxplot imshow cmap alpha bins tick_params annotate quiver contour barh stackplot subplots_adjust axhline axvline semilogx semilogy loglog polar streamplot hexbin pcolor tricontour errorbar clabel set_aspect violinplot set_axis_off spines text hatch plt axis plt.bar() plt.axis import figure pyplot highlight_text pypalettes plt.subplots() xlabel ylabel title legend colorbar savefig tight_layout grid set_xlim set_ylim plot scatter hist boxplot imshow cmap alpha bins tick_params annotate quiver contour barh stackplot subplots_adjust axhline axvline semilogx semilogy loglog polar streamplot hexbin pcolor tricontour errorbar clabel set_aspect violinplot set_axis_off spines text hatch plt axis plt.bar() plt.axis import figure pyplot highlight_text pypalettes plt.subplots() xlabel ylabel title legend colorbar savefig tight_layout grid set_xlim set_ylim plot scatter hist boxplot imshow cmap alpha bins tick_params annotate quiver contour barh stackplot subplots_adjust axhline axvline semilogx semilogy loglog polar streamplot hexbin pcolor tricontour errorbar clabel set_aspect violinplot set_axis_off spines text hatch plt axis plt.bar() plt.axis import figure pyplot highlight_text pypalettes plt.subplots() xlabel ylabel title legend colorbar savefig tight_layout grid set_xlim set_ylim plot scatter hist boxplot imshow cmap alpha bins tick_params annotate quiver contour barh stackplot subplots_adjust axhline axvline semilogx semilogy loglog polar streamplot hexbin pcolor tricontour errorbar clabel set_aspect violinplot set_axis_off spines text hatch plt axis plt.bar() plt.axis import figure pyplot highlight_text pypalettes plt.subplots() xlabel ylabel title legend colorbar savefig tight_layout grid set_xlim set_ylim plot scatter hist boxplot imshow cmap alpha bins tick_params annotate quiver contour barh stackplot subplots_adjust axhline axvline semilogx semilogy loglog polar streamplot hexbin pcolor tricontour errorbar clabel set_aspect violinplot set_axis_off spines text hatch plt axis plt.bar() plt.axis import figure pyplot highlight_text pypalettes plt.subplots() xlabel ylabel title legend colorbar savefig tight_layout grid set_xlim set_ylim plot scatter hist boxplot imshow cmap alpha bins tick_params annotate quiver contour barh stackplot subplots_adjust axhline axvline semilogx semilogy loglog polar streamplot hexbin pcolor tricontour errorbar clabel set_aspect violinplot set_axis_off spines text hatch plt axis plt.bar() plt.axis import figure pyplot highlight_text pypalettes plt.subplots() xlabel ylabel title legend colorbar savefig tight_layout grid set_xlim set_ylim plot scatter hist boxplot imshow cmap alpha bins tick_params annotate quiver contour barh stackplot subplots_adjust axhline axvline semilogx semilogy loglog polar streamplot hexbin pcolor tricontour errorbar clabel set_aspect violinplot set_axis_off spines text hatch plt axis plt.bar() plt.axis import figure pyplot highlight_text pypalettes plt.subplots() xlabel ylabel title legend colorbar savefig tight_layout grid set_xlim set_ylim plot scatter hist boxplot imshow cmap alpha bins tick_params annotate quiver contour barh stackplot subplots_adjust axhline axvline semilogx semilogy loglog polar streamplot hexbin pcolor tricontour errorbar clabel set_aspect violinplot set_axis_off spines text hatch plt axis plt.bar() plt.axis import figure pyplot highlight_text pypalettes plt.subplots() xlabel ylabel title legend colorbar savefig tight_layout grid set_xlim set_ylim plot scatter hist boxplot imshow cmap alpha bins tick_params annotate quiver contour barh stackplot subplots_adjust axhline axvline semilogx semilogy loglog polar streamplot hexbin pcolor tricontour errorbar clabel set_aspect violinplot set_axis_off spines text hatch plt axis plt.bar() plt.axis import figure pyplot highlight_text pypalettes plt.subplots() xlabel ylabel title legend colorbar savefig tight_layout grid set_xlim set_ylim plot scatter hist boxplot imshow cmap alpha bins tick_params annotate quiver contour barh stackplot subplots_adjust axhline axvline semilogx semilogy loglog polar streamplot hexbin pcolor tricontour errorbar clabel set_aspect violinplot set_axis_off spines text hatch plt axis plt.bar() plt.axis import figure pyplot highlight_text pypalettes plt.subplots() xlabel ylabel title legend colorbar savefig tight_layout grid set_xlim set_ylim plot scatter hist boxplot imshow cmap alpha bins tick_params annotate quiver contour barh stackplot subplots_adjust axhline axvline semilogx semilogy loglog polar streamplot hexbin pcolor tricontour errorbar clabel set_aspect violinplot set_axis_off spines text hatch plt axis plt.bar() plt.axis import figure pyplot highlight_text pypalettes plt.subplots() xlabel ylabel title legend colorbar savefig tight_layout grid set_xlim set_ylim plot scatter hist boxplot imshow cmap alpha bins tick_params annotate quiver contour barh stackplot subplots_adjust axhline axvline semilogx semilogy loglog polar streamplot hexbin pcolor tricontour errorbar clabel set_aspect violinplot set_axis_off spines text hatch plt axis plt.bar() plt.axis import figure pyplot highlight_text pypalettes plt.subplots() xlabel ylabel title legend colorbar savefig tight_layout grid set_xlim set_ylim plot scatter hist boxplot imshow cmap alpha bins tick_params annotate quiver contour barh stackplot subplots_adjust axhline axvline semilogx semilogy loglog polar streamplot hexbin pcolor tricontour errorbar clabel set_aspect violinplot set_axis_off spines text hatch plt axis plt.bar() plt.axis import figure pyplot highlight_text pypalettes plt.subplots() xlabel ylabel title legend colorbar savefig tight_layout grid set_xlim set_ylim plot scatter hist boxplot imshow cmap alpha bins tick_params annotate quiver contour barh stackplot subplots_adjust axhline axvline semilogx semilogy loglog polar streamplot hexbin pcolor tricontour errorbar clabel set_aspect violinplot set_axis_off spines text hatch plt axis plt.bar() plt.axis import figure pyplot highlight_text pypalettes plt.subplots() xlabel ylabel title legend colorbar savefig tight_layout grid set_xlim set_ylim plot scatter hist boxplot imshow cmap alpha bins tick_params annotate quiver contour barh stackplot subplots_adjust axhline axvline semilogx semilogy loglog polar streamplot hexbin pcolor tricontour errorbar clabel set_aspect violinplot set_axis_off spines text hatch plt axis plt.bar() plt.axis import figure pyplot highlight_text pypalettes plt.subplots() xlabel ylabel title legend colorbar savefig tight_layout grid set_xlim set_ylim plot scatter hist boxplot imshow cmap alpha bins tick_params annotate quiver contour barh stackplot subplots_adjust axhline axvline semilogx semilogy loglog polar streamplot hexbin pcolor tricontour errorbar clabel set_aspect violinplot set_axis_off spines text hatch plt axis plt.bar() plt.axis import figure pyplot highlight_text pypalettes plt.subplots() xlabel ylabel title legend colorbar savefig tight_layout grid set_xlim set_ylim plot scatter hist boxplot imshow cmap alpha bins tick_params annotate quiver contour barh stackplot subplots_adjust axhline axvline semilogx semilogy loglog polar streamplot hexbin pcolor tricontour errorbar clabel set_aspect violinplot set_axis_off spines text hatch plt axis plt.bar() plt.axis import figure pyplot highlight_text pypalettes plt.subplots() xlabel ylabel title legend colorbar savefig tight_layout grid set_xlim set_ylim plot scatter hist boxplot imshow cmap alpha bins tick_params annotate quiver contour barh stackplot subplots_adjust axhline axvline semilogx semilogy loglog polar streamplot hexbin pcolor tricontour errorbar clabel set_aspect violinplot set_axis_off spines text hatch plt axis plt.bar() plt.axis import figure pyplot highlight_text pypalettes plt.subplots() xlabel ylabel title legend colorbar savefig tight_layout grid set_xlim set_ylim plot scatter hist boxplot imshow cmap alpha bins tick_params annotate quiver contour barh stackplot subplots_adjust axhline axvline semilogx semilogy loglog polar streamplot hexbin pcolor tricontour errorbar clabel set_aspect violinplot set_axis_off spines text hatch plt axis plt.bar() plt.axis import figure pyplot highlight_text pypalettes plt.subplots() xlabel ylabel title legend colorbar savefig tight_layout grid set_xlim set_ylim plot scatter hist boxplot imshow cmap alpha bins tick_params annotate quiver contour barh stackplot subplots_adjust axhline axvline semilogx semilogy loglog polar streamplot hexbin pcolor tricontour errorbar clabel set_aspect violinplot set_axis_off spines text hatch plt axis plt.bar() plt.axis import figure pyplot highlight_text pypalettes plt.subplots() xlabel ylabel title legend colorbar savefig tight_layout grid set_xlim set_ylim plot scatter hist boxplot imshow cmap alpha bins tick_params annotate quiver contour barh stackplot subplots_adjust axhline axvline semilogx semilogy loglog polar streamplot hexbin pcolor tricontour errorbar clabel set_aspect violinplot set_axis_off spines text hatch plt axis plt.bar() plt.axis import figure pyplot highlight_text pypalettes plt.subplots() xlabel ylabel title legend colorbar savefig tight_layout grid set_xlim set_ylim plot scatter hist boxplot imshow cmap alpha bins tick_params annotate quiver contour barh stackplot subplots_adjust axhline axvline semilogx semilogy loglog polar streamplot hexbin pcolor tricontour errorbar clabel set_aspect violinplot set_axis_off spines text hatch plt axis plt.bar() plt.axis import figure pyplot highlight_text pypalettes plt.subplots() xlabel ylabel title legend colorbar savefig tight_layout grid set_xlim set_ylim plot scatter hist boxplot imshow cmap alpha bins tick_params annotate quiver contour barh stackplot subplots_adjust axhline axvline semilogx semilogy loglog polar streamplot hexbin pcolor tricontour errorbar clabel set_aspect violinplot set_axis_off spines text hatch plt axis plt.bar() plt.axis import figure pyplot highlight_text pypalettes plt.subplots() xlabel ylabel title legend colorbar savefig tight_layout grid set_xlim set_ylim plot scatter hist boxplot imshow cmap alpha bins tick_params annotate quiver contour barh stackplot subplots_adjust axhline axvline semilogx semilogy loglog polar streamplot hexbin pcolor tricontour errorbar clabel set_aspect violinplot set_axis_off spines text hatch plt axis plt.bar() plt.axis import figure pyplot highlight_text pypalettes plt.subplots() xlabel ylabel title legend colorbar savefig tight_layout grid set_xlim set_ylim plot scatter hist boxplot imshow cmap alpha bins tick_params annotate quiver contour barh stackplot subplots_adjust axhline axvline semilogx semilogy loglog polar streamplot hexbin pcolor tricontour errorbar clabel set_aspect violinplot set_axis_off spines text hatch plt axis plt.bar() plt.axis import figure pyplot highlight_text pypalettes plt.subplots() xlabel ylabel title legend colorbar savefig tight_layout grid set_xlim set_ylim plot scatter hist boxplot imshow cmap alpha bins tick_params annotate quiver contour barh stackplot subplots_adjust axhline axvline semilogx semilogy loglog polar streamplot hexbin pcolor tricontour errorbar clabel set_aspect violinplot set_axis_off spines text hatch plt axis plt.bar() plt.axis import figure pyplot highlight_text pypalettes plt.subplots() xlabel ylabel title legend colorbar savefig tight_layout grid set_xlim set_ylim plot scatter hist boxplot imshow cmap alpha bins tick_params annotate quiver contour barh stackplot subplots_adjust axhline axvline semilogx semilogy loglog polar streamplot hexbin pcolor tricontour errorbar clabel set_aspect violinplot set_axis_off spines text hatch plt axis plt.bar() plt.axis import figure pyplot highlight_text pypalettes plt.subplots() xlabel ylabel title legend colorbar savefig tight_layout grid set_xlim set_ylim plot scatter hist boxplot imshow cmap alpha bins tick_params annotate quiver contour barh stackplot subplots_adjust axhline axvline semilogx semilogy loglog polar streamplot hexbin pcolor tricontour errorbar clabel set_aspect violinplot set_axis_off spines text hatch plt axis plt.bar() plt.axis import figure pyplot highlight_text pypalettes plt.subplots() xlabel ylabel title legend colorbar savefig tight_layout grid set_xlim set_ylim plot scatter hist boxplot imshow cmap alpha bins tick_params annotate quiver contour barh stackplot subplots_adjust axhline axvline semilogx semilogy loglog polar streamplot hexbin pcolor tricontour errorbar clabel set_aspect violinplot set_axis_off spines text hatch plt axis plt.bar() plt.axis import figure pyplot highlight_text pypalettes plt.subplots() xlabel ylabel title legend colorbar savefig tight_layout grid set_xlim set_ylim plot scatter hist boxplot imshow cmap alpha bins tick_params annotate quiver contour barh stackplot subplots_adjust axhline axvline semilogx semilogy loglog polar streamplot hexbin pcolor tricontour errorbar clabel set_aspect violinplot set_axis_off spines text hatch plt axis plt.bar() plt.axis import figure pyplot highlight_text pypalettes plt.subplots() xlabel ylabel title legend colorbar savefig tight_layout grid set_xlim set_ylim plot scatter hist boxplot imshow cmap alpha bins tick_params annotate quiver contour barh stackplot subplots_adjust axhline axvline semilogx semilogy loglog polar streamplot hexbin pcolor tricontour errorbar clabel set_aspect violinplot set_axis_off spines text hatch plt axis plt.bar() plt.axis import figure pyplot highlight_text pypalettes plt.subplots() xlabel ylabel title legend colorbar savefig tight_layout grid set_xlim set_ylim plot scatter hist boxplot imshow cmap alpha bins tick_params annotate quiver contour barh stackplot subplots_adjust axhline axvline semilogx semilogy loglog polar streamplot hexbin pcolor tricontour errorbar clabel set_aspect violinplot set_axis_off spines text hatch plt axis plt.bar() plt.axis import figure pyplot highlight_text pypalettes plt.subplots() xlabel ylabel title legend colorbar savefig tight_layout grid set_xlim set_ylim plot scatter hist boxplot imshow cmap alpha bins tick_params annotate quiver contour barh stackplot subplots_adjust axhline axvline semilogx semilogy loglog polar streamplot hexbin pcolor tricontour errorbar clabel set_aspect violinplot set_axis_off spines text hatch plt axis plt.bar() plt.axis import figure pyplot highlight_text pypalettes plt.subplots() xlabel ylabel title legend colorbar savefig tight_layout grid set_xlim set_ylim plot scatter hist boxplot imshow cmap alpha bins tick_params annotate quiver contour barh stackplot subplots_adjust axhline axvline semilogx semilogy loglog polar streamplot hexbin pcolor tricontour errorbar clabel set_aspect violinplot set_axis_off spines text hatch plt axis plt.bar() plt.axis import figure pyplot highlight_text pypalettes plt.subplots() xlabel ylabel title legend colorbar savefig tight_layout grid set_xlim set_ylim plot scatter hist boxplot imshow cmap alpha bins tick_params annotate quiver contour barh stackplot subplots_adjust axhline axvline semilogx semilogy loglog polar streamplot hexbin pcolor tricontour errorbar clabel set_aspect violinplot set_axis_off spines text hatch plt axis plt.bar() plt.axis import figure pyplot highlight_text pypalettes plt.subplots() xlabel ylabel title legend colorbar savefig tight_layout grid set_xlim set_ylim plot scatter hist boxplot imshow cmap alpha bins tick_params annotate quiver contour barh stackplot subplots_adjust axhline axvline semilogx semilogy loglog polar streamplot hexbin pcolor tricontour errorbar clabel set_aspect violinplot set_axis_off spines text hatch plt axis plt.bar() plt.axis import figure pyplot highlight_text pypalettes plt.subplots() xlabel ylabel title legend colorbar savefig tight_layout grid set_xlim set_ylim plot scatter hist boxplot imshow cmap alpha bins tick_params annotate quiver contour barh stackplot subplots_adjust axhline axvline semilogx semilogy loglog polar streamplot hexbin pcolor tricontour errorbar clabel set_aspect violinplot set_axis_off spines text hatch plt axis plt.bar() plt.axis import figure pyplot highlight_text pypalettes plt.subplots() xlabel ylabel title legend colorbar savefig tight_layout grid set_xlim set_ylim plot scatter hist boxplot imshow cmap alpha bins tick_params annotate quiver contour barh stackplot subplots_adjust axhline axvline semilogx semilogy loglog polar streamplot hexbin pcolor tricontour errorbar clabel set_aspect violinplot set_axis_off spines text hatch plt axis plt.bar() plt.axis import figure pyplot highlight_text pypalettes plt.subplots() xlabel ylabel title legend colorbar savefig tight_layout grid set_xlim set_ylim plot scatter hist boxplot imshow cmap alpha bins tick_params annotate quiver contour barh stackplot subplots_adjust axhline axvline semilogx semilogy loglog polar streamplot hexbin pcolor tricontour errorbar clabel set_aspect violinplot set_axis_off spines text hatch plt axis plt.bar() plt.axis import figure pyplot highlight_text pypalettes plt.subplots() xlabel ylabel title legend colorbar savefig tight_layout grid set_xlim set_ylim plot scatter hist boxplot imshow cmap alpha bins tick_params annotate quiver contour barh stackplot subplots_adjust axhline axvline semilogx semilogy loglog polar streamplot hexbin pcolor tricontour errorbar clabel set_aspect violinplot set_axis_off spines text hatch plt axis plt.bar() plt.axis import figure pyplot highlight_text pypalettes plt.subplots() xlabel ylabel title legend colorbar savefig tight_layout grid set_xlim set_ylim plot scatter hist boxplot imshow cmap alpha bins tick_params annotate quiver contour barh stackplot subplots_adjust axhline axvline semilogx semilogy loglog polar streamplot hexbin pcolor tricontour errorbar clabel set_aspect violinplot set_axis_off spines text hatch plt axis plt.bar() plt.axis import figure pyplot highlight_text pypalettes plt.subplots() xlabel ylabel title legend colorbar savefig tight_layout grid set_xlim set_ylim plot scatter hist boxplot imshow cmap alpha bins tick_params annotate quiver contour barh stackplot subplots_adjust axhline axvline semilogx semilogy loglog polar streamplot hexbin pcolor tricontour errorbar clabel set_aspect violinplot set_axis_off spines text hatch plt axis plt.bar() plt.axis import figure pyplot highlight_text pypalettes plt.subplots() xlabel ylabel title legend colorbar savefig tight_layout grid set_xlim set_ylim plot scatter hist boxplot imshow cmap alpha bins tick_params annotate quiver contour barh stackplot subplots_adjust axhline axvline semilogx semilogy loglog polar streamplot hexbin pcolor tricontour errorbar clabel set_aspect violinplot set_axis_off spines text hatch plt axis plt.bar() plt.axis import figure pyplot highlight_text pypalettes plt.subplots() xlabel ylabel title legend colorbar savefig tight_layout grid set_xlim set_ylim plot scatter hist boxplot imshow cmap alpha bins tick_params annotate quiver contour barh stackplot subplots_adjust axhline axvline semilogx semilogy loglog polar streamplot hexbin pcolor tricontour errorbar clabel set_aspect violinplot set_axis_off spines text hatch plt axis plt.bar() plt.axis import figure pyplot highlight_text pypalettes plt.subplots() xlabel ylabel title legend colorbar savefig tight_layout grid set_xlim set_ylim plot scatter hist boxplot imshow cmap alpha bins tick_params annotate quiver contour barh stackplot subplots_adjust axhline axvline semilogx semilogy loglog polar streamplot hexbin pcolor tricontour errorbar clabel set_aspect violinplot set_axis_off spines text hatch plt axis plt.bar() plt.axis import figure pyplot highlight_text pypalettes plt.subplots() xlabel ylabel title legend colorbar savefig tight_layout grid set_xlim set_ylim plot scatter hist boxplot imshow cmap alpha bins tick_params annotate quiver contour barh stackplot subplots_adjust axhline axvline semilogx semilogy loglog polar streamplot hexbin pcolor tricontour errorbar clabel set_aspect violinplot set_axis_off spines text hatch plt axis plt.bar() plt.axis import figure pyplot highlight_text pypalettes plt.subplots() xlabel ylabel title legend colorbar savefig tight_layout grid set_xlim set_ylim plot scatter hist boxplot imshow cmap alpha bins tick_params annotate quiver contour barh stackplot subplots_adjust axhline axvline semilogx semilogy loglog polar streamplot hexbin pcolor tricontour errorbar clabel set_aspect violinplot set_axis_off spines text hatch plt axis plt.bar() plt.axis import figure pyplot highlight_text pypalettes plt.subplots() xlabel ylabel title legend colorbar savefig tight_layout grid set_xlim set_ylim plot scatter hist boxplot imshow cmap alpha bins tick_params annotate quiver contour barh stackplot subplots_adjust axhline axvline semilogx semilogy loglog polar streamplot hexbin pcolor tricontour errorbar clabel set_aspect violinplot set_axis_off spines text hatch plt axis plt.bar() plt.axis import figure pyplot highlight_text pypalettes plt.subplots() xlabel ylabel title legend colorbar savefig tight_layout grid set_xlim set_ylim plot scatter hist boxplot imshow cmap alpha bins tick_params annotate quiver contour barh stackplot subplots_adjust axhline axvline semilogx semilogy loglog polar streamplot hexbin pcolor tricontour errorbar clabel set_aspect violinplot set_axis_off spines text hatch plt axis plt.bar() plt.axis import figure pyplot highlight_text pypalettes plt.subplots() xlabel ylabel title legend colorbar savefig tight_layout grid set_xlim set_ylim plot scatter hist boxplot imshow cmap alpha bins tick_params annotate quiver contour barh stackplot subplots_adjust axhline axvline semilogx semilogy loglog polar streamplot hexbin pcolor tricontour errorbar clabel set_aspect violinplot set_axis_off spines text hatch plt axis plt.bar() plt.axis import figure pyplot highlight_text pypalettes plt.subplots() xlabel ylabel title legend colorbar savefig tight_layout grid set_xlim set_ylim plot scatter hist boxplot imshow cmap alpha bins tick_params annotate quiver contour barh stackplot subplots_adjust axhline axvline semilogx semilogy loglog polar streamplot hexbin pcolor tricontour errorbar clabel set_aspect violinplot set_axis_off spines text hatch plt axis plt.bar() plt.axis import figure pyplot highlight_text pypalettes plt.subplots() xlabel ylabel title legend colorbar savefig tight_layout grid set_xlim set_ylim plot scatter hist boxplot imshow cmap alpha bins tick_params annotate quiver contour barh stackplot subplots_adjust axhline axvline semilogx semilogy loglog polar streamplot hexbin pcolor tricontour errorbar clabel set_aspect violinplot set_axis_off spines text hatch plt axis plt.bar() plt.axis import figure pyplot highlight_text pypalettes plt.subplots() xlabel ylabel title legend colorbar savefig tight_layout grid set_xlim set_ylim plot scatter hist boxplot imshow cmap alpha bins tick_params annotate quiver contour barh stackplot subplots_adjust axhline axvline semilogx semilogy loglog polar streamplot hexbin pcolor tricontour errorbar clabel set_aspect violinplot set_axis_off spines text hatch plt axis plt.bar() plt.axis import figure pyplot highlight_text pypalettes plt.subplots() xlabel ylabel title legend colorbar savefig tight_layout grid set_xlim set_ylim plot scatter hist boxplot imshow cmap alpha bins tick_params annotate quiver contour barh stackplot subplots_adjust axhline axvline semilogx semilogy loglog polar streamplot hexbin pcolor tricontour errorbar clabel set_aspect violinplot set_axis_off spines text hatch plt axis plt.bar() plt.axis import figure pyplot highlight_text pypalettes plt.subplots() xlabel ylabel title legend colorbar savefig tight_layout grid set_xlim set_ylim plot scatter hist boxplot imshow cmap alpha bins tick_params annotate quiver contour barh stackplot subplots_adjust axhline axvline semilogx semilogy loglog polar streamplot hexbin pcolor tricontour errorbar clabel set_aspect violinplot set_axis_off spines text hatch plt axis plt.bar() plt.axis import figure pyplot highlight_text pypalettes plt.subplots() xlabel ylabel title legend colorbar savefig tight_layout grid set_xlim set_ylim plot scatter hist boxplot imshow cmap alpha bins tick_params annotate quiver contour barh stackplot subplots_adjust axhline axvline semilogx semilogy loglog polar streamplot hexbin pcolor tricontour errorbar clabel set_aspect violinplot set_axis_off spines text hatch plt axis plt.bar() plt.axis import figure pyplot highlight_text pypalettes plt.subplots() xlabel ylabel title legend colorbar savefig tight_layout grid set_xlim set_ylim plot scatter hist boxplot imshow cmap alpha bins tick_params annotate quiver contour barh stackplot subplots_adjust axhline axvline semilogx semilogy loglog polar streamplot hexbin pcolor tricontour errorbar clabel set_aspect violinplot set_axis_off spines text hatch plt axis plt.bar() plt.axis import figure pyplot highlight_text pypalettes plt.subplots() xlabel ylabel title legend colorbar savefig tight_layout grid set_xlim set_ylim plot scatter hist boxplot imshow cmap alpha bins tick_params annotate quiver contour barh stackplot subplots_adjust axhline axvline semilogx semilogy loglog polar streamplot hexbin pcolor tricontour errorbar clabel set_aspect violinplot set_axis_off spines text hatch plt axis plt.bar() plt.axis import figure pyplot highlight_text pypalettes plt.subplots() xlabel ylabel title legend colorbar savefig tight_layout grid set_xlim set_ylim plot scatter hist boxplot imshow cmap alpha bins tick_params annotate quiver contour barh stackplot subplots_adjust axhline axvline semilogx semilogy loglog polar streamplot hexbin pcolor tricontour errorbar clabel set_aspect violinplot set_axis_off spines text hatch plt axis plt.bar() plt.axis import figure pyplot highlight_text pypalettes plt.subplots() xlabel ylabel title legend colorbar savefig tight_layout grid set_xlim set_ylim plot scatter hist boxplot imshow cmap alpha bins tick_params annotate quiver contour barh stackplot subplots_adjust axhline axvline semilogx semilogy loglog polar streamplot hexbin pcolor tricontour errorbar clabel set_aspect violinplot set_axis_off spines text hatch plt axis plt.bar() plt.axis import figure pyplot highlight_text pypalettes plt.subplots() xlabel ylabel title legend colorbar savefig tight_layout grid set_xlim set_ylim plot scatter hist boxplot imshow cmap alpha bins tick_params annotate quiver contour barh stackplot subplots_adjust axhline axvline semilogx semilogy loglog polar streamplot hexbin pcolor tricontour errorbar clabel set_aspect violinplot set_axis_off spines text hatch plt axis plt.bar() plt.axis import figure pyplot highlight_text pypalettes plt.subplots() xlabel ylabel title legend colorbar savefig tight_layout grid set_xlim set_ylim plot scatter hist boxplot imshow cmap alpha bins tick_params annotate quiver contour barh stackplot subplots_adjust axhline axvline semilogx semilogy loglog polar streamplot hexbin pcolor tricontour errorbar clabel set_aspect violinplot set_axis_off spines text hatch plt axis plt.bar() plt.axis import figure pyplot highlight_text pypalettes plt.subplots() xlabel ylabel title legend colorbar savefig tight_layout grid set_xlim set_ylim plot scatter hist boxplot imshow cmap alpha bins tick_params annotate quiver contour barh stackplot subplots_adjust axhline axvline semilogx semilogy loglog polar streamplot hexbin pcolor tricontour errorbar clabel set_aspect violinplot set_axis_off spines text hatch plt axis plt.bar() plt.axis import figure pyplot highlight_text pypalettes plt.subplots() xlabel ylabel title legend colorbar savefig tight_layout grid set_xlim set_ylim plot scatter hist boxplot imshow cmap alpha bins tick_params annotate quiver contour barh stackplot subplots_adjust axhline axvline semilogx semilogy loglog polar streamplot hexbin pcolor tricontour errorbar clabel set_aspect violinplot set_axis_off spines text hatch plt axis plt.bar() plt.axis import figure pyplot highlight_text pypalettes plt.subplots() xlabel ylabel title legend colorbar savefig tight_layout grid set_xlim set_ylim plot scatter hist boxplot imshow cmap alpha bins tick_params annotate quiver contour barh stackplot subplots_adjust axhline axvline semilogx semilogy loglog polar streamplot hexbin pcolor tricontour errorbar clabel set_aspect violinplot set_axis_off spines text hatch plt axis plt.bar() plt.axis import figure pyplot highlight_text pypalettes plt.subplots() xlabel ylabel title legend colorbar savefig tight_layout grid set_xlim set_ylim plot scatter hist boxplot imshow cmap alpha bins tick_params annotate quiver contour barh stackplot subplots_adjust axhline axvline semilogx semilogy loglog polar streamplot hexbin pcolor tricontour errorbar clabel set_aspect violinplot set_axis_off spines text hatch plt axis plt.bar() plt.axis import figure pyplot highlight_text pypalettes plt.subplots() xlabel ylabel title legend colorbar savefig tight_layout grid set_xlim set_ylim plot scatter hist boxplot imshow cmap alpha bins tick_params annotate quiver contour barh stackplot subplots_adjust axhline axvline semilogx semilogy loglog polar streamplot hexbin pcolor tricontour errorbar clabel set_aspect violinplot set_axis_off spines text hatch plt axis plt.bar() plt.axis import figure pyplot highlight_text pypalettes plt.subplots() xlabel ylabel title legend colorbar savefig tight_layout grid set_xlim set_ylim plot scatter hist boxplot imshow cmap alpha bins tick_params annotate quiver contour barh stackplot subplots_adjust axhline axvline semilogx semilogy loglog polar streamplot hexbin pcolor tricontour errorbar clabel set_aspect violinplot set_axis_off spines text hatch plt axis plt.bar() plt.axis import figure pyplot highlight_text pypalettes plt.subplots() xlabel ylabel title legend colorbar savefig tight_layout grid set_xlim set_ylim plot scatter hist boxplot imshow cmap alpha bins tick_params annotate quiver contour barh stackplot subplots_adjust axhline axvline semilogx semilogy loglog polar streamplot hexbin pcolor tricontour errorbar clabel set_aspect violinplot set_axis_off spines text hatch plt axis plt.bar() plt.axis import figure pyplot highlight_text pypalettes plt.subplots() xlabel ylabel title legend colorbar savefig tight_layout grid set_xlim set_ylim plot scatter hist boxplot imshow cmap alpha bins tick_params annotate quiver contour barh stackplot subplots_adjust axhline axvline semilogx semilogy loglog polar streamplot hexbin pcolor tricontour errorbar clabel set_aspect violinplot set_axis_off spines text hatch plt axis plt.bar() plt.axis import figure pyplot highlight_text pypalettes plt.subplots() xlabel ylabel title legend colorbar savefig tight_layout grid set_xlim set_ylim plot scatter hist boxplot imshow cmap alpha bins tick_params annotate quiver contour barh stackplot subplots_adjust axhline axvline semilogx semilogy loglog polar streamplot hexbin pcolor tricontour errorbar clabel set_aspect violinplot set_axis_off spines text hatch plt axis plt.bar() plt.axis import figure pyplot highlight_text pypalettes plt.subplots() xlabel ylabel title legend colorbar savefig tight_layout grid set_xlim set_ylim plot scatter hist boxplot imshow cmap alpha bins tick_params annotate quiver contour barh stackplot subplots_adjust axhline axvline semilogx semilogy loglog polar streamplot hexbin pcolor tricontour errorbar clabel set_aspect violinplot set_axis_off spines text hatch plt axis plt.bar() plt.axis import figure pyplot highlight_text pypalettes plt.subplots() xlabel ylabel title legend colorbar savefig tight_layout grid set_xlim set_ylim plot scatter hist boxplot imshow cmap alpha bins tick_params annotate quiver contour barh stackplot subplots_adjust axhline axvline semilogx semilogy loglog polar streamplot hexbin pcolor tricontour errorbar clabel set_aspect violinplot set_axis_off spines text hatch plt axis plt.bar() plt.axis import figure pyplot highlight_text pypalettes plt.subplots() xlabel ylabel title legend colorbar savefig tight_layout grid set_xlim set_ylim plot scatter hist boxplot imshow cmap alpha bins tick_params annotate quiver contour barh stackplot subplots_adjust axhline axvline semilogx semilogy loglog polar streamplot hexbin pcolor tricontour errorbar clabel set_aspect violinplot set_axis_off spines text hatch plt axis plt.bar() plt.axis import figure pyplot highlight_text pypalettes plt.subplots() xlabel ylabel title legend colorbar savefig tight_layout grid set_xlim set_ylim plot scatter hist boxplot imshow cmap alpha bins tick_params annotate quiver contour barh stackplot subplots_adjust axhline axvline semilogx semilogy loglog polar streamplot hexbin pcolor tricontour errorbar clabel set_aspect violinplot set_axis_off spines text hatch plt axis plt.bar() plt.axis import figure pyplot highlight_text pypalettes plt.subplots() xlabel ylabel title legend colorbar savefig tight_layout grid set_xlim set_ylim plot scatter hist boxplot imshow cmap alpha bins tick_params annotate quiver contour barh stackplot subplots_adjust axhline axvline semilogx semilogy loglog polar streamplot hexbin pcolor tricontour errorbar clabel set_aspect violinplot set_axis_off spines text hatch plt axis plt.bar() plt.axis import figure pyplot highlight_text pypalettes plt.subplots() xlabel ylabel title legend colorbar savefig tight_layout grid set_xlim set_ylim plot scatter hist boxplot imshow cmap alpha bins tick_params annotate quiver contour barh stackplot subplots_adjust axhline axvline semilogx semilogy loglog polar streamplot hexbin pcolor tricontour errorbar clabel set_aspect violinplot set_axis_off spines text hatch plt axis plt.bar() plt.axis import figure pyplot highlight_text pypalettes plt.subplots() xlabel ylabel title legend colorbar savefig tight_layout grid set_xlim set_ylim plot scatter hist boxplot imshow cmap alpha bins tick_params annotate quiver contour barh stackplot subplots_adjust axhline axvline semilogx semilogy loglog polar streamplot hexbin pcolor tricontour errorbar clabel set_aspect violinplot set_axis_off spines text hatch plt axis plt.bar() plt.axis import figure pyplot highlight_text pypalettes plt.subplots() xlabel ylabel title legend colorbar savefig tight_layout grid set_xlim set_ylim plot scatter hist boxplot imshow cmap alpha bins tick_params annotate quiver contour barh stackplot subplots_adjust axhline axvline semilogx semilogy loglog polar streamplot hexbin pcolor tricontour errorbar clabel set_aspect violinplot set_axis_off spines text hatch plt axis plt.bar() plt.axis import figure pyplot highlight_text pypalettes plt.subplots() xlabel ylabel title legend colorbar savefig tight_layout grid set_xlim set_ylim plot scatter hist boxplot imshow cmap alpha bins tick_params annotate quiver contour barh stackplot subplots_adjust axhline axvline semilogx semilogy loglog polar streamplot hexbin pcolor tricontour errorbar clabel set_aspect violinplot set_axis_off spines text hatch plt axis plt.bar() plt.axis import figure pyplot highlight_text pypalettes plt.subplots() xlabel ylabel title legend colorbar savefig tight_layout grid set_xlim set_ylim plot scatter hist boxplot imshow cmap alpha bins tick_params annotate quiver contour barh stackplot subplots_adjust axhline axvline semilogx semilogy loglog polar streamplot hexbin pcolor tricontour errorbar clabel set_aspect violinplot set_axis_off spines text hatch plt axis plt.bar() plt.axis import figure pyplot highlight_text pypalettes plt.subplots() xlabel ylabel title legend colorbar savefig tight_layout grid set_xlim set_ylim plot scatter hist boxplot imshow cmap alpha bins tick_params annotate quiver contour barh stackplot subplots_adjust axhline axvline semilogx semilogy loglog polar streamplot hexbin pcolor tricontour errorbar clabel set_aspect violinplot set_axis_off spines text hatch plt axis plt.bar() plt.axis import figure pyplot highlight_text pypalettes plt.subplots() xlabel ylabel title legend colorbar savefig tight_layout grid set_xlim set_ylim plot scatter hist boxplot imshow cmap alpha bins tick_params annotate quiver contour barh stackplot subplots_adjust axhline axvline semilogx semilogy loglog polar streamplot hexbin pcolor tricontour errorbar clabel set_aspect violinplot set_axis_off spines text hatch plt axis plt.bar() plt.axis import figure pyplot highlight_text pypalettes plt.subplots() xlabel ylabel title legend colorbar savefig tight_layout grid set_xlim set_ylim plot scatter hist boxplot imshow cmap alpha bins tick_params annotate quiver contour barh stackplot subplots_adjust axhline axvline semilogx semilogy loglog polar streamplot hexbin pcolor tricontour errorbar clabel set_aspect violinplot set_axis_off spines text hatch plt axis plt.bar() plt.axis import figure pyplot highlight_text pypalettes plt.subplots() xlabel ylabel title legend colorbar savefig tight_layout grid set_xlim set_ylim plot scatter hist boxplot imshow cmap alpha bins tick_params annotate quiver contour barh stackplot subplots_adjust axhline axvline semilogx semilogy loglog polar streamplot hexbin pcolor tricontour errorbar clabel set_aspect violinplot set_axis_off spines text hatch plt axis plt.bar() plt.axis import figure pyplot highlight_text pypalettes plt.subplots() xlabel ylabel title legend colorbar savefig tight_layout grid set_xlim set_ylim plot scatter hist boxplot imshow cmap alpha bins tick_params annotate quiver contour barh stackplot subplots_adjust axhline axvline semilogx semilogy loglog polar streamplot hexbin pcolor tricontour errorbar clabel set_aspect violinplot set_axis_off spines text hatch plt axis plt.bar() plt.axis import figure pyplot highlight_text pypalettes plt.subplots() xlabel ylabel title legend colorbar savefig tight_layout grid set_xlim set_ylim plot scatter hist boxplot imshow cmap alpha bins tick_params annotate quiver contour barh stackplot subplots_adjust axhline axvline semilogx semilogy loglog polar streamplot hexbin pcolor tricontour errorbar clabel set_aspect violinplot set_axis_off spines text hatch plt axis plt.bar() plt.axis import figure pyplot highlight_text pypalettes plt.subplots() xlabel ylabel title legend colorbar savefig tight_layout grid set_xlim set_ylim plot scatter hist boxplot imshow cmap alpha bins tick_params annotate quiver contour barh stackplot subplots_adjust axhline axvline semilogx semilogy loglog polar streamplot hexbin pcolor tricontour errorbar clabel set_aspect violinplot set_axis_off spines text hatch plt axis plt.bar() plt.axis import figure pyplot highlight_text pypalettes plt.subplots() xlabel ylabel title legend colorbar savefig tight_layout grid set_xlim set_ylim plot scatter hist boxplot imshow cmap alpha bins tick_params annotate quiver contour barh stackplot subplots_adjust axhline axvline semilogx semilogy loglog polar streamplot hexbin pcolor tricontour errorbar clabel set_aspect violinplot set_axis_off spines text hatch plt axis plt.bar() plt.axis import figure pyplot highlight_text pypalettes plt.subplots() xlabel ylabel title legend colorbar savefig tight_layout grid set_xlim set_ylim plot scatter hist boxplot imshow cmap alpha bins tick_params annotate quiver contour barh stackplot subplots_adjust axhline axvline semilogx semilogy loglog polar streamplot hexbin pcolor tricontour errorbar clabel set_aspect violinplot set_axis_off spines text hatch plt axis plt.bar() plt.axis import figure pyplot highlight_text pypalettes plt.subplots() xlabel ylabel title legend colorbar savefig tight_layout grid set_xlim set_ylim plot scatter hist boxplot imshow cmap alpha bins tick_params annotate quiver contour barh stackplot subplots_adjust axhline axvline semilogx semilogy loglog polar streamplot hexbin pcolor tricontour errorbar clabel set_aspect violinplot set_axis_off spines text hatch plt axis plt.bar() plt.axis import figure pyplot highlight_text pypalettes plt.subplots() xlabel ylabel title legend colorbar savefig tight_layout grid set_xlim set_ylim plot scatter hist boxplot imshow cmap alpha bins tick_params annotate quiver contour barh stackplot subplots_adjust axhline axvline semilogx semilogy loglog polar streamplot hexbin pcolor tricontour errorbar clabel set_aspect violinplot set_axis_off spines text hatch plt axis plt.bar() plt.axis import figure pyplot highlight_text pypalettes plt.subplots() xlabel ylabel title legend colorbar savefig tight_layout grid set_xlim set_ylim plot scatter hist boxplot imshow cmap alpha bins tick_params annotate quiver contour barh stackplot subplots_adjust axhline axvline semilogx semilogy loglog polar streamplot hexbin pcolor tricontour errorbar clabel set_aspect violinplot set_axis_off spines text hatch plt axis plt.bar() plt.axis import figure pyplot highlight_text pypalettes plt.subplots() xlabel ylabel title legend colorbar savefig tight_layout grid set_xlim set_ylim plot scatter hist boxplot imshow cmap alpha bins tick_params annotate quiver contour barh stackplot subplots_adjust axhline axvline semilogx semilogy loglog polar streamplot hexbin pcolor tricontour errorbar clabel set_aspect violinplot set_axis_off spines text hatch plt axis plt.bar() plt.axis import figure pyplot highlight_text pypalettes plt.subplots() xlabel ylabel title legend colorbar savefig tight_layout grid set_xlim set_ylim plot scatter hist boxplot imshow cmap alpha bins tick_params annotate quiver contour barh stackplot subplots_adjust axhline axvline semilogx semilogy loglog polar streamplot hexbin pcolor tricontour errorbar clabel set_aspect violinplot set_axis_off spines text hatch plt axis plt.bar() plt.axis import figure pyplot highlight_text pypalettes plt.subplots() xlabel ylabel title legend colorbar savefig tight_layout grid set_xlim set_ylim plot scatter hist boxplot imshow cmap alpha bins tick_params annotate quiver contour barh stackplot subplots_adjust axhline axvline semilogx semilogy loglog polar streamplot hexbin pcolor tricontour errorbar clabel set_aspect violinplot set_axis_off spines text hatch plt axis plt.bar() plt.axis import figure pyplot highlight_text pypalettes plt.subplots() xlabel ylabel title legend colorbar savefig tight_layout grid set_xlim set_ylim plot scatter hist boxplot imshow cmap alpha bins tick_params annotate quiver contour barh stackplot subplots_adjust axhline axvline semilogx semilogy loglog polar streamplot hexbin pcolor tricontour errorbar clabel set_aspect violinplot set_axis_off spines text hatch plt axis plt.bar() plt.axis import figure pyplot highlight_text pypalettes plt.subplots() xlabel ylabel title legend colorbar savefig tight_layout grid set_xlim set_ylim plot scatter hist boxplot imshow cmap alpha bins tick_params annotate quiver contour barh stackplot subplots_adjust axhline axvline semilogx semilogy loglog polar streamplot hexbin pcolor tricontour errorbar clabel set_aspect violinplot set_axis_off spines text hatch plt axis plt.bar() plt.axis import figure pyplot highlight_text pypalettes plt.subplots() xlabel ylabel title legend colorbar savefig tight_layout grid set_xlim set_ylim plot scatter hist boxplot imshow cmap alpha bins tick_params annotate quiver contour barh stackplot subplots_adjust axhline axvline semilogx semilogy loglog polar streamplot hexbin pcolor tricontour errorbar clabel set_aspect violinplot set_axis_off spines text hatch plt axis plt.bar() plt.axis import figure pyplot highlight_text pypalettes plt.subplots() xlabel ylabel title legend colorbar savefig tight_layout grid set_xlim set_ylim plot scatter hist boxplot imshow cmap alpha bins tick_params annotate quiver contour barh stackplot subplots_adjust axhline axvline semilogx semilogy loglog polar streamplot hexbin pcolor tricontour errorbar clabel set_aspect violinplot set_axis_off spines text hatch plt axis plt.bar() plt.axis import figure pyplot highlight_text pypalettes plt.subplots() xlabel ylabel title legend colorbar savefig tight_layout grid set_xlim set_ylim plot scatter hist boxplot imshow cmap alpha bins tick_params annotate quiver contour barh stackplot subplots_adjust axhline axvline semilogx semilogy loglog polar streamplot hexbin pcolor tricontour errorbar clabel set_aspect violinplot set_axis_off spines text hatch plt axis plt.bar() plt.axis import figure pyplot highlight_text pypalettes plt.subplots() xlabel ylabel title legend colorbar savefig tight_layout grid set_xlim set_ylim plot scatter hist boxplot imshow cmap alpha bins tick_params annotate quiver contour barh stackplot subplots_adjust axhline axvline semilogx semilogy loglog polar streamplot hexbin pcolor tricontour errorbar clabel set_aspect violinplot set_axis_off spines text hatch plt axis plt.bar() plt.axis import figure pyplot highlight_text pypalettes plt.subplots() xlabel ylabel title legend colorbar savefig tight_layout grid set_xlim set_ylim plot scatter hist boxplot imshow cmap alpha bins tick_params annotate quiver contour barh stackplot subplots_adjust axhline axvline semilogx semilogy loglog polar streamplot hexbin pcolor tricontour errorbar clabel set_aspect violinplot set_axis_off spines text hatch plt axis plt.bar() plt.axis import figure pyplot highlight_text pypalettes plt.subplots() xlabel ylabel title legend colorbar savefig tight_layout grid set_xlim set_ylim plot scatter hist boxplot imshow cmap alpha bins tick_params annotate quiver contour barh stackplot subplots_adjust axhline axvline semilogx semilogy loglog polar streamplot hexbin pcolor tricontour errorbar clabel set_aspect violinplot set_axis_off spines text hatch plt axis plt.bar() plt.axis import figure pyplot highlight_text pypalettes plt.subplots() xlabel ylabel title legend colorbar savefig tight_layout grid set_xlim set_ylim plot scatter hist boxplot imshow cmap alpha bins tick_params annotate quiver contour barh stackplot subplots_adjust axhline axvline semilogx semilogy loglog polar streamplot hexbin pcolor tricontour errorbar clabel set_aspect violinplot set_axis_off spines text hatch plt axis plt.bar() plt.axis import figure pyplot highlight_text pypalettes plt.subplots() xlabel ylabel title legend colorbar savefig tight_layout grid set_xlim set_ylim plot scatter hist boxplot imshow cmap alpha bins tick_params annotate quiver contour barh stackplot subplots_adjust axhline axvline semilogx semilogy loglog polar streamplot hexbin pcolor tricontour errorbar clabel set_aspect violinplot set_axis_off spines text hatch plt axis plt.bar() plt.axis import figure pyplot highlight_text pypalettes plt.subplots() xlabel ylabel title legend colorbar savefig tight_layout grid set_xlim set_ylim plot scatter hist boxplot imshow cmap alpha bins tick_params annotate quiver contour barh stackplot subplots_adjust axhline axvline semilogx semilogy loglog polar streamplot hexbin pcolor tricontour errorbar clabel set_aspect violinplot set_axis_off spines text hatch plt axis plt.bar() plt.axis import figure pyplot highlight_text pypalettes plt.subplots() xlabel ylabel title legend colorbar savefig tight_layout grid set_xlim set_ylim plot scatter hist boxplot imshow cmap alpha bins tick_params annotate quiver contour barh stackplot subplots_adjust axhline axvline semilogx semilogy loglog polar streamplot hexbin pcolor tricontour errorbar clabel set_aspect violinplot set_axis_off spines text hatch plt axis plt.bar() plt.axis import figure pyplot highlight_text pypalettes plt.subplots() xlabel ylabel title legend colorbar savefig tight_layout grid set_xlim set_ylim plot scatter hist boxplot imshow cmap alpha bins tick_params annotate quiver contour barh stackplot subplots_adjust axhline axvline semilogx semilogy loglog polar streamplot hexbin pcolor tricontour errorbar clabel set_aspect violinplot set_axis_off spines text hatch plt axis plt.bar() plt.axis import figure pyplot highlight_text pypalettes plt.subplots() xlabel ylabel title legend colorbar savefig tight_layout grid set_xlim set_ylim plot scatter hist boxplot imshow cmap alpha bins tick_params annotate quiver contour barh stackplot subplots_adjust axhline axvline semilogx semilogy loglog polar streamplot hexbin pcolor tricontour errorbar clabel set_aspect violinplot set_axis_off spines text hatch plt axis plt.bar() plt.axis import figure pyplot highlight_text pypalettes plt.subplots() xlabel ylabel title legend colorbar savefig tight_layout grid set_xlim set_ylim plot scatter hist boxplot imshow cmap alpha bins tick_params annotate quiver contour barh stackplot subplots_adjust axhline axvline semilogx semilogy loglog polar streamplot hexbin pcolor tricontour errorbar clabel set_aspect violinplot set_axis_off spines text hatch plt axis plt.bar() plt.axis import figure pyplot highlight_text pypalettes plt.subplots() xlabel ylabel title legend colorbar savefig tight_layout grid set_xlim set_ylim plot scatter hist boxplot imshow cmap alpha bins tick_params annotate quiver contour barh stackplot subplots_adjust axhline axvline semilogx semilogy loglog polar streamplot hexbin pcolor tricontour errorbar clabel set_aspect violinplot set_axis_off spines text hatch plt axis plt.bar() plt.axis import figure pyplot highlight_text pypalettes plt.subplots() xlabel ylabel title legend colorbar savefig tight_layout grid set_xlim set_ylim plot scatter hist boxplot imshow cmap alpha bins tick_params annotate quiver contour barh stackplot subplots_adjust axhline axvline semilogx semilogy loglog polar streamplot hexbin pcolor tricontour errorbar clabel set_aspect violinplot set_axis_off spines text hatch plt axis plt.bar() plt.axis import figure pyplot highlight_text pypalettes plt.subplots() xlabel ylabel title legend colorbar savefig tight_layout grid set_xlim set_ylim plot scatter hist boxplot imshow cmap alpha bins tick_params annotate quiver contour barh stackplot subplots_adjust axhline axvline semilogx semilogy loglog polar streamplot hexbin pcolor tricontour errorbar clabel set_aspect violinplot set_axis_off spines text hatch plt axis plt.bar() plt.axis import figure pyplot highlight_text pypalettes plt.subplots() xlabel ylabel title legend colorbar savefig tight_layout grid set_xlim set_ylim plot scatter hist boxplot imshow cmap alpha bins tick_params annotate quiver contour barh stackplot subplots_adjust axhline axvline semilogx semilogy loglog polar streamplot hexbin pcolor tricontour errorbar clabel set_aspect violinplot set_axis_off spines text hatch plt axis plt.bar() plt.axis import figure pyplot highlight_text pypalettes plt.subplots() xlabel ylabel title legend colorbar savefig tight_layout grid set_xlim set_ylim plot scatter hist boxplot imshow cmap alpha bins tick_params annotate quiver contour barh stackplot subplots_adjust axhline axvline semilogx semilogy loglog polar streamplot hexbin pcolor tricontour errorbar clabel set_aspect violinplot set_axis_off spines text hatch plt axis plt.bar() plt.axis import figure pyplot highlight_text pypalettes plt.subplots() xlabel ylabel title legend colorbar savefig tight_layout grid set_xlim set_ylim plot scatter hist boxplot imshow cmap alpha bins tick_params annotate quiver contour barh stackplot subplots_adjust axhline axvline semilogx semilogy loglog polar streamplot hexbin pcolor tricontour errorbar clabel set_aspect violinplot set_axis_off spines text hatch plt axis plt.bar() plt.axis import figure pyplot highlight_text pypalettes plt.subplots() xlabel ylabel title legend colorbar savefig tight_layout grid set_xlim set_ylim plot scatter hist boxplot imshow cmap alpha bins tick_params annotate quiver contour barh stackplot subplots_adjust axhline axvline semilogx semilogy loglog polar streamplot hexbin pcolor tricontour errorbar clabel set_aspect violinplot set_axis_off spines text hatch plt axis plt.bar() plt.axis import figure pyplot highlight_text pypalettes plt.subplots() xlabel ylabel title legend colorbar savefig tight_layout grid set_xlim set_ylim plot scatter hist boxplot imshow cmap alpha bins tick_params annotate quiver contour barh stackplot subplots_adjust axhline axvline semilogx semilogy loglog polar streamplot hexbin pcolor tricontour errorbar clabel set_aspect violinplot set_axis_off spines text hatch plt axis plt.bar() plt.axis import figure pyplot highlight_text pypalettes plt.subplots() xlabel ylabel title legend colorbar savefig tight_layout grid set_xlim set_ylim plot scatter hist boxplot imshow cmap alpha bins tick_params annotate quiver contour barh stackplot subplots_adjust axhline axvline semilogx semilogy loglog polar streamplot hexbin pcolor tricontour errorbar clabel set_aspect violinplot set_axis_off spines text hatch plt axis plt.bar() plt.axis import figure pyplot highlight_text pypalettes plt.subplots() xlabel ylabel title legend colorbar savefig tight_layout grid set_xlim set_ylim plot scatter hist boxplot imshow cmap alpha bins tick_params annotate quiver contour barh stackplot subplots_adjust axhline axvline semilogx semilogy loglog polar streamplot hexbin pcolor tricontour errorbar clabel set_aspect violinplot set_axis_off spines text hatch plt axis plt.bar() plt.axis import figure pyplot highlight_text pypalettes plt.subplots() xlabel ylabel title legend colorbar savefig tight_layout grid set_xlim set_ylim plot scatter hist boxplot imshow cmap alpha bins tick_params annotate quiver contour barh stackplot subplots_adjust axhline axvline semilogx semilogy loglog polar streamplot hexbin pcolor tricontour errorbar clabel set_aspect violinplot set_axis_off spines text hatch plt axis plt.bar() plt.axis import figure pyplot highlight_text pypalettes plt.subplots() xlabel ylabel title legend colorbar savefig tight_layout grid set_xlim set_ylim plot scatter hist boxplot imshow cmap alpha bins tick_params annotate quiver contour barh stackplot subplots_adjust axhline axvline semilogx semilogy loglog polar streamplot hexbin pcolor tricontour errorbar clabel set_aspect violinplot set_axis_off spines text hatch plt axis plt.bar() plt.axis import figure pyplot highlight_text pypalettes plt.subplots() xlabel ylabel title legend colorbar savefig tight_layout grid set_xlim set_ylim plot scatter hist boxplot imshow cmap alpha bins tick_params annotate quiver contour barh stackplot subplots_adjust axhline axvline semilogx semilogy loglog polar streamplot hexbin pcolor tricontour errorbar clabel set_aspect violinplot set_axis_off spines text hatch plt axis plt.bar() plt.axis import figure pyplot highlight_text pypalettes plt.subplots() xlabel ylabel title legend colorbar savefig tight_layout grid set_xlim set_ylim plot scatter hist boxplot imshow cmap alpha bins tick_params annotate quiver contour barh stackplot subplots_adjust axhline axvline semilogx semilogy loglog polar streamplot hexbin pcolor tricontour errorbar clabel set_aspect violinplot set_axis_off spines text hatch plt axis plt.bar() plt.axis import figure pyplot highlight_text pypalettes plt.subplots() xlabel ylabel title legend colorbar savefig tight_layout grid set_xlim set_ylim plot scatter hist boxplot imshow cmap alpha bins tick_params annotate quiver contour barh stackplot subplots_adjust axhline axvline semilogx semilogy loglog polar streamplot hexbin pcolor tricontour errorbar clabel set_aspect violinplot set_axis_off spines text hatch plt axis plt.bar() plt.axis import figure pyplot highlight_text pypalettes plt.subplots() xlabel ylabel title legend colorbar savefig tight_layout grid set_xlim set_ylim plot scatter hist boxplot imshow cmap alpha bins tick_params annotate quiver contour barh stackplot subplots_adjust axhline axvline semilogx semilogy loglog polar streamplot hexbin pcolor tricontour errorbar clabel set_aspect violinplot set_axis_off spines text hatch plt axis plt.bar() plt.axis import figure pyplot highlight_text pypalettes plt.subplots() xlabel ylabel title legend colorbar savefig tight_layout grid set_xlim set_ylim plot scatter hist boxplot imshow cmap alpha bins tick_params annotate quiver contour barh stackplot subplots_adjust axhline axvline semilogx semilogy loglog polar streamplot hexbin pcolor tricontour errorbar clabel set_aspect violinplot set_axis_off spines text hatch plt axis plt.bar() plt.axis import figure pyplot highlight_text pypalettes plt.subplots() xlabel ylabel title legend colorbar savefig tight_layout grid set_xlim set_ylim plot scatter hist boxplot imshow cmap alpha bins tick_params annotate quiver contour barh stackplot subplots_adjust axhline axvline semilogx semilogy loglog polar streamplot hexbin pcolor tricontour errorbar clabel set_aspect violinplot set_axis_off spines text hatch plt axis plt.bar() plt.axis import figure pyplot highlight_text pypalettes plt.subplots() xlabel ylabel title legend colorbar savefig tight_layout grid set_xlim set_ylim plot scatter hist boxplot imshow cmap alpha bins tick_params annotate quiver contour barh stackplot subplots_adjust axhline axvline semilogx semilogy loglog polar streamplot hexbin pcolor tricontour errorbar clabel set_aspect violinplot set_axis_off spines text hatch plt axis plt.bar() plt.axis import figure pyplot highlight_text pypalettes plt.subplots() xlabel ylabel title legend colorbar savefig tight_layout grid set_xlim set_ylim plot scatter hist boxplot imshow cmap alpha bins tick_params annotate quiver contour barh stackplot subplots_adjust axhline axvline semilogx semilogy loglog polar streamplot hexbin pcolor tricontour errorbar clabel set_aspect violinplot set_axis_off spines text hatch plt axis plt.bar() plt.axis import figure pyplot highlight_text pypalettes plt.subplots() xlabel ylabel title legend colorbar savefig tight_layout grid set_xlim set_ylim plot scatter hist boxplot imshow cmap alpha bins tick_params annotate quiver contour barh stackplot subplots_adjust axhline axvline semilogx semilogy loglog polar streamplot hexbin pcolor tricontour errorbar clabel set_aspect violinplot set_axis_off spines text hatch plt axis plt.bar() plt.axis import figure pyplot highlight_text pypalettes plt.subplots() xlabel ylabel title legend colorbar savefig tight_layout grid set_xlim set_ylim plot scatter hist boxplot imshow cmap alpha bins tick_params annotate quiver contour barh stackplot subplots_adjust axhline axvline semilogx semilogy loglog polar streamplot hexbin pcolor tricontour errorbar clabel set_aspect violinplot set_axis_off spines text hatch plt axis plt.bar() plt.axis import figure pyplot highlight_text pypalettes plt.subplots() xlabel ylabel title legend colorbar savefig tight_layout grid set_xlim set_ylim plot scatter hist boxplot imshow cmap alpha bins tick_params annotate quiver contour barh stackplot subplots_adjust axhline axvline semilogx semilogy loglog polar streamplot hexbin pcolor tricontour errorbar clabel set_aspect violinplot set_axis_off spines text hatch plt axis plt.bar() plt.axis import figure pyplot highlight_text pypalettes plt.subplots() xlabel ylabel title legend colorbar savefig tight_layout grid set_xlim set_ylim plot scatter hist boxplot imshow cmap alpha bins tick_params annotate quiver contour barh stackplot subplots_adjust axhline axvline semilogx semilogy loglog polar streamplot hexbin pcolor tricontour errorbar clabel set_aspect violinplot set_axis_off spines text hatch plt axis plt.bar() plt.axis import figure pyplot highlight_text pypalettes plt.subplots() xlabel ylabel title legend colorbar savefig tight_layout grid set_xlim set_ylim plot scatter hist boxplot imshow cmap alpha bins tick_params annotate quiver contour barh stackplot subplots_adjust axhline axvline semilogx semilogy loglog polar streamplot hexbin pcolor tricontour errorbar clabel set_aspect violinplot set_axis_off spines text hatch plt axis plt.bar() plt.axis import figure pyplot highlight_text pypalettes plt.subplots() xlabel ylabel title legend colorbar savefig tight_layout grid set_xlim set_ylim plot scatter hist boxplot imshow cmap alpha bins tick_params annotate quiver contour barh stackplot subplots_adjust axhline axvline semilogx semilogy loglog polar streamplot hexbin pcolor tricontour errorbar clabel set_aspect violinplot set_axis_off spines text hatch plt axis plt.bar() plt.axis import figure pyplot highlight_text pypalettes plt.subplots() xlabel ylabel title legend colorbar savefig tight_layout grid set_xlim set_ylim plot scatter hist boxplot imshow cmap alpha bins tick_params annotate quiver contour barh stackplot subplots_adjust axhline axvline semilogx semilogy loglog polar streamplot hexbin pcolor tricontour errorbar clabel set_aspect violinplot set_axis_off spines text hatch plt axis plt.bar() plt.axis import figure pyplot highlight_text pypalettes plt.subplots() xlabel ylabel title legend colorbar savefig tight_layout grid set_xlim set_ylim plot scatter hist boxplot imshow cmap alpha bins tick_params annotate quiver contour barh stackplot subplots_adjust axhline axvline semilogx semilogy loglog polar streamplot hexbin pcolor tricontour errorbar clabel set_aspect violinplot set_axis_off spines text hatch plt axis plt.bar() plt.axis import figure pyplot highlight_text pypalettes plt.subplots() xlabel ylabel title legend colorbar savefig tight_layout grid set_xlim set_ylim plot scatter hist boxplot imshow cmap alpha bins tick_params annotate quiver contour barh stackplot subplots_adjust axhline axvline semilogx semilogy loglog polar streamplot hexbin pcolor tricontour errorbar clabel set_aspect violinplot set_axis_off spines text hatch
Object oriented programming
In Matplotlib, most chart elements are actually Artists: a specialized class in Matplotlib. Almost everything you see on a chart inherits from the base Artist class.
Because of this, understanding how to work with classes is essential to mastering Matplotlib. This lesson introduces Object-Oriented Programming (OOP) in Python, showing how classes are used to create and control chart elements.
How to create and use classes
In Python (and many other programming languages), you can create a special kind of object named a class. You might not be aware of it, but we're using them all the time!
It allows us to do things like this:
Here, Human is a class and Julia is an instance of it.
The code under the hood here would look like so:
Loading...
First we define the Human class, and then create an "instance" of it. With this instance, we can call the functions (or "methods") defined inside our Human class.
The __init__ function defines what happens when we create an instance of the class. In the previous example it just adds the "name" attribute to the instance.
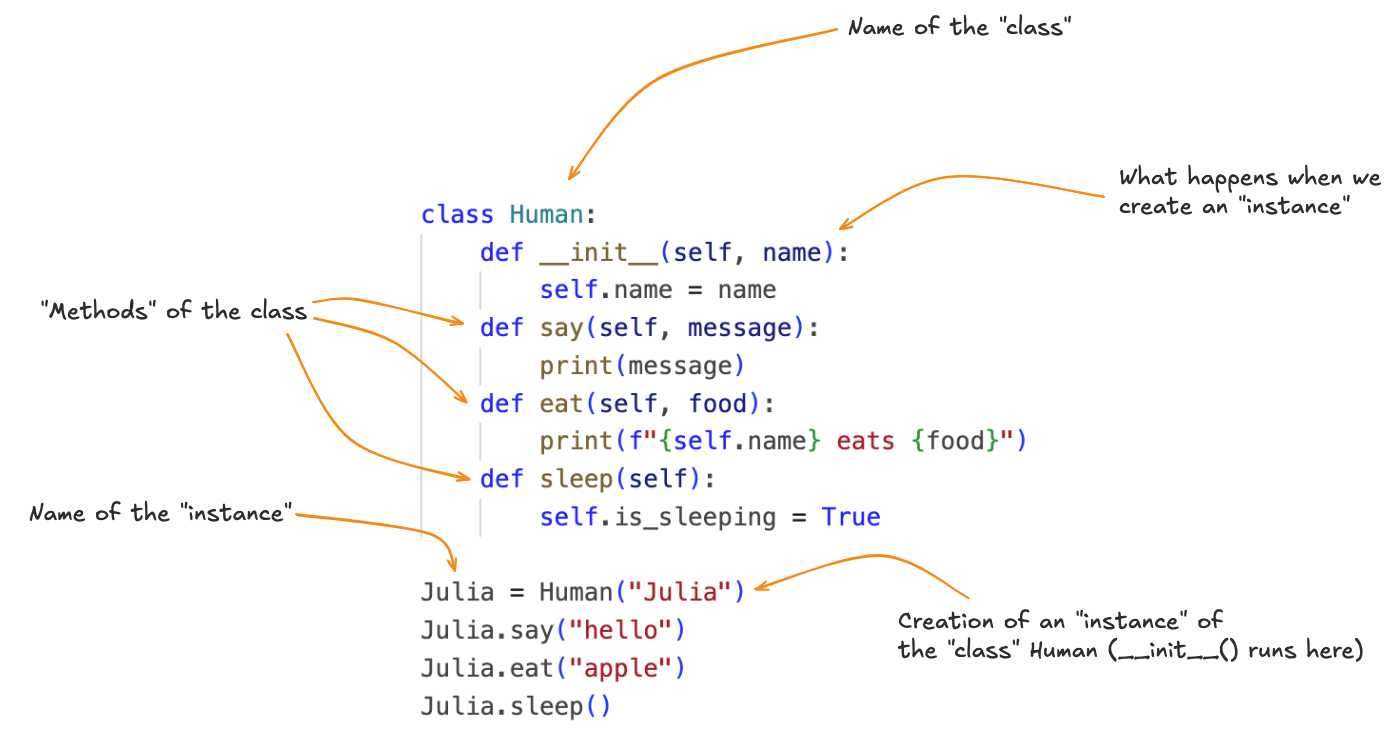
The self keyword omnipresent here can be confusing at first, but it only represents the instance itself (the object created by the user)
Inheritance
A thing you can do with classes is inheritance. In short, it means creating a new class that automatically gets all the features of an existing one without rewriting the same code.
For example, imagine we want a Programmer class. A programmer is still a human (some people might disagree with this 🙃), so it should have all the things a Human can do: talk, eat, sleep. They are a specific kind of human that have unique skills like writing code.
Oh no! 😱
It seems like you haven’t enrolled in the course yet!
Join many other students today and become the matplotlib expert your company needs!
Or Login