plt axis plt.bar() plt.axis import figure pyplot highlight_text pypalettes plt.subplots() xlabel ylabel title legend colorbar savefig tight_layout grid set_xlim set_ylim plot scatter hist boxplot imshow cmap alpha bins tick_params annotate quiver contour barh stackplot subplots_adjust axhline axvline semilogx semilogy loglog polar streamplot hexbin pcolor tricontour errorbar clabel set_aspect violinplot set_axis_off spines text hatch plt axis plt.bar() plt.axis import figure pyplot highlight_text pypalettes plt.subplots() xlabel ylabel title legend colorbar savefig tight_layout grid set_xlim set_ylim plot scatter hist boxplot imshow cmap alpha bins tick_params annotate quiver contour barh stackplot subplots_adjust axhline axvline semilogx semilogy loglog polar streamplot hexbin pcolor tricontour errorbar clabel set_aspect violinplot set_axis_off spines text hatch plt axis plt.bar() plt.axis import figure pyplot highlight_text pypalettes plt.subplots() xlabel ylabel title legend colorbar savefig tight_layout grid set_xlim set_ylim plot scatter hist boxplot imshow cmap alpha bins tick_params annotate quiver contour barh stackplot subplots_adjust axhline axvline semilogx semilogy loglog polar streamplot hexbin pcolor tricontour errorbar clabel set_aspect violinplot set_axis_off spines text hatch plt axis plt.bar() plt.axis import figure pyplot highlight_text pypalettes plt.subplots() xlabel ylabel title legend colorbar savefig tight_layout grid set_xlim set_ylim plot scatter hist boxplot imshow cmap alpha bins tick_params annotate quiver contour barh stackplot subplots_adjust axhline axvline semilogx semilogy loglog polar streamplot hexbin pcolor tricontour errorbar clabel set_aspect violinplot set_axis_off spines text hatch plt axis plt.bar() plt.axis import figure pyplot highlight_text pypalettes plt.subplots() xlabel ylabel title legend colorbar savefig tight_layout grid set_xlim set_ylim plot scatter hist boxplot imshow cmap alpha bins tick_params annotate quiver contour barh stackplot subplots_adjust axhline axvline semilogx semilogy loglog polar streamplot hexbin pcolor tricontour errorbar clabel set_aspect violinplot set_axis_off spines text hatch plt axis plt.bar() plt.axis import figure pyplot highlight_text pypalettes plt.subplots() xlabel ylabel title legend colorbar savefig tight_layout grid set_xlim set_ylim plot scatter hist boxplot imshow cmap alpha bins tick_params annotate quiver contour barh stackplot subplots_adjust axhline axvline semilogx semilogy loglog polar streamplot hexbin pcolor tricontour errorbar clabel set_aspect violinplot set_axis_off spines text hatch plt axis plt.bar() plt.axis import figure pyplot highlight_text pypalettes plt.subplots() xlabel ylabel title legend colorbar savefig tight_layout grid set_xlim set_ylim plot scatter hist boxplot imshow cmap alpha bins tick_params annotate quiver contour barh stackplot subplots_adjust axhline axvline semilogx semilogy loglog polar streamplot hexbin pcolor tricontour errorbar clabel set_aspect violinplot set_axis_off spines text hatch plt axis plt.bar() plt.axis import figure pyplot highlight_text pypalettes plt.subplots() xlabel ylabel title legend colorbar savefig tight_layout grid set_xlim set_ylim plot scatter hist boxplot imshow cmap alpha bins tick_params annotate quiver contour barh stackplot subplots_adjust axhline axvline semilogx semilogy loglog polar streamplot hexbin pcolor tricontour errorbar clabel set_aspect violinplot set_axis_off spines text hatch plt axis plt.bar() plt.axis import figure pyplot highlight_text pypalettes plt.subplots() xlabel ylabel title legend colorbar savefig tight_layout grid set_xlim set_ylim plot scatter hist boxplot imshow cmap alpha bins tick_params annotate quiver contour barh stackplot subplots_adjust axhline axvline semilogx semilogy loglog polar streamplot hexbin pcolor tricontour errorbar clabel set_aspect violinplot set_axis_off spines text hatch plt axis plt.bar() plt.axis import figure pyplot highlight_text pypalettes plt.subplots() xlabel ylabel title legend colorbar savefig tight_layout grid set_xlim set_ylim plot scatter hist boxplot imshow cmap alpha bins tick_params annotate quiver contour barh stackplot subplots_adjust axhline axvline semilogx semilogy loglog polar streamplot hexbin pcolor tricontour errorbar clabel set_aspect violinplot set_axis_off spines text hatch plt axis plt.bar() plt.axis import figure pyplot highlight_text pypalettes plt.subplots() xlabel ylabel title legend colorbar savefig tight_layout grid set_xlim set_ylim plot scatter hist boxplot imshow cmap alpha bins tick_params annotate quiver contour barh stackplot subplots_adjust axhline axvline semilogx semilogy loglog polar streamplot hexbin pcolor tricontour errorbar clabel set_aspect violinplot set_axis_off spines text hatch plt axis plt.bar() plt.axis import figure pyplot highlight_text pypalettes plt.subplots() xlabel ylabel title legend colorbar savefig tight_layout grid set_xlim set_ylim plot scatter hist boxplot imshow cmap alpha bins tick_params annotate quiver contour barh stackplot subplots_adjust axhline axvline semilogx semilogy loglog polar streamplot hexbin pcolor tricontour errorbar clabel set_aspect violinplot set_axis_off spines text hatch plt axis plt.bar() plt.axis import figure pyplot highlight_text pypalettes plt.subplots() xlabel ylabel title legend colorbar savefig tight_layout grid set_xlim set_ylim plot scatter hist boxplot imshow cmap alpha bins tick_params annotate quiver contour barh stackplot subplots_adjust axhline axvline semilogx semilogy loglog polar streamplot hexbin pcolor tricontour errorbar clabel set_aspect violinplot set_axis_off spines text hatch plt axis plt.bar() plt.axis import figure pyplot highlight_text pypalettes plt.subplots() xlabel ylabel title legend colorbar savefig tight_layout grid set_xlim set_ylim plot scatter hist boxplot imshow cmap alpha bins tick_params annotate quiver contour barh stackplot subplots_adjust axhline axvline semilogx semilogy loglog polar streamplot hexbin pcolor tricontour errorbar clabel set_aspect violinplot set_axis_off spines text hatch plt axis plt.bar() plt.axis import figure pyplot highlight_text pypalettes plt.subplots() xlabel ylabel title legend colorbar savefig tight_layout grid set_xlim set_ylim plot scatter hist boxplot imshow cmap alpha bins tick_params annotate quiver contour barh stackplot subplots_adjust axhline axvline semilogx semilogy loglog polar streamplot hexbin pcolor tricontour errorbar clabel set_aspect violinplot set_axis_off spines text hatch plt axis plt.bar() plt.axis import figure pyplot highlight_text pypalettes plt.subplots() xlabel ylabel title legend colorbar savefig tight_layout grid set_xlim set_ylim plot scatter hist boxplot imshow cmap alpha bins tick_params annotate quiver contour barh stackplot subplots_adjust axhline axvline semilogx semilogy loglog polar streamplot hexbin pcolor tricontour errorbar clabel set_aspect violinplot set_axis_off spines text hatch plt axis plt.bar() plt.axis import figure pyplot highlight_text pypalettes plt.subplots() xlabel ylabel title legend colorbar savefig tight_layout grid set_xlim set_ylim plot scatter hist boxplot imshow cmap alpha bins tick_params annotate quiver contour barh stackplot subplots_adjust axhline axvline semilogx semilogy loglog polar streamplot hexbin pcolor tricontour errorbar clabel set_aspect violinplot set_axis_off spines text hatch plt axis plt.bar() plt.axis import figure pyplot highlight_text pypalettes plt.subplots() xlabel ylabel title legend colorbar savefig tight_layout grid set_xlim set_ylim plot scatter hist boxplot imshow cmap alpha bins tick_params annotate quiver contour barh stackplot subplots_adjust axhline axvline semilogx semilogy loglog polar streamplot hexbin pcolor tricontour errorbar clabel set_aspect violinplot set_axis_off spines text hatch plt axis plt.bar() plt.axis import figure pyplot highlight_text pypalettes plt.subplots() xlabel ylabel title legend colorbar savefig tight_layout grid set_xlim set_ylim plot scatter hist boxplot imshow cmap alpha bins tick_params annotate quiver contour barh stackplot subplots_adjust axhline axvline semilogx semilogy loglog polar streamplot hexbin pcolor tricontour errorbar clabel set_aspect violinplot set_axis_off spines text hatch plt axis plt.bar() plt.axis import figure pyplot highlight_text pypalettes plt.subplots() xlabel ylabel title legend colorbar savefig tight_layout grid set_xlim set_ylim plot scatter hist boxplot imshow cmap alpha bins tick_params annotate quiver contour barh stackplot subplots_adjust axhline axvline semilogx semilogy loglog polar streamplot hexbin pcolor tricontour errorbar clabel set_aspect violinplot set_axis_off spines text hatch plt axis plt.bar() plt.axis import figure pyplot highlight_text pypalettes plt.subplots() xlabel ylabel title legend colorbar savefig tight_layout grid set_xlim set_ylim plot scatter hist boxplot imshow cmap alpha bins tick_params annotate quiver contour barh stackplot subplots_adjust axhline axvline semilogx semilogy loglog polar streamplot hexbin pcolor tricontour errorbar clabel set_aspect violinplot set_axis_off spines text hatch plt axis plt.bar() plt.axis import figure pyplot highlight_text pypalettes plt.subplots() xlabel ylabel title legend colorbar savefig tight_layout grid set_xlim set_ylim plot scatter hist boxplot imshow cmap alpha bins tick_params annotate quiver contour barh stackplot subplots_adjust axhline axvline semilogx semilogy loglog polar streamplot hexbin pcolor tricontour errorbar clabel set_aspect violinplot set_axis_off spines text hatch plt axis plt.bar() plt.axis import figure pyplot highlight_text pypalettes plt.subplots() xlabel ylabel title legend colorbar savefig tight_layout grid set_xlim set_ylim plot scatter hist boxplot imshow cmap alpha bins tick_params annotate quiver contour barh stackplot subplots_adjust axhline axvline semilogx semilogy loglog polar streamplot hexbin pcolor tricontour errorbar clabel set_aspect violinplot set_axis_off spines text hatch plt axis plt.bar() plt.axis import figure pyplot highlight_text pypalettes plt.subplots() xlabel ylabel title legend colorbar savefig tight_layout grid set_xlim set_ylim plot scatter hist boxplot imshow cmap alpha bins tick_params annotate quiver contour barh stackplot subplots_adjust axhline axvline semilogx semilogy loglog polar streamplot hexbin pcolor tricontour errorbar clabel set_aspect violinplot set_axis_off spines text hatch plt axis plt.bar() plt.axis import figure pyplot highlight_text pypalettes plt.subplots() xlabel ylabel title legend colorbar savefig tight_layout grid set_xlim set_ylim plot scatter hist boxplot imshow cmap alpha bins tick_params annotate quiver contour barh stackplot subplots_adjust axhline axvline semilogx semilogy loglog polar streamplot hexbin pcolor tricontour errorbar clabel set_aspect violinplot set_axis_off spines text hatch plt axis plt.bar() plt.axis import figure pyplot highlight_text pypalettes plt.subplots() xlabel ylabel title legend colorbar savefig tight_layout grid set_xlim set_ylim plot scatter hist boxplot imshow cmap alpha bins tick_params annotate quiver contour barh stackplot subplots_adjust axhline axvline semilogx semilogy loglog polar streamplot hexbin pcolor tricontour errorbar clabel set_aspect violinplot set_axis_off spines text hatch plt axis plt.bar() plt.axis import figure pyplot highlight_text pypalettes plt.subplots() xlabel ylabel title legend colorbar savefig tight_layout grid set_xlim set_ylim plot scatter hist boxplot imshow cmap alpha bins tick_params annotate quiver contour barh stackplot subplots_adjust axhline axvline semilogx semilogy loglog polar streamplot hexbin pcolor tricontour errorbar clabel set_aspect violinplot set_axis_off spines text hatch plt axis plt.bar() plt.axis import figure pyplot highlight_text pypalettes plt.subplots() xlabel ylabel title legend colorbar savefig tight_layout grid set_xlim set_ylim plot scatter hist boxplot imshow cmap alpha bins tick_params annotate quiver contour barh stackplot subplots_adjust axhline axvline semilogx semilogy loglog polar streamplot hexbin pcolor tricontour errorbar clabel set_aspect violinplot set_axis_off spines text hatch plt axis plt.bar() plt.axis import figure pyplot highlight_text pypalettes plt.subplots() xlabel ylabel title legend colorbar savefig tight_layout grid set_xlim set_ylim plot scatter hist boxplot imshow cmap alpha bins tick_params annotate quiver contour barh stackplot subplots_adjust axhline axvline semilogx semilogy loglog polar streamplot hexbin pcolor tricontour errorbar clabel set_aspect violinplot set_axis_off spines text hatch plt axis plt.bar() plt.axis import figure pyplot highlight_text pypalettes plt.subplots() xlabel ylabel title legend colorbar savefig tight_layout grid set_xlim set_ylim plot scatter hist boxplot imshow cmap alpha bins tick_params annotate quiver contour barh stackplot subplots_adjust axhline axvline semilogx semilogy loglog polar streamplot hexbin pcolor tricontour errorbar clabel set_aspect violinplot set_axis_off spines text hatch plt axis plt.bar() plt.axis import figure pyplot highlight_text pypalettes plt.subplots() xlabel ylabel title legend colorbar savefig tight_layout grid set_xlim set_ylim plot scatter hist boxplot imshow cmap alpha bins tick_params annotate quiver contour barh stackplot subplots_adjust axhline axvline semilogx semilogy loglog polar streamplot hexbin pcolor tricontour errorbar clabel set_aspect violinplot set_axis_off spines text hatch plt axis plt.bar() plt.axis import figure pyplot highlight_text pypalettes plt.subplots() xlabel ylabel title legend colorbar savefig tight_layout grid set_xlim set_ylim plot scatter hist boxplot imshow cmap alpha bins tick_params annotate quiver contour barh stackplot subplots_adjust axhline axvline semilogx semilogy loglog polar streamplot hexbin pcolor tricontour errorbar clabel set_aspect violinplot set_axis_off spines text hatch plt axis plt.bar() plt.axis import figure pyplot highlight_text pypalettes plt.subplots() xlabel ylabel title legend colorbar savefig tight_layout grid set_xlim set_ylim plot scatter hist boxplot imshow cmap alpha bins tick_params annotate quiver contour barh stackplot subplots_adjust axhline axvline semilogx semilogy loglog polar streamplot hexbin pcolor tricontour errorbar clabel set_aspect violinplot set_axis_off spines text hatch plt axis plt.bar() plt.axis import figure pyplot highlight_text pypalettes plt.subplots() xlabel ylabel title legend colorbar savefig tight_layout grid set_xlim set_ylim plot scatter hist boxplot imshow cmap alpha bins tick_params annotate quiver contour barh stackplot subplots_adjust axhline axvline semilogx semilogy loglog polar streamplot hexbin pcolor tricontour errorbar clabel set_aspect violinplot set_axis_off spines text hatch plt axis plt.bar() plt.axis import figure pyplot highlight_text pypalettes plt.subplots() xlabel ylabel title legend colorbar savefig tight_layout grid set_xlim set_ylim plot scatter hist boxplot imshow cmap alpha bins tick_params annotate quiver contour barh stackplot subplots_adjust axhline axvline semilogx semilogy loglog polar streamplot hexbin pcolor tricontour errorbar clabel set_aspect violinplot set_axis_off spines text hatch plt axis plt.bar() plt.axis import figure pyplot highlight_text pypalettes plt.subplots() xlabel ylabel title legend colorbar savefig tight_layout grid set_xlim set_ylim plot scatter hist boxplot imshow cmap alpha bins tick_params annotate quiver contour barh stackplot subplots_adjust axhline axvline semilogx semilogy loglog polar streamplot hexbin pcolor tricontour errorbar clabel set_aspect violinplot set_axis_off spines text hatch plt axis plt.bar() plt.axis import figure pyplot highlight_text pypalettes plt.subplots() xlabel ylabel title legend colorbar savefig tight_layout grid set_xlim set_ylim plot scatter hist boxplot imshow cmap alpha bins tick_params annotate quiver contour barh stackplot subplots_adjust axhline axvline semilogx semilogy loglog polar streamplot hexbin pcolor tricontour errorbar clabel set_aspect violinplot set_axis_off spines text hatch plt axis plt.bar() plt.axis import figure pyplot highlight_text pypalettes plt.subplots() xlabel ylabel title legend colorbar savefig tight_layout grid set_xlim set_ylim plot scatter hist boxplot imshow cmap alpha bins tick_params annotate quiver contour barh stackplot subplots_adjust axhline axvline semilogx semilogy loglog polar streamplot hexbin pcolor tricontour errorbar clabel set_aspect violinplot set_axis_off spines text hatch plt axis plt.bar() plt.axis import figure pyplot highlight_text pypalettes plt.subplots() xlabel ylabel title legend colorbar savefig tight_layout grid set_xlim set_ylim plot scatter hist boxplot imshow cmap alpha bins tick_params annotate quiver contour barh stackplot subplots_adjust axhline axvline semilogx semilogy loglog polar streamplot hexbin pcolor tricontour errorbar clabel set_aspect violinplot set_axis_off spines text hatch plt axis plt.bar() plt.axis import figure pyplot highlight_text pypalettes plt.subplots() xlabel ylabel title legend colorbar savefig tight_layout grid set_xlim set_ylim plot scatter hist boxplot imshow cmap alpha bins tick_params annotate quiver contour barh stackplot subplots_adjust axhline axvline semilogx semilogy loglog polar streamplot hexbin pcolor tricontour errorbar clabel set_aspect violinplot set_axis_off spines text hatch plt axis plt.bar() plt.axis import figure pyplot highlight_text pypalettes plt.subplots() xlabel ylabel title legend colorbar savefig tight_layout grid set_xlim set_ylim plot scatter hist boxplot imshow cmap alpha bins tick_params annotate quiver contour barh stackplot subplots_adjust axhline axvline semilogx semilogy loglog polar streamplot hexbin pcolor tricontour errorbar clabel set_aspect violinplot set_axis_off spines text hatch plt axis plt.bar() plt.axis import figure pyplot highlight_text pypalettes plt.subplots() xlabel ylabel title legend colorbar savefig tight_layout grid set_xlim set_ylim plot scatter hist boxplot imshow cmap alpha bins tick_params annotate quiver contour barh stackplot subplots_adjust axhline axvline semilogx semilogy loglog polar streamplot hexbin pcolor tricontour errorbar clabel set_aspect violinplot set_axis_off spines text hatch plt axis plt.bar() plt.axis import figure pyplot highlight_text pypalettes plt.subplots() xlabel ylabel title legend colorbar savefig tight_layout grid set_xlim set_ylim plot scatter hist boxplot imshow cmap alpha bins tick_params annotate quiver contour barh stackplot subplots_adjust axhline axvline semilogx semilogy loglog polar streamplot hexbin pcolor tricontour errorbar clabel set_aspect violinplot set_axis_off spines text hatch plt axis plt.bar() plt.axis import figure pyplot highlight_text pypalettes plt.subplots() xlabel ylabel title legend colorbar savefig tight_layout grid set_xlim set_ylim plot scatter hist boxplot imshow cmap alpha bins tick_params annotate quiver contour barh stackplot subplots_adjust axhline axvline semilogx semilogy loglog polar streamplot hexbin pcolor tricontour errorbar clabel set_aspect violinplot set_axis_off spines text hatch plt axis plt.bar() plt.axis import figure pyplot highlight_text pypalettes plt.subplots() xlabel ylabel title legend colorbar savefig tight_layout grid set_xlim set_ylim plot scatter hist boxplot imshow cmap alpha bins tick_params annotate quiver contour barh stackplot subplots_adjust axhline axvline semilogx semilogy loglog polar streamplot hexbin pcolor tricontour errorbar clabel set_aspect violinplot set_axis_off spines text hatch plt axis plt.bar() plt.axis import figure pyplot highlight_text pypalettes plt.subplots() xlabel ylabel title legend colorbar savefig tight_layout grid set_xlim set_ylim plot scatter hist boxplot imshow cmap alpha bins tick_params annotate quiver contour barh stackplot subplots_adjust axhline axvline semilogx semilogy loglog polar streamplot hexbin pcolor tricontour errorbar clabel set_aspect violinplot set_axis_off spines text hatch plt axis plt.bar() plt.axis import figure pyplot highlight_text pypalettes plt.subplots() xlabel ylabel title legend colorbar savefig tight_layout grid set_xlim set_ylim plot scatter hist boxplot imshow cmap alpha bins tick_params annotate quiver contour barh stackplot subplots_adjust axhline axvline semilogx semilogy loglog polar streamplot hexbin pcolor tricontour errorbar clabel set_aspect violinplot set_axis_off spines text hatch plt axis plt.bar() plt.axis import figure pyplot highlight_text pypalettes plt.subplots() xlabel ylabel title legend colorbar savefig tight_layout grid set_xlim set_ylim plot scatter hist boxplot imshow cmap alpha bins tick_params annotate quiver contour barh stackplot subplots_adjust axhline axvline semilogx semilogy loglog polar streamplot hexbin pcolor tricontour errorbar clabel set_aspect violinplot set_axis_off spines text hatch plt axis plt.bar() plt.axis import figure pyplot highlight_text pypalettes plt.subplots() xlabel ylabel title legend colorbar savefig tight_layout grid set_xlim set_ylim plot scatter hist boxplot imshow cmap alpha bins tick_params annotate quiver contour barh stackplot subplots_adjust axhline axvline semilogx semilogy loglog polar streamplot hexbin pcolor tricontour errorbar clabel set_aspect violinplot set_axis_off spines text hatch plt axis plt.bar() plt.axis import figure pyplot highlight_text pypalettes plt.subplots() xlabel ylabel title legend colorbar savefig tight_layout grid set_xlim set_ylim plot scatter hist boxplot imshow cmap alpha bins tick_params annotate quiver contour barh stackplot subplots_adjust axhline axvline semilogx semilogy loglog polar streamplot hexbin pcolor tricontour errorbar clabel set_aspect violinplot set_axis_off spines text hatch plt axis plt.bar() plt.axis import figure pyplot highlight_text pypalettes plt.subplots() xlabel ylabel title legend colorbar savefig tight_layout grid set_xlim set_ylim plot scatter hist boxplot imshow cmap alpha bins tick_params annotate quiver contour barh stackplot subplots_adjust axhline axvline semilogx semilogy loglog polar streamplot hexbin pcolor tricontour errorbar clabel set_aspect violinplot set_axis_off spines text hatch plt axis plt.bar() plt.axis import figure pyplot highlight_text pypalettes plt.subplots() xlabel ylabel title legend colorbar savefig tight_layout grid set_xlim set_ylim plot scatter hist boxplot imshow cmap alpha bins tick_params annotate quiver contour barh stackplot subplots_adjust axhline axvline semilogx semilogy loglog polar streamplot hexbin pcolor tricontour errorbar clabel set_aspect violinplot set_axis_off spines text hatch plt axis plt.bar() plt.axis import figure pyplot highlight_text pypalettes plt.subplots() xlabel ylabel title legend colorbar savefig tight_layout grid set_xlim set_ylim plot scatter hist boxplot imshow cmap alpha bins tick_params annotate quiver contour barh stackplot subplots_adjust axhline axvline semilogx semilogy loglog polar streamplot hexbin pcolor tricontour errorbar clabel set_aspect violinplot set_axis_off spines text hatch plt axis plt.bar() plt.axis import figure pyplot highlight_text pypalettes plt.subplots() xlabel ylabel title legend colorbar savefig tight_layout grid set_xlim set_ylim plot scatter hist boxplot imshow cmap alpha bins tick_params annotate quiver contour barh stackplot subplots_adjust axhline axvline semilogx semilogy loglog polar streamplot hexbin pcolor tricontour errorbar clabel set_aspect violinplot set_axis_off spines text hatch plt axis plt.bar() plt.axis import figure pyplot highlight_text pypalettes plt.subplots() xlabel ylabel title legend colorbar savefig tight_layout grid set_xlim set_ylim plot scatter hist boxplot imshow cmap alpha bins tick_params annotate quiver contour barh stackplot subplots_adjust axhline axvline semilogx semilogy loglog polar streamplot hexbin pcolor tricontour errorbar clabel set_aspect violinplot set_axis_off spines text hatch plt axis plt.bar() plt.axis import figure pyplot highlight_text pypalettes plt.subplots() xlabel ylabel title legend colorbar savefig tight_layout grid set_xlim set_ylim plot scatter hist boxplot imshow cmap alpha bins tick_params annotate quiver contour barh stackplot subplots_adjust axhline axvline semilogx semilogy loglog polar streamplot hexbin pcolor tricontour errorbar clabel set_aspect violinplot set_axis_off spines text hatch plt axis plt.bar() plt.axis import figure pyplot highlight_text pypalettes plt.subplots() xlabel ylabel title legend colorbar savefig tight_layout grid set_xlim set_ylim plot scatter hist boxplot imshow cmap alpha bins tick_params annotate quiver contour barh stackplot subplots_adjust axhline axvline semilogx semilogy loglog polar streamplot hexbin pcolor tricontour errorbar clabel set_aspect violinplot set_axis_off spines text hatch plt axis plt.bar() plt.axis import figure pyplot highlight_text pypalettes plt.subplots() xlabel ylabel title legend colorbar savefig tight_layout grid set_xlim set_ylim plot scatter hist boxplot imshow cmap alpha bins tick_params annotate quiver contour barh stackplot subplots_adjust axhline axvline semilogx semilogy loglog polar streamplot hexbin pcolor tricontour errorbar clabel set_aspect violinplot set_axis_off spines text hatch plt axis plt.bar() plt.axis import figure pyplot highlight_text pypalettes plt.subplots() xlabel ylabel title legend colorbar savefig tight_layout grid set_xlim set_ylim plot scatter hist boxplot imshow cmap alpha bins tick_params annotate quiver contour barh stackplot subplots_adjust axhline axvline semilogx semilogy loglog polar streamplot hexbin pcolor tricontour errorbar clabel set_aspect violinplot set_axis_off spines text hatch plt axis plt.bar() plt.axis import figure pyplot highlight_text pypalettes plt.subplots() xlabel ylabel title legend colorbar savefig tight_layout grid set_xlim set_ylim plot scatter hist boxplot imshow cmap alpha bins tick_params annotate quiver contour barh stackplot subplots_adjust axhline axvline semilogx semilogy loglog polar streamplot hexbin pcolor tricontour errorbar clabel set_aspect violinplot set_axis_off spines text hatch plt axis plt.bar() plt.axis import figure pyplot highlight_text pypalettes plt.subplots() xlabel ylabel title legend colorbar savefig tight_layout grid set_xlim set_ylim plot scatter hist boxplot imshow cmap alpha bins tick_params annotate quiver contour barh stackplot subplots_adjust axhline axvline semilogx semilogy loglog polar streamplot hexbin pcolor tricontour errorbar clabel set_aspect violinplot set_axis_off spines text hatch plt axis plt.bar() plt.axis import figure pyplot highlight_text pypalettes plt.subplots() xlabel ylabel title legend colorbar savefig tight_layout grid set_xlim set_ylim plot scatter hist boxplot imshow cmap alpha bins tick_params annotate quiver contour barh stackplot subplots_adjust axhline axvline semilogx semilogy loglog polar streamplot hexbin pcolor tricontour errorbar clabel set_aspect violinplot set_axis_off spines text hatch plt axis plt.bar() plt.axis import figure pyplot highlight_text pypalettes plt.subplots() xlabel ylabel title legend colorbar savefig tight_layout grid set_xlim set_ylim plot scatter hist boxplot imshow cmap alpha bins tick_params annotate quiver contour barh stackplot subplots_adjust axhline axvline semilogx semilogy loglog polar streamplot hexbin pcolor tricontour errorbar clabel set_aspect violinplot set_axis_off spines text hatch plt axis plt.bar() plt.axis import figure pyplot highlight_text pypalettes plt.subplots() xlabel ylabel title legend colorbar savefig tight_layout grid set_xlim set_ylim plot scatter hist boxplot imshow cmap alpha bins tick_params annotate quiver contour barh stackplot subplots_adjust axhline axvline semilogx semilogy loglog polar streamplot hexbin pcolor tricontour errorbar clabel set_aspect violinplot set_axis_off spines text hatch plt axis plt.bar() plt.axis import figure pyplot highlight_text pypalettes plt.subplots() xlabel ylabel title legend colorbar savefig tight_layout grid set_xlim set_ylim plot scatter hist boxplot imshow cmap alpha bins tick_params annotate quiver contour barh stackplot subplots_adjust axhline axvline semilogx semilogy loglog polar streamplot hexbin pcolor tricontour errorbar clabel set_aspect violinplot set_axis_off spines text hatch plt axis plt.bar() plt.axis import figure pyplot highlight_text pypalettes plt.subplots() xlabel ylabel title legend colorbar savefig tight_layout grid set_xlim set_ylim plot scatter hist boxplot imshow cmap alpha bins tick_params annotate quiver contour barh stackplot subplots_adjust axhline axvline semilogx semilogy loglog polar streamplot hexbin pcolor tricontour errorbar clabel set_aspect violinplot set_axis_off spines text hatch plt axis plt.bar() plt.axis import figure pyplot highlight_text pypalettes plt.subplots() xlabel ylabel title legend colorbar savefig tight_layout grid set_xlim set_ylim plot scatter hist boxplot imshow cmap alpha bins tick_params annotate quiver contour barh stackplot subplots_adjust axhline axvline semilogx semilogy loglog polar streamplot hexbin pcolor tricontour errorbar clabel set_aspect violinplot set_axis_off spines text hatch plt axis plt.bar() plt.axis import figure pyplot highlight_text pypalettes plt.subplots() xlabel ylabel title legend colorbar savefig tight_layout grid set_xlim set_ylim plot scatter hist boxplot imshow cmap alpha bins tick_params annotate quiver contour barh stackplot subplots_adjust axhline axvline semilogx semilogy loglog polar streamplot hexbin pcolor tricontour errorbar clabel set_aspect violinplot set_axis_off spines text hatch plt axis plt.bar() plt.axis import figure pyplot highlight_text pypalettes plt.subplots() xlabel ylabel title legend colorbar savefig tight_layout grid set_xlim set_ylim plot scatter hist boxplot imshow cmap alpha bins tick_params annotate quiver contour barh stackplot subplots_adjust axhline axvline semilogx semilogy loglog polar streamplot hexbin pcolor tricontour errorbar clabel set_aspect violinplot set_axis_off spines text hatch plt axis plt.bar() plt.axis import figure pyplot highlight_text pypalettes plt.subplots() xlabel ylabel title legend colorbar savefig tight_layout grid set_xlim set_ylim plot scatter hist boxplot imshow cmap alpha bins tick_params annotate quiver contour barh stackplot subplots_adjust axhline axvline semilogx semilogy loglog polar streamplot hexbin pcolor tricontour errorbar clabel set_aspect violinplot set_axis_off spines text hatch plt axis plt.bar() plt.axis import figure pyplot highlight_text pypalettes plt.subplots() xlabel ylabel title legend colorbar savefig tight_layout grid set_xlim set_ylim plot scatter hist boxplot imshow cmap alpha bins tick_params annotate quiver contour barh stackplot subplots_adjust axhline axvline semilogx semilogy loglog polar streamplot hexbin pcolor tricontour errorbar clabel set_aspect violinplot set_axis_off spines text hatch plt axis plt.bar() plt.axis import figure pyplot highlight_text pypalettes plt.subplots() xlabel ylabel title legend colorbar savefig tight_layout grid set_xlim set_ylim plot scatter hist boxplot imshow cmap alpha bins tick_params annotate quiver contour barh stackplot subplots_adjust axhline axvline semilogx semilogy loglog polar streamplot hexbin pcolor tricontour errorbar clabel set_aspect violinplot set_axis_off spines text hatch plt axis plt.bar() plt.axis import figure pyplot highlight_text pypalettes plt.subplots() xlabel ylabel title legend colorbar savefig tight_layout grid set_xlim set_ylim plot scatter hist boxplot imshow cmap alpha bins tick_params annotate quiver contour barh stackplot subplots_adjust axhline axvline semilogx semilogy loglog polar streamplot hexbin pcolor tricontour errorbar clabel set_aspect violinplot set_axis_off spines text hatch plt axis plt.bar() plt.axis import figure pyplot highlight_text pypalettes plt.subplots() xlabel ylabel title legend colorbar savefig tight_layout grid set_xlim set_ylim plot scatter hist boxplot imshow cmap alpha bins tick_params annotate quiver contour barh stackplot subplots_adjust axhline axvline semilogx semilogy loglog polar streamplot hexbin pcolor tricontour errorbar clabel set_aspect violinplot set_axis_off spines text hatch plt axis plt.bar() plt.axis import figure pyplot highlight_text pypalettes plt.subplots() xlabel ylabel title legend colorbar savefig tight_layout grid set_xlim set_ylim plot scatter hist boxplot imshow cmap alpha bins tick_params annotate quiver contour barh stackplot subplots_adjust axhline axvline semilogx semilogy loglog polar streamplot hexbin pcolor tricontour errorbar clabel set_aspect violinplot set_axis_off spines text hatch plt axis plt.bar() plt.axis import figure pyplot highlight_text pypalettes plt.subplots() xlabel ylabel title legend colorbar savefig tight_layout grid set_xlim set_ylim plot scatter hist boxplot imshow cmap alpha bins tick_params annotate quiver contour barh stackplot subplots_adjust axhline axvline semilogx semilogy loglog polar streamplot hexbin pcolor tricontour errorbar clabel set_aspect violinplot set_axis_off spines text hatch plt axis plt.bar() plt.axis import figure pyplot highlight_text pypalettes plt.subplots() xlabel ylabel title legend colorbar savefig tight_layout grid set_xlim set_ylim plot scatter hist boxplot imshow cmap alpha bins tick_params annotate quiver contour barh stackplot subplots_adjust axhline axvline semilogx semilogy loglog polar streamplot hexbin pcolor tricontour errorbar clabel set_aspect violinplot set_axis_off spines text hatch plt axis plt.bar() plt.axis import figure pyplot highlight_text pypalettes plt.subplots() xlabel ylabel title legend colorbar savefig tight_layout grid set_xlim set_ylim plot scatter hist boxplot imshow cmap alpha bins tick_params annotate quiver contour barh stackplot subplots_adjust axhline axvline semilogx semilogy loglog polar streamplot hexbin pcolor tricontour errorbar clabel set_aspect violinplot set_axis_off spines text hatch plt axis plt.bar() plt.axis import figure pyplot highlight_text pypalettes plt.subplots() xlabel ylabel title legend colorbar savefig tight_layout grid set_xlim set_ylim plot scatter hist boxplot imshow cmap alpha bins tick_params annotate quiver contour barh stackplot subplots_adjust axhline axvline semilogx semilogy loglog polar streamplot hexbin pcolor tricontour errorbar clabel set_aspect violinplot set_axis_off spines text hatch plt axis plt.bar() plt.axis import figure pyplot highlight_text pypalettes plt.subplots() xlabel ylabel title legend colorbar savefig tight_layout grid set_xlim set_ylim plot scatter hist boxplot imshow cmap alpha bins tick_params annotate quiver contour barh stackplot subplots_adjust axhline axvline semilogx semilogy loglog polar streamplot hexbin pcolor tricontour errorbar clabel set_aspect violinplot set_axis_off spines text hatch plt axis plt.bar() plt.axis import figure pyplot highlight_text pypalettes plt.subplots() xlabel ylabel title legend colorbar savefig tight_layout grid set_xlim set_ylim plot scatter hist boxplot imshow cmap alpha bins tick_params annotate quiver contour barh stackplot subplots_adjust axhline axvline semilogx semilogy loglog polar streamplot hexbin pcolor tricontour errorbar clabel set_aspect violinplot set_axis_off spines text hatch plt axis plt.bar() plt.axis import figure pyplot highlight_text pypalettes plt.subplots() xlabel ylabel title legend colorbar savefig tight_layout grid set_xlim set_ylim plot scatter hist boxplot imshow cmap alpha bins tick_params annotate quiver contour barh stackplot subplots_adjust axhline axvline semilogx semilogy loglog polar streamplot hexbin pcolor tricontour errorbar clabel set_aspect violinplot set_axis_off spines text hatch plt axis plt.bar() plt.axis import figure pyplot highlight_text pypalettes plt.subplots() xlabel ylabel title legend colorbar savefig tight_layout grid set_xlim set_ylim plot scatter hist boxplot imshow cmap alpha bins tick_params annotate quiver contour barh stackplot subplots_adjust axhline axvline semilogx semilogy loglog polar streamplot hexbin pcolor tricontour errorbar clabel set_aspect violinplot set_axis_off spines text hatch plt axis plt.bar() plt.axis import figure pyplot highlight_text pypalettes plt.subplots() xlabel ylabel title legend colorbar savefig tight_layout grid set_xlim set_ylim plot scatter hist boxplot imshow cmap alpha bins tick_params annotate quiver contour barh stackplot subplots_adjust axhline axvline semilogx semilogy loglog polar streamplot hexbin pcolor tricontour errorbar clabel set_aspect violinplot set_axis_off spines text hatch plt axis plt.bar() plt.axis import figure pyplot highlight_text pypalettes plt.subplots() xlabel ylabel title legend colorbar savefig tight_layout grid set_xlim set_ylim plot scatter hist boxplot imshow cmap alpha bins tick_params annotate quiver contour barh stackplot subplots_adjust axhline axvline semilogx semilogy loglog polar streamplot hexbin pcolor tricontour errorbar clabel set_aspect violinplot set_axis_off spines text hatch plt axis plt.bar() plt.axis import figure pyplot highlight_text pypalettes plt.subplots() xlabel ylabel title legend colorbar savefig tight_layout grid set_xlim set_ylim plot scatter hist boxplot imshow cmap alpha bins tick_params annotate quiver contour barh stackplot subplots_adjust axhline axvline semilogx semilogy loglog polar streamplot hexbin pcolor tricontour errorbar clabel set_aspect violinplot set_axis_off spines text hatch plt axis plt.bar() plt.axis import figure pyplot highlight_text pypalettes plt.subplots() xlabel ylabel title legend colorbar savefig tight_layout grid set_xlim set_ylim plot scatter hist boxplot imshow cmap alpha bins tick_params annotate quiver contour barh stackplot subplots_adjust axhline axvline semilogx semilogy loglog polar streamplot hexbin pcolor tricontour errorbar clabel set_aspect violinplot set_axis_off spines text hatch plt axis plt.bar() plt.axis import figure pyplot highlight_text pypalettes plt.subplots() xlabel ylabel title legend colorbar savefig tight_layout grid set_xlim set_ylim plot scatter hist boxplot imshow cmap alpha bins tick_params annotate quiver contour barh stackplot subplots_adjust axhline axvline semilogx semilogy loglog polar streamplot hexbin pcolor tricontour errorbar clabel set_aspect violinplot set_axis_off spines text hatch plt axis plt.bar() plt.axis import figure pyplot highlight_text pypalettes plt.subplots() xlabel ylabel title legend colorbar savefig tight_layout grid set_xlim set_ylim plot scatter hist boxplot imshow cmap alpha bins tick_params annotate quiver contour barh stackplot subplots_adjust axhline axvline semilogx semilogy loglog polar streamplot hexbin pcolor tricontour errorbar clabel set_aspect violinplot set_axis_off spines text hatch plt axis plt.bar() plt.axis import figure pyplot highlight_text pypalettes plt.subplots() xlabel ylabel title legend colorbar savefig tight_layout grid set_xlim set_ylim plot scatter hist boxplot imshow cmap alpha bins tick_params annotate quiver contour barh stackplot subplots_adjust axhline axvline semilogx semilogy loglog polar streamplot hexbin pcolor tricontour errorbar clabel set_aspect violinplot set_axis_off spines text hatch plt axis plt.bar() plt.axis import figure pyplot highlight_text pypalettes plt.subplots() xlabel ylabel title legend colorbar savefig tight_layout grid set_xlim set_ylim plot scatter hist boxplot imshow cmap alpha bins tick_params annotate quiver contour barh stackplot subplots_adjust axhline axvline semilogx semilogy loglog polar streamplot hexbin pcolor tricontour errorbar clabel set_aspect violinplot set_axis_off spines text hatch plt axis plt.bar() plt.axis import figure pyplot highlight_text pypalettes plt.subplots() xlabel ylabel title legend colorbar savefig tight_layout grid set_xlim set_ylim plot scatter hist boxplot imshow cmap alpha bins tick_params annotate quiver contour barh stackplot subplots_adjust axhline axvline semilogx semilogy loglog polar streamplot hexbin pcolor tricontour errorbar clabel set_aspect violinplot set_axis_off spines text hatch plt axis plt.bar() plt.axis import figure pyplot highlight_text pypalettes plt.subplots() xlabel ylabel title legend colorbar savefig tight_layout grid set_xlim set_ylim plot scatter hist boxplot imshow cmap alpha bins tick_params annotate quiver contour barh stackplot subplots_adjust axhline axvline semilogx semilogy loglog polar streamplot hexbin pcolor tricontour errorbar clabel set_aspect violinplot set_axis_off spines text hatch plt axis plt.bar() plt.axis import figure pyplot highlight_text pypalettes plt.subplots() xlabel ylabel title legend colorbar savefig tight_layout grid set_xlim set_ylim plot scatter hist boxplot imshow cmap alpha bins tick_params annotate quiver contour barh stackplot subplots_adjust axhline axvline semilogx semilogy loglog polar streamplot hexbin pcolor tricontour errorbar clabel set_aspect violinplot set_axis_off spines text hatch plt axis plt.bar() plt.axis import figure pyplot highlight_text pypalettes plt.subplots() xlabel ylabel title legend colorbar savefig tight_layout grid set_xlim set_ylim plot scatter hist boxplot imshow cmap alpha bins tick_params annotate quiver contour barh stackplot subplots_adjust axhline axvline semilogx semilogy loglog polar streamplot hexbin pcolor tricontour errorbar clabel set_aspect violinplot set_axis_off spines text hatch plt axis plt.bar() plt.axis import figure pyplot highlight_text pypalettes plt.subplots() xlabel ylabel title legend colorbar savefig tight_layout grid set_xlim set_ylim plot scatter hist boxplot imshow cmap alpha bins tick_params annotate quiver contour barh stackplot subplots_adjust axhline axvline semilogx semilogy loglog polar streamplot hexbin pcolor tricontour errorbar clabel set_aspect violinplot set_axis_off spines text hatch plt axis plt.bar() plt.axis import figure pyplot highlight_text pypalettes plt.subplots() xlabel ylabel title legend colorbar savefig tight_layout grid set_xlim set_ylim plot scatter hist boxplot imshow cmap alpha bins tick_params annotate quiver contour barh stackplot subplots_adjust axhline axvline semilogx semilogy loglog polar streamplot hexbin pcolor tricontour errorbar clabel set_aspect violinplot set_axis_off spines text hatch plt axis plt.bar() plt.axis import figure pyplot highlight_text pypalettes plt.subplots() xlabel ylabel title legend colorbar savefig tight_layout grid set_xlim set_ylim plot scatter hist boxplot imshow cmap alpha bins tick_params annotate quiver contour barh stackplot subplots_adjust axhline axvline semilogx semilogy loglog polar streamplot hexbin pcolor tricontour errorbar clabel set_aspect violinplot set_axis_off spines text hatch plt axis plt.bar() plt.axis import figure pyplot highlight_text pypalettes plt.subplots() xlabel ylabel title legend colorbar savefig tight_layout grid set_xlim set_ylim plot scatter hist boxplot imshow cmap alpha bins tick_params annotate quiver contour barh stackplot subplots_adjust axhline axvline semilogx semilogy loglog polar streamplot hexbin pcolor tricontour errorbar clabel set_aspect violinplot set_axis_off spines text hatch plt axis plt.bar() plt.axis import figure pyplot highlight_text pypalettes plt.subplots() xlabel ylabel title legend colorbar savefig tight_layout grid set_xlim set_ylim plot scatter hist boxplot imshow cmap alpha bins tick_params annotate quiver contour barh stackplot subplots_adjust axhline axvline semilogx semilogy loglog polar streamplot hexbin pcolor tricontour errorbar clabel set_aspect violinplot set_axis_off spines text hatch plt axis plt.bar() plt.axis import figure pyplot highlight_text pypalettes plt.subplots() xlabel ylabel title legend colorbar savefig tight_layout grid set_xlim set_ylim plot scatter hist boxplot imshow cmap alpha bins tick_params annotate quiver contour barh stackplot subplots_adjust axhline axvline semilogx semilogy loglog polar streamplot hexbin pcolor tricontour errorbar clabel set_aspect violinplot set_axis_off spines text hatch plt axis plt.bar() plt.axis import figure pyplot highlight_text pypalettes plt.subplots() xlabel ylabel title legend colorbar savefig tight_layout grid set_xlim set_ylim plot scatter hist boxplot imshow cmap alpha bins tick_params annotate quiver contour barh stackplot subplots_adjust axhline axvline semilogx semilogy loglog polar streamplot hexbin pcolor tricontour errorbar clabel set_aspect violinplot set_axis_off spines text hatch plt axis plt.bar() plt.axis import figure pyplot highlight_text pypalettes plt.subplots() xlabel ylabel title legend colorbar savefig tight_layout grid set_xlim set_ylim plot scatter hist boxplot imshow cmap alpha bins tick_params annotate quiver contour barh stackplot subplots_adjust axhline axvline semilogx semilogy loglog polar streamplot hexbin pcolor tricontour errorbar clabel set_aspect violinplot set_axis_off spines text hatch plt axis plt.bar() plt.axis import figure pyplot highlight_text pypalettes plt.subplots() xlabel ylabel title legend colorbar savefig tight_layout grid set_xlim set_ylim plot scatter hist boxplot imshow cmap alpha bins tick_params annotate quiver contour barh stackplot subplots_adjust axhline axvline semilogx semilogy loglog polar streamplot hexbin pcolor tricontour errorbar clabel set_aspect violinplot set_axis_off spines text hatch plt axis plt.bar() plt.axis import figure pyplot highlight_text pypalettes plt.subplots() xlabel ylabel title legend colorbar savefig tight_layout grid set_xlim set_ylim plot scatter hist boxplot imshow cmap alpha bins tick_params annotate quiver contour barh stackplot subplots_adjust axhline axvline semilogx semilogy loglog polar streamplot hexbin pcolor tricontour errorbar clabel set_aspect violinplot set_axis_off spines text hatch plt axis plt.bar() plt.axis import figure pyplot highlight_text pypalettes plt.subplots() xlabel ylabel title legend colorbar savefig tight_layout grid set_xlim set_ylim plot scatter hist boxplot imshow cmap alpha bins tick_params annotate quiver contour barh stackplot subplots_adjust axhline axvline semilogx semilogy loglog polar streamplot hexbin pcolor tricontour errorbar clabel set_aspect violinplot set_axis_off spines text hatch plt axis plt.bar() plt.axis import figure pyplot highlight_text pypalettes plt.subplots() xlabel ylabel title legend colorbar savefig tight_layout grid set_xlim set_ylim plot scatter hist boxplot imshow cmap alpha bins tick_params annotate quiver contour barh stackplot subplots_adjust axhline axvline semilogx semilogy loglog polar streamplot hexbin pcolor tricontour errorbar clabel set_aspect violinplot set_axis_off spines text hatch plt axis plt.bar() plt.axis import figure pyplot highlight_text pypalettes plt.subplots() xlabel ylabel title legend colorbar savefig tight_layout grid set_xlim set_ylim plot scatter hist boxplot imshow cmap alpha bins tick_params annotate quiver contour barh stackplot subplots_adjust axhline axvline semilogx semilogy loglog polar streamplot hexbin pcolor tricontour errorbar clabel set_aspect violinplot set_axis_off spines text hatch plt axis plt.bar() plt.axis import figure pyplot highlight_text pypalettes plt.subplots() xlabel ylabel title legend colorbar savefig tight_layout grid set_xlim set_ylim plot scatter hist boxplot imshow cmap alpha bins tick_params annotate quiver contour barh stackplot subplots_adjust axhline axvline semilogx semilogy loglog polar streamplot hexbin pcolor tricontour errorbar clabel set_aspect violinplot set_axis_off spines text hatch plt axis plt.bar() plt.axis import figure pyplot highlight_text pypalettes plt.subplots() xlabel ylabel title legend colorbar savefig tight_layout grid set_xlim set_ylim plot scatter hist boxplot imshow cmap alpha bins tick_params annotate quiver contour barh stackplot subplots_adjust axhline axvline semilogx semilogy loglog polar streamplot hexbin pcolor tricontour errorbar clabel set_aspect violinplot set_axis_off spines text hatch plt axis plt.bar() plt.axis import figure pyplot highlight_text pypalettes plt.subplots() xlabel ylabel title legend colorbar savefig tight_layout grid set_xlim set_ylim plot scatter hist boxplot imshow cmap alpha bins tick_params annotate quiver contour barh stackplot subplots_adjust axhline axvline semilogx semilogy loglog polar streamplot hexbin pcolor tricontour errorbar clabel set_aspect violinplot set_axis_off spines text hatch plt axis plt.bar() plt.axis import figure pyplot highlight_text pypalettes plt.subplots() xlabel ylabel title legend colorbar savefig tight_layout grid set_xlim set_ylim plot scatter hist boxplot imshow cmap alpha bins tick_params annotate quiver contour barh stackplot subplots_adjust axhline axvline semilogx semilogy loglog polar streamplot hexbin pcolor tricontour errorbar clabel set_aspect violinplot set_axis_off spines text hatch plt axis plt.bar() plt.axis import figure pyplot highlight_text pypalettes plt.subplots() xlabel ylabel title legend colorbar savefig tight_layout grid set_xlim set_ylim plot scatter hist boxplot imshow cmap alpha bins tick_params annotate quiver contour barh stackplot subplots_adjust axhline axvline semilogx semilogy loglog polar streamplot hexbin pcolor tricontour errorbar clabel set_aspect violinplot set_axis_off spines text hatch plt axis plt.bar() plt.axis import figure pyplot highlight_text pypalettes plt.subplots() xlabel ylabel title legend colorbar savefig tight_layout grid set_xlim set_ylim plot scatter hist boxplot imshow cmap alpha bins tick_params annotate quiver contour barh stackplot subplots_adjust axhline axvline semilogx semilogy loglog polar streamplot hexbin pcolor tricontour errorbar clabel set_aspect violinplot set_axis_off spines text hatch plt axis plt.bar() plt.axis import figure pyplot highlight_text pypalettes plt.subplots() xlabel ylabel title legend colorbar savefig tight_layout grid set_xlim set_ylim plot scatter hist boxplot imshow cmap alpha bins tick_params annotate quiver contour barh stackplot subplots_adjust axhline axvline semilogx semilogy loglog polar streamplot hexbin pcolor tricontour errorbar clabel set_aspect violinplot set_axis_off spines text hatch plt axis plt.bar() plt.axis import figure pyplot highlight_text pypalettes plt.subplots() xlabel ylabel title legend colorbar savefig tight_layout grid set_xlim set_ylim plot scatter hist boxplot imshow cmap alpha bins tick_params annotate quiver contour barh stackplot subplots_adjust axhline axvline semilogx semilogy loglog polar streamplot hexbin pcolor tricontour errorbar clabel set_aspect violinplot set_axis_off spines text hatch plt axis plt.bar() plt.axis import figure pyplot highlight_text pypalettes plt.subplots() xlabel ylabel title legend colorbar savefig tight_layout grid set_xlim set_ylim plot scatter hist boxplot imshow cmap alpha bins tick_params annotate quiver contour barh stackplot subplots_adjust axhline axvline semilogx semilogy loglog polar streamplot hexbin pcolor tricontour errorbar clabel set_aspect violinplot set_axis_off spines text hatch plt axis plt.bar() plt.axis import figure pyplot highlight_text pypalettes plt.subplots() xlabel ylabel title legend colorbar savefig tight_layout grid set_xlim set_ylim plot scatter hist boxplot imshow cmap alpha bins tick_params annotate quiver contour barh stackplot subplots_adjust axhline axvline semilogx semilogy loglog polar streamplot hexbin pcolor tricontour errorbar clabel set_aspect violinplot set_axis_off spines text hatch plt axis plt.bar() plt.axis import figure pyplot highlight_text pypalettes plt.subplots() xlabel ylabel title legend colorbar savefig tight_layout grid set_xlim set_ylim plot scatter hist boxplot imshow cmap alpha bins tick_params annotate quiver contour barh stackplot subplots_adjust axhline axvline semilogx semilogy loglog polar streamplot hexbin pcolor tricontour errorbar clabel set_aspect violinplot set_axis_off spines text hatch plt axis plt.bar() plt.axis import figure pyplot highlight_text pypalettes plt.subplots() xlabel ylabel title legend colorbar savefig tight_layout grid set_xlim set_ylim plot scatter hist boxplot imshow cmap alpha bins tick_params annotate quiver contour barh stackplot subplots_adjust axhline axvline semilogx semilogy loglog polar streamplot hexbin pcolor tricontour errorbar clabel set_aspect violinplot set_axis_off spines text hatch plt axis plt.bar() plt.axis import figure pyplot highlight_text pypalettes plt.subplots() xlabel ylabel title legend colorbar savefig tight_layout grid set_xlim set_ylim plot scatter hist boxplot imshow cmap alpha bins tick_params annotate quiver contour barh stackplot subplots_adjust axhline axvline semilogx semilogy loglog polar streamplot hexbin pcolor tricontour errorbar clabel set_aspect violinplot set_axis_off spines text hatch plt axis plt.bar() plt.axis import figure pyplot highlight_text pypalettes plt.subplots() xlabel ylabel title legend colorbar savefig tight_layout grid set_xlim set_ylim plot scatter hist boxplot imshow cmap alpha bins tick_params annotate quiver contour barh stackplot subplots_adjust axhline axvline semilogx semilogy loglog polar streamplot hexbin pcolor tricontour errorbar clabel set_aspect violinplot set_axis_off spines text hatch plt axis plt.bar() plt.axis import figure pyplot highlight_text pypalettes plt.subplots() xlabel ylabel title legend colorbar savefig tight_layout grid set_xlim set_ylim plot scatter hist boxplot imshow cmap alpha bins tick_params annotate quiver contour barh stackplot subplots_adjust axhline axvline semilogx semilogy loglog polar streamplot hexbin pcolor tricontour errorbar clabel set_aspect violinplot set_axis_off spines text hatch plt axis plt.bar() plt.axis import figure pyplot highlight_text pypalettes plt.subplots() xlabel ylabel title legend colorbar savefig tight_layout grid set_xlim set_ylim plot scatter hist boxplot imshow cmap alpha bins tick_params annotate quiver contour barh stackplot subplots_adjust axhline axvline semilogx semilogy loglog polar streamplot hexbin pcolor tricontour errorbar clabel set_aspect violinplot set_axis_off spines text hatch plt axis plt.bar() plt.axis import figure pyplot highlight_text pypalettes plt.subplots() xlabel ylabel title legend colorbar savefig tight_layout grid set_xlim set_ylim plot scatter hist boxplot imshow cmap alpha bins tick_params annotate quiver contour barh stackplot subplots_adjust axhline axvline semilogx semilogy loglog polar streamplot hexbin pcolor tricontour errorbar clabel set_aspect violinplot set_axis_off spines text hatch plt axis plt.bar() plt.axis import figure pyplot highlight_text pypalettes plt.subplots() xlabel ylabel title legend colorbar savefig tight_layout grid set_xlim set_ylim plot scatter hist boxplot imshow cmap alpha bins tick_params annotate quiver contour barh stackplot subplots_adjust axhline axvline semilogx semilogy loglog polar streamplot hexbin pcolor tricontour errorbar clabel set_aspect violinplot set_axis_off spines text hatch plt axis plt.bar() plt.axis import figure pyplot highlight_text pypalettes plt.subplots() xlabel ylabel title legend colorbar savefig tight_layout grid set_xlim set_ylim plot scatter hist boxplot imshow cmap alpha bins tick_params annotate quiver contour barh stackplot subplots_adjust axhline axvline semilogx semilogy loglog polar streamplot hexbin pcolor tricontour errorbar clabel set_aspect violinplot set_axis_off spines text hatch plt axis plt.bar() plt.axis import figure pyplot highlight_text pypalettes plt.subplots() xlabel ylabel title legend colorbar savefig tight_layout grid set_xlim set_ylim plot scatter hist boxplot imshow cmap alpha bins tick_params annotate quiver contour barh stackplot subplots_adjust axhline axvline semilogx semilogy loglog polar streamplot hexbin pcolor tricontour errorbar clabel set_aspect violinplot set_axis_off spines text hatch plt axis plt.bar() plt.axis import figure pyplot highlight_text pypalettes plt.subplots() xlabel ylabel title legend colorbar savefig tight_layout grid set_xlim set_ylim plot scatter hist boxplot imshow cmap alpha bins tick_params annotate quiver contour barh stackplot subplots_adjust axhline axvline semilogx semilogy loglog polar streamplot hexbin pcolor tricontour errorbar clabel set_aspect violinplot set_axis_off spines text hatch plt axis plt.bar() plt.axis import figure pyplot highlight_text pypalettes plt.subplots() xlabel ylabel title legend colorbar savefig tight_layout grid set_xlim set_ylim plot scatter hist boxplot imshow cmap alpha bins tick_params annotate quiver contour barh stackplot subplots_adjust axhline axvline semilogx semilogy loglog polar streamplot hexbin pcolor tricontour errorbar clabel set_aspect violinplot set_axis_off spines text hatch plt axis plt.bar() plt.axis import figure pyplot highlight_text pypalettes plt.subplots() xlabel ylabel title legend colorbar savefig tight_layout grid set_xlim set_ylim plot scatter hist boxplot imshow cmap alpha bins tick_params annotate quiver contour barh stackplot subplots_adjust axhline axvline semilogx semilogy loglog polar streamplot hexbin pcolor tricontour errorbar clabel set_aspect violinplot set_axis_off spines text hatch plt axis plt.bar() plt.axis import figure pyplot highlight_text pypalettes plt.subplots() xlabel ylabel title legend colorbar savefig tight_layout grid set_xlim set_ylim plot scatter hist boxplot imshow cmap alpha bins tick_params annotate quiver contour barh stackplot subplots_adjust axhline axvline semilogx semilogy loglog polar streamplot hexbin pcolor tricontour errorbar clabel set_aspect violinplot set_axis_off spines text hatch plt axis plt.bar() plt.axis import figure pyplot highlight_text pypalettes plt.subplots() xlabel ylabel title legend colorbar savefig tight_layout grid set_xlim set_ylim plot scatter hist boxplot imshow cmap alpha bins tick_params annotate quiver contour barh stackplot subplots_adjust axhline axvline semilogx semilogy loglog polar streamplot hexbin pcolor tricontour errorbar clabel set_aspect violinplot set_axis_off spines text hatch plt axis plt.bar() plt.axis import figure pyplot highlight_text pypalettes plt.subplots() xlabel ylabel title legend colorbar savefig tight_layout grid set_xlim set_ylim plot scatter hist boxplot imshow cmap alpha bins tick_params annotate quiver contour barh stackplot subplots_adjust axhline axvline semilogx semilogy loglog polar streamplot hexbin pcolor tricontour errorbar clabel set_aspect violinplot set_axis_off spines text hatch plt axis plt.bar() plt.axis import figure pyplot highlight_text pypalettes plt.subplots() xlabel ylabel title legend colorbar savefig tight_layout grid set_xlim set_ylim plot scatter hist boxplot imshow cmap alpha bins tick_params annotate quiver contour barh stackplot subplots_adjust axhline axvline semilogx semilogy loglog polar streamplot hexbin pcolor tricontour errorbar clabel set_aspect violinplot set_axis_off spines text hatch plt axis plt.bar() plt.axis import figure pyplot highlight_text pypalettes plt.subplots() xlabel ylabel title legend colorbar savefig tight_layout grid set_xlim set_ylim plot scatter hist boxplot imshow cmap alpha bins tick_params annotate quiver contour barh stackplot subplots_adjust axhline axvline semilogx semilogy loglog polar streamplot hexbin pcolor tricontour errorbar clabel set_aspect violinplot set_axis_off spines text hatch plt axis plt.bar() plt.axis import figure pyplot highlight_text pypalettes plt.subplots() xlabel ylabel title legend colorbar savefig tight_layout grid set_xlim set_ylim plot scatter hist boxplot imshow cmap alpha bins tick_params annotate quiver contour barh stackplot subplots_adjust axhline axvline semilogx semilogy loglog polar streamplot hexbin pcolor tricontour errorbar clabel set_aspect violinplot set_axis_off spines text hatch plt axis plt.bar() plt.axis import figure pyplot highlight_text pypalettes plt.subplots() xlabel ylabel title legend colorbar savefig tight_layout grid set_xlim set_ylim plot scatter hist boxplot imshow cmap alpha bins tick_params annotate quiver contour barh stackplot subplots_adjust axhline axvline semilogx semilogy loglog polar streamplot hexbin pcolor tricontour errorbar clabel set_aspect violinplot set_axis_off spines text hatch plt axis plt.bar() plt.axis import figure pyplot highlight_text pypalettes plt.subplots() xlabel ylabel title legend colorbar savefig tight_layout grid set_xlim set_ylim plot scatter hist boxplot imshow cmap alpha bins tick_params annotate quiver contour barh stackplot subplots_adjust axhline axvline semilogx semilogy loglog polar streamplot hexbin pcolor tricontour errorbar clabel set_aspect violinplot set_axis_off spines text hatch plt axis plt.bar() plt.axis import figure pyplot highlight_text pypalettes plt.subplots() xlabel ylabel title legend colorbar savefig tight_layout grid set_xlim set_ylim plot scatter hist boxplot imshow cmap alpha bins tick_params annotate quiver contour barh stackplot subplots_adjust axhline axvline semilogx semilogy loglog polar streamplot hexbin pcolor tricontour errorbar clabel set_aspect violinplot set_axis_off spines text hatch plt axis plt.bar() plt.axis import figure pyplot highlight_text pypalettes plt.subplots() xlabel ylabel title legend colorbar savefig tight_layout grid set_xlim set_ylim plot scatter hist boxplot imshow cmap alpha bins tick_params annotate quiver contour barh stackplot subplots_adjust axhline axvline semilogx semilogy loglog polar streamplot hexbin pcolor tricontour errorbar clabel set_aspect violinplot set_axis_off spines text hatch plt axis plt.bar() plt.axis import figure pyplot highlight_text pypalettes plt.subplots() xlabel ylabel title legend colorbar savefig tight_layout grid set_xlim set_ylim plot scatter hist boxplot imshow cmap alpha bins tick_params annotate quiver contour barh stackplot subplots_adjust axhline axvline semilogx semilogy loglog polar streamplot hexbin pcolor tricontour errorbar clabel set_aspect violinplot set_axis_off spines text hatch plt axis plt.bar() plt.axis import figure pyplot highlight_text pypalettes plt.subplots() xlabel ylabel title legend colorbar savefig tight_layout grid set_xlim set_ylim plot scatter hist boxplot imshow cmap alpha bins tick_params annotate quiver contour barh stackplot subplots_adjust axhline axvline semilogx semilogy loglog polar streamplot hexbin pcolor tricontour errorbar clabel set_aspect violinplot set_axis_off spines text hatch plt axis plt.bar() plt.axis import figure pyplot highlight_text pypalettes plt.subplots() xlabel ylabel title legend colorbar savefig tight_layout grid set_xlim set_ylim plot scatter hist boxplot imshow cmap alpha bins tick_params annotate quiver contour barh stackplot subplots_adjust axhline axvline semilogx semilogy loglog polar streamplot hexbin pcolor tricontour errorbar clabel set_aspect violinplot set_axis_off spines text hatch plt axis plt.bar() plt.axis import figure pyplot highlight_text pypalettes plt.subplots() xlabel ylabel title legend colorbar savefig tight_layout grid set_xlim set_ylim plot scatter hist boxplot imshow cmap alpha bins tick_params annotate quiver contour barh stackplot subplots_adjust axhline axvline semilogx semilogy loglog polar streamplot hexbin pcolor tricontour errorbar clabel set_aspect violinplot set_axis_off spines text hatch plt axis plt.bar() plt.axis import figure pyplot highlight_text pypalettes plt.subplots() xlabel ylabel title legend colorbar savefig tight_layout grid set_xlim set_ylim plot scatter hist boxplot imshow cmap alpha bins tick_params annotate quiver contour barh stackplot subplots_adjust axhline axvline semilogx semilogy loglog polar streamplot hexbin pcolor tricontour errorbar clabel set_aspect violinplot set_axis_off spines text hatch plt axis plt.bar() plt.axis import figure pyplot highlight_text pypalettes plt.subplots() xlabel ylabel title legend colorbar savefig tight_layout grid set_xlim set_ylim plot scatter hist boxplot imshow cmap alpha bins tick_params annotate quiver contour barh stackplot subplots_adjust axhline axvline semilogx semilogy loglog polar streamplot hexbin pcolor tricontour errorbar clabel set_aspect violinplot set_axis_off spines text hatch plt axis plt.bar() plt.axis import figure pyplot highlight_text pypalettes plt.subplots() xlabel ylabel title legend colorbar savefig tight_layout grid set_xlim set_ylim plot scatter hist boxplot imshow cmap alpha bins tick_params annotate quiver contour barh stackplot subplots_adjust axhline axvline semilogx semilogy loglog polar streamplot hexbin pcolor tricontour errorbar clabel set_aspect violinplot set_axis_off spines text hatch plt axis plt.bar() plt.axis import figure pyplot highlight_text pypalettes plt.subplots() xlabel ylabel title legend colorbar savefig tight_layout grid set_xlim set_ylim plot scatter hist boxplot imshow cmap alpha bins tick_params annotate quiver contour barh stackplot subplots_adjust axhline axvline semilogx semilogy loglog polar streamplot hexbin pcolor tricontour errorbar clabel set_aspect violinplot set_axis_off spines text hatch plt axis plt.bar() plt.axis import figure pyplot highlight_text pypalettes plt.subplots() xlabel ylabel title legend colorbar savefig tight_layout grid set_xlim set_ylim plot scatter hist boxplot imshow cmap alpha bins tick_params annotate quiver contour barh stackplot subplots_adjust axhline axvline semilogx semilogy loglog polar streamplot hexbin pcolor tricontour errorbar clabel set_aspect violinplot set_axis_off spines text hatch plt axis plt.bar() plt.axis import figure pyplot highlight_text pypalettes plt.subplots() xlabel ylabel title legend colorbar savefig tight_layout grid set_xlim set_ylim plot scatter hist boxplot imshow cmap alpha bins tick_params annotate quiver contour barh stackplot subplots_adjust axhline axvline semilogx semilogy loglog polar streamplot hexbin pcolor tricontour errorbar clabel set_aspect violinplot set_axis_off spines text hatch plt axis plt.bar() plt.axis import figure pyplot highlight_text pypalettes plt.subplots() xlabel ylabel title legend colorbar savefig tight_layout grid set_xlim set_ylim plot scatter hist boxplot imshow cmap alpha bins tick_params annotate quiver contour barh stackplot subplots_adjust axhline axvline semilogx semilogy loglog polar streamplot hexbin pcolor tricontour errorbar clabel set_aspect violinplot set_axis_off spines text hatch plt axis plt.bar() plt.axis import figure pyplot highlight_text pypalettes plt.subplots() xlabel ylabel title legend colorbar savefig tight_layout grid set_xlim set_ylim plot scatter hist boxplot imshow cmap alpha bins tick_params annotate quiver contour barh stackplot subplots_adjust axhline axvline semilogx semilogy loglog polar streamplot hexbin pcolor tricontour errorbar clabel set_aspect violinplot set_axis_off spines text hatch plt axis plt.bar() plt.axis import figure pyplot highlight_text pypalettes plt.subplots() xlabel ylabel title legend colorbar savefig tight_layout grid set_xlim set_ylim plot scatter hist boxplot imshow cmap alpha bins tick_params annotate quiver contour barh stackplot subplots_adjust axhline axvline semilogx semilogy loglog polar streamplot hexbin pcolor tricontour errorbar clabel set_aspect violinplot set_axis_off spines text hatch plt axis plt.bar() plt.axis import figure pyplot highlight_text pypalettes plt.subplots() xlabel ylabel title legend colorbar savefig tight_layout grid set_xlim set_ylim plot scatter hist boxplot imshow cmap alpha bins tick_params annotate quiver contour barh stackplot subplots_adjust axhline axvline semilogx semilogy loglog polar streamplot hexbin pcolor tricontour errorbar clabel set_aspect violinplot set_axis_off spines text hatch plt axis plt.bar() plt.axis import figure pyplot highlight_text pypalettes plt.subplots() xlabel ylabel title legend colorbar savefig tight_layout grid set_xlim set_ylim plot scatter hist boxplot imshow cmap alpha bins tick_params annotate quiver contour barh stackplot subplots_adjust axhline axvline semilogx semilogy loglog polar streamplot hexbin pcolor tricontour errorbar clabel set_aspect violinplot set_axis_off spines text hatch plt axis plt.bar() plt.axis import figure pyplot highlight_text pypalettes plt.subplots() xlabel ylabel title legend colorbar savefig tight_layout grid set_xlim set_ylim plot scatter hist boxplot imshow cmap alpha bins tick_params annotate quiver contour barh stackplot subplots_adjust axhline axvline semilogx semilogy loglog polar streamplot hexbin pcolor tricontour errorbar clabel set_aspect violinplot set_axis_off spines text hatch plt axis plt.bar() plt.axis import figure pyplot highlight_text pypalettes plt.subplots() xlabel ylabel title legend colorbar savefig tight_layout grid set_xlim set_ylim plot scatter hist boxplot imshow cmap alpha bins tick_params annotate quiver contour barh stackplot subplots_adjust axhline axvline semilogx semilogy loglog polar streamplot hexbin pcolor tricontour errorbar clabel set_aspect violinplot set_axis_off spines text hatch plt axis plt.bar() plt.axis import figure pyplot highlight_text pypalettes plt.subplots() xlabel ylabel title legend colorbar savefig tight_layout grid set_xlim set_ylim plot scatter hist boxplot imshow cmap alpha bins tick_params annotate quiver contour barh stackplot subplots_adjust axhline axvline semilogx semilogy loglog polar streamplot hexbin pcolor tricontour errorbar clabel set_aspect violinplot set_axis_off spines text hatch plt axis plt.bar() plt.axis import figure pyplot highlight_text pypalettes plt.subplots() xlabel ylabel title legend colorbar savefig tight_layout grid set_xlim set_ylim plot scatter hist boxplot imshow cmap alpha bins tick_params annotate quiver contour barh stackplot subplots_adjust axhline axvline semilogx semilogy loglog polar streamplot hexbin pcolor tricontour errorbar clabel set_aspect violinplot set_axis_off spines text hatch plt axis plt.bar() plt.axis import figure pyplot highlight_text pypalettes plt.subplots() xlabel ylabel title legend colorbar savefig tight_layout grid set_xlim set_ylim plot scatter hist boxplot imshow cmap alpha bins tick_params annotate quiver contour barh stackplot subplots_adjust axhline axvline semilogx semilogy loglog polar streamplot hexbin pcolor tricontour errorbar clabel set_aspect violinplot set_axis_off spines text hatch plt axis plt.bar() plt.axis import figure pyplot highlight_text pypalettes plt.subplots() xlabel ylabel title legend colorbar savefig tight_layout grid set_xlim set_ylim plot scatter hist boxplot imshow cmap alpha bins tick_params annotate quiver contour barh stackplot subplots_adjust axhline axvline semilogx semilogy loglog polar streamplot hexbin pcolor tricontour errorbar clabel set_aspect violinplot set_axis_off spines text hatch plt axis plt.bar() plt.axis import figure pyplot highlight_text pypalettes plt.subplots() xlabel ylabel title legend colorbar savefig tight_layout grid set_xlim set_ylim plot scatter hist boxplot imshow cmap alpha bins tick_params annotate quiver contour barh stackplot subplots_adjust axhline axvline semilogx semilogy loglog polar streamplot hexbin pcolor tricontour errorbar clabel set_aspect violinplot set_axis_off spines text hatch plt axis plt.bar() plt.axis import figure pyplot highlight_text pypalettes plt.subplots() xlabel ylabel title legend colorbar savefig tight_layout grid set_xlim set_ylim plot scatter hist boxplot imshow cmap alpha bins tick_params annotate quiver contour barh stackplot subplots_adjust axhline axvline semilogx semilogy loglog polar streamplot hexbin pcolor tricontour errorbar clabel set_aspect violinplot set_axis_off spines text hatch plt axis plt.bar() plt.axis import figure pyplot highlight_text pypalettes plt.subplots() xlabel ylabel title legend colorbar savefig tight_layout grid set_xlim set_ylim plot scatter hist boxplot imshow cmap alpha bins tick_params annotate quiver contour barh stackplot subplots_adjust axhline axvline semilogx semilogy loglog polar streamplot hexbin pcolor tricontour errorbar clabel set_aspect violinplot set_axis_off spines text hatch plt axis plt.bar() plt.axis import figure pyplot highlight_text pypalettes plt.subplots() xlabel ylabel title legend colorbar savefig tight_layout grid set_xlim set_ylim plot scatter hist boxplot imshow cmap alpha bins tick_params annotate quiver contour barh stackplot subplots_adjust axhline axvline semilogx semilogy loglog polar streamplot hexbin pcolor tricontour errorbar clabel set_aspect violinplot set_axis_off spines text hatch plt axis plt.bar() plt.axis import figure pyplot highlight_text pypalettes plt.subplots() xlabel ylabel title legend colorbar savefig tight_layout grid set_xlim set_ylim plot scatter hist boxplot imshow cmap alpha bins tick_params annotate quiver contour barh stackplot subplots_adjust axhline axvline semilogx semilogy loglog polar streamplot hexbin pcolor tricontour errorbar clabel set_aspect violinplot set_axis_off spines text hatch plt axis plt.bar() plt.axis import figure pyplot highlight_text pypalettes plt.subplots() xlabel ylabel title legend colorbar savefig tight_layout grid set_xlim set_ylim plot scatter hist boxplot imshow cmap alpha bins tick_params annotate quiver contour barh stackplot subplots_adjust axhline axvline semilogx semilogy loglog polar streamplot hexbin pcolor tricontour errorbar clabel set_aspect violinplot set_axis_off spines text hatch plt axis plt.bar() plt.axis import figure pyplot highlight_text pypalettes plt.subplots() xlabel ylabel title legend colorbar savefig tight_layout grid set_xlim set_ylim plot scatter hist boxplot imshow cmap alpha bins tick_params annotate quiver contour barh stackplot subplots_adjust axhline axvline semilogx semilogy loglog polar streamplot hexbin pcolor tricontour errorbar clabel set_aspect violinplot set_axis_off spines text hatch plt axis plt.bar() plt.axis import figure pyplot highlight_text pypalettes plt.subplots() xlabel ylabel title legend colorbar savefig tight_layout grid set_xlim set_ylim plot scatter hist boxplot imshow cmap alpha bins tick_params annotate quiver contour barh stackplot subplots_adjust axhline axvline semilogx semilogy loglog polar streamplot hexbin pcolor tricontour errorbar clabel set_aspect violinplot set_axis_off spines text hatch plt axis plt.bar() plt.axis import figure pyplot highlight_text pypalettes plt.subplots() xlabel ylabel title legend colorbar savefig tight_layout grid set_xlim set_ylim plot scatter hist boxplot imshow cmap alpha bins tick_params annotate quiver contour barh stackplot subplots_adjust axhline axvline semilogx semilogy loglog polar streamplot hexbin pcolor tricontour errorbar clabel set_aspect violinplot set_axis_off spines text hatch plt axis plt.bar() plt.axis import figure pyplot highlight_text pypalettes plt.subplots() xlabel ylabel title legend colorbar savefig tight_layout grid set_xlim set_ylim plot scatter hist boxplot imshow cmap alpha bins tick_params annotate quiver contour barh stackplot subplots_adjust axhline axvline semilogx semilogy loglog polar streamplot hexbin pcolor tricontour errorbar clabel set_aspect violinplot set_axis_off spines text hatch plt axis plt.bar() plt.axis import figure pyplot highlight_text pypalettes plt.subplots() xlabel ylabel title legend colorbar savefig tight_layout grid set_xlim set_ylim plot scatter hist boxplot imshow cmap alpha bins tick_params annotate quiver contour barh stackplot subplots_adjust axhline axvline semilogx semilogy loglog polar streamplot hexbin pcolor tricontour errorbar clabel set_aspect violinplot set_axis_off spines text hatch plt axis plt.bar() plt.axis import figure pyplot highlight_text pypalettes plt.subplots() xlabel ylabel title legend colorbar savefig tight_layout grid set_xlim set_ylim plot scatter hist boxplot imshow cmap alpha bins tick_params annotate quiver contour barh stackplot subplots_adjust axhline axvline semilogx semilogy loglog polar streamplot hexbin pcolor tricontour errorbar clabel set_aspect violinplot set_axis_off spines text hatch plt axis plt.bar() plt.axis import figure pyplot highlight_text pypalettes plt.subplots() xlabel ylabel title legend colorbar savefig tight_layout grid set_xlim set_ylim plot scatter hist boxplot imshow cmap alpha bins tick_params annotate quiver contour barh stackplot subplots_adjust axhline axvline semilogx semilogy loglog polar streamplot hexbin pcolor tricontour errorbar clabel set_aspect violinplot set_axis_off spines text hatch plt axis plt.bar() plt.axis import figure pyplot highlight_text pypalettes plt.subplots() xlabel ylabel title legend colorbar savefig tight_layout grid set_xlim set_ylim plot scatter hist boxplot imshow cmap alpha bins tick_params annotate quiver contour barh stackplot subplots_adjust axhline axvline semilogx semilogy loglog polar streamplot hexbin pcolor tricontour errorbar clabel set_aspect violinplot set_axis_off spines text hatch plt axis plt.bar() plt.axis import figure pyplot highlight_text pypalettes plt.subplots() xlabel ylabel title legend colorbar savefig tight_layout grid set_xlim set_ylim plot scatter hist boxplot imshow cmap alpha bins tick_params annotate quiver contour barh stackplot subplots_adjust axhline axvline semilogx semilogy loglog polar streamplot hexbin pcolor tricontour errorbar clabel set_aspect violinplot set_axis_off spines text hatch plt axis plt.bar() plt.axis import figure pyplot highlight_text pypalettes plt.subplots() xlabel ylabel title legend colorbar savefig tight_layout grid set_xlim set_ylim plot scatter hist boxplot imshow cmap alpha bins tick_params annotate quiver contour barh stackplot subplots_adjust axhline axvline semilogx semilogy loglog polar streamplot hexbin pcolor tricontour errorbar clabel set_aspect violinplot set_axis_off spines text hatch plt axis plt.bar() plt.axis import figure pyplot highlight_text pypalettes plt.subplots() xlabel ylabel title legend colorbar savefig tight_layout grid set_xlim set_ylim plot scatter hist boxplot imshow cmap alpha bins tick_params annotate quiver contour barh stackplot subplots_adjust axhline axvline semilogx semilogy loglog polar streamplot hexbin pcolor tricontour errorbar clabel set_aspect violinplot set_axis_off spines text hatch plt axis plt.bar() plt.axis import figure pyplot highlight_text pypalettes plt.subplots() xlabel ylabel title legend colorbar savefig tight_layout grid set_xlim set_ylim plot scatter hist boxplot imshow cmap alpha bins tick_params annotate quiver contour barh stackplot subplots_adjust axhline axvline semilogx semilogy loglog polar streamplot hexbin pcolor tricontour errorbar clabel set_aspect violinplot set_axis_off spines text hatch plt axis plt.bar() plt.axis import figure pyplot highlight_text pypalettes plt.subplots() xlabel ylabel title legend colorbar savefig tight_layout grid set_xlim set_ylim plot scatter hist boxplot imshow cmap alpha bins tick_params annotate quiver contour barh stackplot subplots_adjust axhline axvline semilogx semilogy loglog polar streamplot hexbin pcolor tricontour errorbar clabel set_aspect violinplot set_axis_off spines text hatch plt axis plt.bar() plt.axis import figure pyplot highlight_text pypalettes plt.subplots() xlabel ylabel title legend colorbar savefig tight_layout grid set_xlim set_ylim plot scatter hist boxplot imshow cmap alpha bins tick_params annotate quiver contour barh stackplot subplots_adjust axhline axvline semilogx semilogy loglog polar streamplot hexbin pcolor tricontour errorbar clabel set_aspect violinplot set_axis_off spines text hatch plt axis plt.bar() plt.axis import figure pyplot highlight_text pypalettes plt.subplots() xlabel ylabel title legend colorbar savefig tight_layout grid set_xlim set_ylim plot scatter hist boxplot imshow cmap alpha bins tick_params annotate quiver contour barh stackplot subplots_adjust axhline axvline semilogx semilogy loglog polar streamplot hexbin pcolor tricontour errorbar clabel set_aspect violinplot set_axis_off spines text hatch plt axis plt.bar() plt.axis import figure pyplot highlight_text pypalettes plt.subplots() xlabel ylabel title legend colorbar savefig tight_layout grid set_xlim set_ylim plot scatter hist boxplot imshow cmap alpha bins tick_params annotate quiver contour barh stackplot subplots_adjust axhline axvline semilogx semilogy loglog polar streamplot hexbin pcolor tricontour errorbar clabel set_aspect violinplot set_axis_off spines text hatch plt axis plt.bar() plt.axis import figure pyplot highlight_text pypalettes plt.subplots() xlabel ylabel title legend colorbar savefig tight_layout grid set_xlim set_ylim plot scatter hist boxplot imshow cmap alpha bins tick_params annotate quiver contour barh stackplot subplots_adjust axhline axvline semilogx semilogy loglog polar streamplot hexbin pcolor tricontour errorbar clabel set_aspect violinplot set_axis_off spines text hatch plt axis plt.bar() plt.axis import figure pyplot highlight_text pypalettes plt.subplots() xlabel ylabel title legend colorbar savefig tight_layout grid set_xlim set_ylim plot scatter hist boxplot imshow cmap alpha bins tick_params annotate quiver contour barh stackplot subplots_adjust axhline axvline semilogx semilogy loglog polar streamplot hexbin pcolor tricontour errorbar clabel set_aspect violinplot set_axis_off spines text hatch plt axis plt.bar() plt.axis import figure pyplot highlight_text pypalettes plt.subplots() xlabel ylabel title legend colorbar savefig tight_layout grid set_xlim set_ylim plot scatter hist boxplot imshow cmap alpha bins tick_params annotate quiver contour barh stackplot subplots_adjust axhline axvline semilogx semilogy loglog polar streamplot hexbin pcolor tricontour errorbar clabel set_aspect violinplot set_axis_off spines text hatch plt axis plt.bar() plt.axis import figure pyplot highlight_text pypalettes plt.subplots() xlabel ylabel title legend colorbar savefig tight_layout grid set_xlim set_ylim plot scatter hist boxplot imshow cmap alpha bins tick_params annotate quiver contour barh stackplot subplots_adjust axhline axvline semilogx semilogy loglog polar streamplot hexbin pcolor tricontour errorbar clabel set_aspect violinplot set_axis_off spines text hatch plt axis plt.bar() plt.axis import figure pyplot highlight_text pypalettes plt.subplots() xlabel ylabel title legend colorbar savefig tight_layout grid set_xlim set_ylim plot scatter hist boxplot imshow cmap alpha bins tick_params annotate quiver contour barh stackplot subplots_adjust axhline axvline semilogx semilogy loglog polar streamplot hexbin pcolor tricontour errorbar clabel set_aspect violinplot set_axis_off spines text hatch plt axis plt.bar() plt.axis import figure pyplot highlight_text pypalettes plt.subplots() xlabel ylabel title legend colorbar savefig tight_layout grid set_xlim set_ylim plot scatter hist boxplot imshow cmap alpha bins tick_params annotate quiver contour barh stackplot subplots_adjust axhline axvline semilogx semilogy loglog polar streamplot hexbin pcolor tricontour errorbar clabel set_aspect violinplot set_axis_off spines text hatch plt axis plt.bar() plt.axis import figure pyplot highlight_text pypalettes plt.subplots() xlabel ylabel title legend colorbar savefig tight_layout grid set_xlim set_ylim plot scatter hist boxplot imshow cmap alpha bins tick_params annotate quiver contour barh stackplot subplots_adjust axhline axvline semilogx semilogy loglog polar streamplot hexbin pcolor tricontour errorbar clabel set_aspect violinplot set_axis_off spines text hatch plt axis plt.bar() plt.axis import figure pyplot highlight_text pypalettes plt.subplots() xlabel ylabel title legend colorbar savefig tight_layout grid set_xlim set_ylim plot scatter hist boxplot imshow cmap alpha bins tick_params annotate quiver contour barh stackplot subplots_adjust axhline axvline semilogx semilogy loglog polar streamplot hexbin pcolor tricontour errorbar clabel set_aspect violinplot set_axis_off spines text hatch plt axis plt.bar() plt.axis import figure pyplot highlight_text pypalettes plt.subplots() xlabel ylabel title legend colorbar savefig tight_layout grid set_xlim set_ylim plot scatter hist boxplot imshow cmap alpha bins tick_params annotate quiver contour barh stackplot subplots_adjust axhline axvline semilogx semilogy loglog polar streamplot hexbin pcolor tricontour errorbar clabel set_aspect violinplot set_axis_off spines text hatch plt axis plt.bar() plt.axis import figure pyplot highlight_text pypalettes plt.subplots() xlabel ylabel title legend colorbar savefig tight_layout grid set_xlim set_ylim plot scatter hist boxplot imshow cmap alpha bins tick_params annotate quiver contour barh stackplot subplots_adjust axhline axvline semilogx semilogy loglog polar streamplot hexbin pcolor tricontour errorbar clabel set_aspect violinplot set_axis_off spines text hatch plt axis plt.bar() plt.axis import figure pyplot highlight_text pypalettes plt.subplots() xlabel ylabel title legend colorbar savefig tight_layout grid set_xlim set_ylim plot scatter hist boxplot imshow cmap alpha bins tick_params annotate quiver contour barh stackplot subplots_adjust axhline axvline semilogx semilogy loglog polar streamplot hexbin pcolor tricontour errorbar clabel set_aspect violinplot set_axis_off spines text hatch plt axis plt.bar() plt.axis import figure pyplot highlight_text pypalettes plt.subplots() xlabel ylabel title legend colorbar savefig tight_layout grid set_xlim set_ylim plot scatter hist boxplot imshow cmap alpha bins tick_params annotate quiver contour barh stackplot subplots_adjust axhline axvline semilogx semilogy loglog polar streamplot hexbin pcolor tricontour errorbar clabel set_aspect violinplot set_axis_off spines text hatch plt axis plt.bar() plt.axis import figure pyplot highlight_text pypalettes plt.subplots() xlabel ylabel title legend colorbar savefig tight_layout grid set_xlim set_ylim plot scatter hist boxplot imshow cmap alpha bins tick_params annotate quiver contour barh stackplot subplots_adjust axhline axvline semilogx semilogy loglog polar streamplot hexbin pcolor tricontour errorbar clabel set_aspect violinplot set_axis_off spines text hatch plt axis plt.bar() plt.axis import figure pyplot highlight_text pypalettes plt.subplots() xlabel ylabel title legend colorbar savefig tight_layout grid set_xlim set_ylim plot scatter hist boxplot imshow cmap alpha bins tick_params annotate quiver contour barh stackplot subplots_adjust axhline axvline semilogx semilogy loglog polar streamplot hexbin pcolor tricontour errorbar clabel set_aspect violinplot set_axis_off spines text hatch plt axis plt.bar() plt.axis import figure pyplot highlight_text pypalettes plt.subplots() xlabel ylabel title legend colorbar savefig tight_layout grid set_xlim set_ylim plot scatter hist boxplot imshow cmap alpha bins tick_params annotate quiver contour barh stackplot subplots_adjust axhline axvline semilogx semilogy loglog polar streamplot hexbin pcolor tricontour errorbar clabel set_aspect violinplot set_axis_off spines text hatch plt axis plt.bar() plt.axis import figure pyplot highlight_text pypalettes plt.subplots() xlabel ylabel title legend colorbar savefig tight_layout grid set_xlim set_ylim plot scatter hist boxplot imshow cmap alpha bins tick_params annotate quiver contour barh stackplot subplots_adjust axhline axvline semilogx semilogy loglog polar streamplot hexbin pcolor tricontour errorbar clabel set_aspect violinplot set_axis_off spines text hatch plt axis plt.bar() plt.axis import figure pyplot highlight_text pypalettes plt.subplots() xlabel ylabel title legend colorbar savefig tight_layout grid set_xlim set_ylim plot scatter hist boxplot imshow cmap alpha bins tick_params annotate quiver contour barh stackplot subplots_adjust axhline axvline semilogx semilogy loglog polar streamplot hexbin pcolor tricontour errorbar clabel set_aspect violinplot set_axis_off spines text hatch plt axis plt.bar() plt.axis import figure pyplot highlight_text pypalettes plt.subplots() xlabel ylabel title legend colorbar savefig tight_layout grid set_xlim set_ylim plot scatter hist boxplot imshow cmap alpha bins tick_params annotate quiver contour barh stackplot subplots_adjust axhline axvline semilogx semilogy loglog polar streamplot hexbin pcolor tricontour errorbar clabel set_aspect violinplot set_axis_off spines text hatch plt axis plt.bar() plt.axis import figure pyplot highlight_text pypalettes plt.subplots() xlabel ylabel title legend colorbar savefig tight_layout grid set_xlim set_ylim plot scatter hist boxplot imshow cmap alpha bins tick_params annotate quiver contour barh stackplot subplots_adjust axhline axvline semilogx semilogy loglog polar streamplot hexbin pcolor tricontour errorbar clabel set_aspect violinplot set_axis_off spines text hatch plt axis plt.bar() plt.axis import figure pyplot highlight_text pypalettes plt.subplots() xlabel ylabel title legend colorbar savefig tight_layout grid set_xlim set_ylim plot scatter hist boxplot imshow cmap alpha bins tick_params annotate quiver contour barh stackplot subplots_adjust axhline axvline semilogx semilogy loglog polar streamplot hexbin pcolor tricontour errorbar clabel set_aspect violinplot set_axis_off spines text hatch plt axis plt.bar() plt.axis import figure pyplot highlight_text pypalettes plt.subplots() xlabel ylabel title legend colorbar savefig tight_layout grid set_xlim set_ylim plot scatter hist boxplot imshow cmap alpha bins tick_params annotate quiver contour barh stackplot subplots_adjust axhline axvline semilogx semilogy loglog polar streamplot hexbin pcolor tricontour errorbar clabel set_aspect violinplot set_axis_off spines text hatch plt axis plt.bar() plt.axis import figure pyplot highlight_text pypalettes plt.subplots() xlabel ylabel title legend colorbar savefig tight_layout grid set_xlim set_ylim plot scatter hist boxplot imshow cmap alpha bins tick_params annotate quiver contour barh stackplot subplots_adjust axhline axvline semilogx semilogy loglog polar streamplot hexbin pcolor tricontour errorbar clabel set_aspect violinplot set_axis_off spines text hatch plt axis plt.bar() plt.axis import figure pyplot highlight_text pypalettes plt.subplots() xlabel ylabel title legend colorbar savefig tight_layout grid set_xlim set_ylim plot scatter hist boxplot imshow cmap alpha bins tick_params annotate quiver contour barh stackplot subplots_adjust axhline axvline semilogx semilogy loglog polar streamplot hexbin pcolor tricontour errorbar clabel set_aspect violinplot set_axis_off spines text hatch plt axis plt.bar() plt.axis import figure pyplot highlight_text pypalettes plt.subplots() xlabel ylabel title legend colorbar savefig tight_layout grid set_xlim set_ylim plot scatter hist boxplot imshow cmap alpha bins tick_params annotate quiver contour barh stackplot subplots_adjust axhline axvline semilogx semilogy loglog polar streamplot hexbin pcolor tricontour errorbar clabel set_aspect violinplot set_axis_off spines text hatch plt axis plt.bar() plt.axis import figure pyplot highlight_text pypalettes plt.subplots() xlabel ylabel title legend colorbar savefig tight_layout grid set_xlim set_ylim plot scatter hist boxplot imshow cmap alpha bins tick_params annotate quiver contour barh stackplot subplots_adjust axhline axvline semilogx semilogy loglog polar streamplot hexbin pcolor tricontour errorbar clabel set_aspect violinplot set_axis_off spines text hatch plt axis plt.bar() plt.axis import figure pyplot highlight_text pypalettes plt.subplots() xlabel ylabel title legend colorbar savefig tight_layout grid set_xlim set_ylim plot scatter hist boxplot imshow cmap alpha bins tick_params annotate quiver contour barh stackplot subplots_adjust axhline axvline semilogx semilogy loglog polar streamplot hexbin pcolor tricontour errorbar clabel set_aspect violinplot set_axis_off spines text hatch plt axis plt.bar() plt.axis import figure pyplot highlight_text pypalettes plt.subplots() xlabel ylabel title legend colorbar savefig tight_layout grid set_xlim set_ylim plot scatter hist boxplot imshow cmap alpha bins tick_params annotate quiver contour barh stackplot subplots_adjust axhline axvline semilogx semilogy loglog polar streamplot hexbin pcolor tricontour errorbar clabel set_aspect violinplot set_axis_off spines text hatch plt axis plt.bar() plt.axis import figure pyplot highlight_text pypalettes plt.subplots() xlabel ylabel title legend colorbar savefig tight_layout grid set_xlim set_ylim plot scatter hist boxplot imshow cmap alpha bins tick_params annotate quiver contour barh stackplot subplots_adjust axhline axvline semilogx semilogy loglog polar streamplot hexbin pcolor tricontour errorbar clabel set_aspect violinplot set_axis_off spines text hatch plt axis plt.bar() plt.axis import figure pyplot highlight_text pypalettes plt.subplots() xlabel ylabel title legend colorbar savefig tight_layout grid set_xlim set_ylim plot scatter hist boxplot imshow cmap alpha bins tick_params annotate quiver contour barh stackplot subplots_adjust axhline axvline semilogx semilogy loglog polar streamplot hexbin pcolor tricontour errorbar clabel set_aspect violinplot set_axis_off spines text hatch plt axis plt.bar() plt.axis import figure pyplot highlight_text pypalettes plt.subplots() xlabel ylabel title legend colorbar savefig tight_layout grid set_xlim set_ylim plot scatter hist boxplot imshow cmap alpha bins tick_params annotate quiver contour barh stackplot subplots_adjust axhline axvline semilogx semilogy loglog polar streamplot hexbin pcolor tricontour errorbar clabel set_aspect violinplot set_axis_off spines text hatch plt axis plt.bar() plt.axis import figure pyplot highlight_text pypalettes plt.subplots() xlabel ylabel title legend colorbar savefig tight_layout grid set_xlim set_ylim plot scatter hist boxplot imshow cmap alpha bins tick_params annotate quiver contour barh stackplot subplots_adjust axhline axvline semilogx semilogy loglog polar streamplot hexbin pcolor tricontour errorbar clabel set_aspect violinplot set_axis_off spines text hatch plt axis plt.bar() plt.axis import figure pyplot highlight_text pypalettes plt.subplots() xlabel ylabel title legend colorbar savefig tight_layout grid set_xlim set_ylim plot scatter hist boxplot imshow cmap alpha bins tick_params annotate quiver contour barh stackplot subplots_adjust axhline axvline semilogx semilogy loglog polar streamplot hexbin pcolor tricontour errorbar clabel set_aspect violinplot set_axis_off spines text hatch plt axis plt.bar() plt.axis import figure pyplot highlight_text pypalettes plt.subplots() xlabel ylabel title legend colorbar savefig tight_layout grid set_xlim set_ylim plot scatter hist boxplot imshow cmap alpha bins tick_params annotate quiver contour barh stackplot subplots_adjust axhline axvline semilogx semilogy loglog polar streamplot hexbin pcolor tricontour errorbar clabel set_aspect violinplot set_axis_off spines text hatch plt axis plt.bar() plt.axis import figure pyplot highlight_text pypalettes plt.subplots() xlabel ylabel title legend colorbar savefig tight_layout grid set_xlim set_ylim plot scatter hist boxplot imshow cmap alpha bins tick_params annotate quiver contour barh stackplot subplots_adjust axhline axvline semilogx semilogy loglog polar streamplot hexbin pcolor tricontour errorbar clabel set_aspect violinplot set_axis_off spines text hatch plt axis plt.bar() plt.axis import figure pyplot highlight_text pypalettes plt.subplots() xlabel ylabel title legend colorbar savefig tight_layout grid set_xlim set_ylim plot scatter hist boxplot imshow cmap alpha bins tick_params annotate quiver contour barh stackplot subplots_adjust axhline axvline semilogx semilogy loglog polar streamplot hexbin pcolor tricontour errorbar clabel set_aspect violinplot set_axis_off spines text hatch plt axis plt.bar() plt.axis import figure pyplot highlight_text pypalettes plt.subplots() xlabel ylabel title legend colorbar savefig tight_layout grid set_xlim set_ylim plot scatter hist boxplot imshow cmap alpha bins tick_params annotate quiver contour barh stackplot subplots_adjust axhline axvline semilogx semilogy loglog polar streamplot hexbin pcolor tricontour errorbar clabel set_aspect violinplot set_axis_off spines text hatch plt axis plt.bar() plt.axis import figure pyplot highlight_text pypalettes plt.subplots() xlabel ylabel title legend colorbar savefig tight_layout grid set_xlim set_ylim plot scatter hist boxplot imshow cmap alpha bins tick_params annotate quiver contour barh stackplot subplots_adjust axhline axvline semilogx semilogy loglog polar streamplot hexbin pcolor tricontour errorbar clabel set_aspect violinplot set_axis_off spines text hatch plt axis plt.bar() plt.axis import figure pyplot highlight_text pypalettes plt.subplots() xlabel ylabel title legend colorbar savefig tight_layout grid set_xlim set_ylim plot scatter hist boxplot imshow cmap alpha bins tick_params annotate quiver contour barh stackplot subplots_adjust axhline axvline semilogx semilogy loglog polar streamplot hexbin pcolor tricontour errorbar clabel set_aspect violinplot set_axis_off spines text hatch plt axis plt.bar() plt.axis import figure pyplot highlight_text pypalettes plt.subplots() xlabel ylabel title legend colorbar savefig tight_layout grid set_xlim set_ylim plot scatter hist boxplot imshow cmap alpha bins tick_params annotate quiver contour barh stackplot subplots_adjust axhline axvline semilogx semilogy loglog polar streamplot hexbin pcolor tricontour errorbar clabel set_aspect violinplot set_axis_off spines text hatch plt axis plt.bar() plt.axis import figure pyplot highlight_text pypalettes plt.subplots() xlabel ylabel title legend colorbar savefig tight_layout grid set_xlim set_ylim plot scatter hist boxplot imshow cmap alpha bins tick_params annotate quiver contour barh stackplot subplots_adjust axhline axvline semilogx semilogy loglog polar streamplot hexbin pcolor tricontour errorbar clabel set_aspect violinplot set_axis_off spines text hatch plt axis plt.bar() plt.axis import figure pyplot highlight_text pypalettes plt.subplots() xlabel ylabel title legend colorbar savefig tight_layout grid set_xlim set_ylim plot scatter hist boxplot imshow cmap alpha bins tick_params annotate quiver contour barh stackplot subplots_adjust axhline axvline semilogx semilogy loglog polar streamplot hexbin pcolor tricontour errorbar clabel set_aspect violinplot set_axis_off spines text hatch plt axis plt.bar() plt.axis import figure pyplot highlight_text pypalettes plt.subplots() xlabel ylabel title legend colorbar savefig tight_layout grid set_xlim set_ylim plot scatter hist boxplot imshow cmap alpha bins tick_params annotate quiver contour barh stackplot subplots_adjust axhline axvline semilogx semilogy loglog polar streamplot hexbin pcolor tricontour errorbar clabel set_aspect violinplot set_axis_off spines text hatch plt axis plt.bar() plt.axis import figure pyplot highlight_text pypalettes plt.subplots() xlabel ylabel title legend colorbar savefig tight_layout grid set_xlim set_ylim plot scatter hist boxplot imshow cmap alpha bins tick_params annotate quiver contour barh stackplot subplots_adjust axhline axvline semilogx semilogy loglog polar streamplot hexbin pcolor tricontour errorbar clabel set_aspect violinplot set_axis_off spines text hatch plt axis plt.bar() plt.axis import figure pyplot highlight_text pypalettes plt.subplots() xlabel ylabel title legend colorbar savefig tight_layout grid set_xlim set_ylim plot scatter hist boxplot imshow cmap alpha bins tick_params annotate quiver contour barh stackplot subplots_adjust axhline axvline semilogx semilogy loglog polar streamplot hexbin pcolor tricontour errorbar clabel set_aspect violinplot set_axis_off spines text hatch plt axis plt.bar() plt.axis import figure pyplot highlight_text pypalettes plt.subplots() xlabel ylabel title legend colorbar savefig tight_layout grid set_xlim set_ylim plot scatter hist boxplot imshow cmap alpha bins tick_params annotate quiver contour barh stackplot subplots_adjust axhline axvline semilogx semilogy loglog polar streamplot hexbin pcolor tricontour errorbar clabel set_aspect violinplot set_axis_off spines text hatch plt axis plt.bar() plt.axis import figure pyplot highlight_text pypalettes plt.subplots() xlabel ylabel title legend colorbar savefig tight_layout grid set_xlim set_ylim plot scatter hist boxplot imshow cmap alpha bins tick_params annotate quiver contour barh stackplot subplots_adjust axhline axvline semilogx semilogy loglog polar streamplot hexbin pcolor tricontour errorbar clabel set_aspect violinplot set_axis_off spines text hatch plt axis plt.bar() plt.axis import figure pyplot highlight_text pypalettes plt.subplots() xlabel ylabel title legend colorbar savefig tight_layout grid set_xlim set_ylim plot scatter hist boxplot imshow cmap alpha bins tick_params annotate quiver contour barh stackplot subplots_adjust axhline axvline semilogx semilogy loglog polar streamplot hexbin pcolor tricontour errorbar clabel set_aspect violinplot set_axis_off spines text hatch plt axis plt.bar() plt.axis import figure pyplot highlight_text pypalettes plt.subplots() xlabel ylabel title legend colorbar savefig tight_layout grid set_xlim set_ylim plot scatter hist boxplot imshow cmap alpha bins tick_params annotate quiver contour barh stackplot subplots_adjust axhline axvline semilogx semilogy loglog polar streamplot hexbin pcolor tricontour errorbar clabel set_aspect violinplot set_axis_off spines text hatch plt axis plt.bar() plt.axis import figure pyplot highlight_text pypalettes plt.subplots() xlabel ylabel title legend colorbar savefig tight_layout grid set_xlim set_ylim plot scatter hist boxplot imshow cmap alpha bins tick_params annotate quiver contour barh stackplot subplots_adjust axhline axvline semilogx semilogy loglog polar streamplot hexbin pcolor tricontour errorbar clabel set_aspect violinplot set_axis_off spines text hatch plt axis plt.bar() plt.axis import figure pyplot highlight_text pypalettes plt.subplots() xlabel ylabel title legend colorbar savefig tight_layout grid set_xlim set_ylim plot scatter hist boxplot imshow cmap alpha bins tick_params annotate quiver contour barh stackplot subplots_adjust axhline axvline semilogx semilogy loglog polar streamplot hexbin pcolor tricontour errorbar clabel set_aspect violinplot set_axis_off spines text hatch plt axis plt.bar() plt.axis import figure pyplot highlight_text pypalettes plt.subplots() xlabel ylabel title legend colorbar savefig tight_layout grid set_xlim set_ylim plot scatter hist boxplot imshow cmap alpha bins tick_params annotate quiver contour barh stackplot subplots_adjust axhline axvline semilogx semilogy loglog polar streamplot hexbin pcolor tricontour errorbar clabel set_aspect violinplot set_axis_off spines text hatch plt axis plt.bar() plt.axis import figure pyplot highlight_text pypalettes plt.subplots() xlabel ylabel title legend colorbar savefig tight_layout grid set_xlim set_ylim plot scatter hist boxplot imshow cmap alpha bins tick_params annotate quiver contour barh stackplot subplots_adjust axhline axvline semilogx semilogy loglog polar streamplot hexbin pcolor tricontour errorbar clabel set_aspect violinplot set_axis_off spines text hatch plt axis plt.bar() plt.axis import figure pyplot highlight_text pypalettes plt.subplots() xlabel ylabel title legend colorbar savefig tight_layout grid set_xlim set_ylim plot scatter hist boxplot imshow cmap alpha bins tick_params annotate quiver contour barh stackplot subplots_adjust axhline axvline semilogx semilogy loglog polar streamplot hexbin pcolor tricontour errorbar clabel set_aspect violinplot set_axis_off spines text hatch plt axis plt.bar() plt.axis import figure pyplot highlight_text pypalettes plt.subplots() xlabel ylabel title legend colorbar savefig tight_layout grid set_xlim set_ylim plot scatter hist boxplot imshow cmap alpha bins tick_params annotate quiver contour barh stackplot subplots_adjust axhline axvline semilogx semilogy loglog polar streamplot hexbin pcolor tricontour errorbar clabel set_aspect violinplot set_axis_off spines text hatch plt axis plt.bar() plt.axis import figure pyplot highlight_text pypalettes plt.subplots() xlabel ylabel title legend colorbar savefig tight_layout grid set_xlim set_ylim plot scatter hist boxplot imshow cmap alpha bins tick_params annotate quiver contour barh stackplot subplots_adjust axhline axvline semilogx semilogy loglog polar streamplot hexbin pcolor tricontour errorbar clabel set_aspect violinplot set_axis_off spines text hatch plt axis plt.bar() plt.axis import figure pyplot highlight_text pypalettes plt.subplots() xlabel ylabel title legend colorbar savefig tight_layout grid set_xlim set_ylim plot scatter hist boxplot imshow cmap alpha bins tick_params annotate quiver contour barh stackplot subplots_adjust axhline axvline semilogx semilogy loglog polar streamplot hexbin pcolor tricontour errorbar clabel set_aspect violinplot set_axis_off spines text hatch plt axis plt.bar() plt.axis import figure pyplot highlight_text pypalettes plt.subplots() xlabel ylabel title legend colorbar savefig tight_layout grid set_xlim set_ylim plot scatter hist boxplot imshow cmap alpha bins tick_params annotate quiver contour barh stackplot subplots_adjust axhline axvline semilogx semilogy loglog polar streamplot hexbin pcolor tricontour errorbar clabel set_aspect violinplot set_axis_off spines text hatch plt axis plt.bar() plt.axis import figure pyplot highlight_text pypalettes plt.subplots() xlabel ylabel title legend colorbar savefig tight_layout grid set_xlim set_ylim plot scatter hist boxplot imshow cmap alpha bins tick_params annotate quiver contour barh stackplot subplots_adjust axhline axvline semilogx semilogy loglog polar streamplot hexbin pcolor tricontour errorbar clabel set_aspect violinplot set_axis_off spines text hatch plt axis plt.bar() plt.axis import figure pyplot highlight_text pypalettes plt.subplots() xlabel ylabel title legend colorbar savefig tight_layout grid set_xlim set_ylim plot scatter hist boxplot imshow cmap alpha bins tick_params annotate quiver contour barh stackplot subplots_adjust axhline axvline semilogx semilogy loglog polar streamplot hexbin pcolor tricontour errorbar clabel set_aspect violinplot set_axis_off spines text hatch plt axis plt.bar() plt.axis import figure pyplot highlight_text pypalettes plt.subplots() xlabel ylabel title legend colorbar savefig tight_layout grid set_xlim set_ylim plot scatter hist boxplot imshow cmap alpha bins tick_params annotate quiver contour barh stackplot subplots_adjust axhline axvline semilogx semilogy loglog polar streamplot hexbin pcolor tricontour errorbar clabel set_aspect violinplot set_axis_off spines text hatch plt axis plt.bar() plt.axis import figure pyplot highlight_text pypalettes plt.subplots() xlabel ylabel title legend colorbar savefig tight_layout grid set_xlim set_ylim plot scatter hist boxplot imshow cmap alpha bins tick_params annotate quiver contour barh stackplot subplots_adjust axhline axvline semilogx semilogy loglog polar streamplot hexbin pcolor tricontour errorbar clabel set_aspect violinplot set_axis_off spines text hatch plt axis plt.bar() plt.axis import figure pyplot highlight_text pypalettes plt.subplots() xlabel ylabel title legend colorbar savefig tight_layout grid set_xlim set_ylim plot scatter hist boxplot imshow cmap alpha bins tick_params annotate quiver contour barh stackplot subplots_adjust axhline axvline semilogx semilogy loglog polar streamplot hexbin pcolor tricontour errorbar clabel set_aspect violinplot set_axis_off spines text hatch plt axis plt.bar() plt.axis import figure pyplot highlight_text pypalettes plt.subplots() xlabel ylabel title legend colorbar savefig tight_layout grid set_xlim set_ylim plot scatter hist boxplot imshow cmap alpha bins tick_params annotate quiver contour barh stackplot subplots_adjust axhline axvline semilogx semilogy loglog polar streamplot hexbin pcolor tricontour errorbar clabel set_aspect violinplot set_axis_off spines text hatch plt axis plt.bar() plt.axis import figure pyplot highlight_text pypalettes plt.subplots() xlabel ylabel title legend colorbar savefig tight_layout grid set_xlim set_ylim plot scatter hist boxplot imshow cmap alpha bins tick_params annotate quiver contour barh stackplot subplots_adjust axhline axvline semilogx semilogy loglog polar streamplot hexbin pcolor tricontour errorbar clabel set_aspect violinplot set_axis_off spines text hatch plt axis plt.bar() plt.axis import figure pyplot highlight_text pypalettes plt.subplots() xlabel ylabel title legend colorbar savefig tight_layout grid set_xlim set_ylim plot scatter hist boxplot imshow cmap alpha bins tick_params annotate quiver contour barh stackplot subplots_adjust axhline axvline semilogx semilogy loglog polar streamplot hexbin pcolor tricontour errorbar clabel set_aspect violinplot set_axis_off spines text hatch plt axis plt.bar() plt.axis import figure pyplot highlight_text pypalettes plt.subplots() xlabel ylabel title legend colorbar savefig tight_layout grid set_xlim set_ylim plot scatter hist boxplot imshow cmap alpha bins tick_params annotate quiver contour barh stackplot subplots_adjust axhline axvline semilogx semilogy loglog polar streamplot hexbin pcolor tricontour errorbar clabel set_aspect violinplot set_axis_off spines text hatch plt axis plt.bar() plt.axis import figure pyplot highlight_text pypalettes plt.subplots() xlabel ylabel title legend colorbar savefig tight_layout grid set_xlim set_ylim plot scatter hist boxplot imshow cmap alpha bins tick_params annotate quiver contour barh stackplot subplots_adjust axhline axvline semilogx semilogy loglog polar streamplot hexbin pcolor tricontour errorbar clabel set_aspect violinplot set_axis_off spines text hatch plt axis plt.bar() plt.axis import figure pyplot highlight_text pypalettes plt.subplots() xlabel ylabel title legend colorbar savefig tight_layout grid set_xlim set_ylim plot scatter hist boxplot imshow cmap alpha bins tick_params annotate quiver contour barh stackplot subplots_adjust axhline axvline semilogx semilogy loglog polar streamplot hexbin pcolor tricontour errorbar clabel set_aspect violinplot set_axis_off spines text hatch plt axis plt.bar() plt.axis import figure pyplot highlight_text pypalettes plt.subplots() xlabel ylabel title legend colorbar savefig tight_layout grid set_xlim set_ylim plot scatter hist boxplot imshow cmap alpha bins tick_params annotate quiver contour barh stackplot subplots_adjust axhline axvline semilogx semilogy loglog polar streamplot hexbin pcolor tricontour errorbar clabel set_aspect violinplot set_axis_off spines text hatch plt axis plt.bar() plt.axis import figure pyplot highlight_text pypalettes plt.subplots() xlabel ylabel title legend colorbar savefig tight_layout grid set_xlim set_ylim plot scatter hist boxplot imshow cmap alpha bins tick_params annotate quiver contour barh stackplot subplots_adjust axhline axvline semilogx semilogy loglog polar streamplot hexbin pcolor tricontour errorbar clabel set_aspect violinplot set_axis_off spines text hatch plt axis plt.bar() plt.axis import figure pyplot highlight_text pypalettes plt.subplots() xlabel ylabel title legend colorbar savefig tight_layout grid set_xlim set_ylim plot scatter hist boxplot imshow cmap alpha bins tick_params annotate quiver contour barh stackplot subplots_adjust axhline axvline semilogx semilogy loglog polar streamplot hexbin pcolor tricontour errorbar clabel set_aspect violinplot set_axis_off spines text hatch plt axis plt.bar() plt.axis import figure pyplot highlight_text pypalettes plt.subplots() xlabel ylabel title legend colorbar savefig tight_layout grid set_xlim set_ylim plot scatter hist boxplot imshow cmap alpha bins tick_params annotate quiver contour barh stackplot subplots_adjust axhline axvline semilogx semilogy loglog polar streamplot hexbin pcolor tricontour errorbar clabel set_aspect violinplot set_axis_off spines text hatch plt axis plt.bar() plt.axis import figure pyplot highlight_text pypalettes plt.subplots() xlabel ylabel title legend colorbar savefig tight_layout grid set_xlim set_ylim plot scatter hist boxplot imshow cmap alpha bins tick_params annotate quiver contour barh stackplot subplots_adjust axhline axvline semilogx semilogy loglog polar streamplot hexbin pcolor tricontour errorbar clabel set_aspect violinplot set_axis_off spines text hatch plt axis plt.bar() plt.axis import figure pyplot highlight_text pypalettes plt.subplots() xlabel ylabel title legend colorbar savefig tight_layout grid set_xlim set_ylim plot scatter hist boxplot imshow cmap alpha bins tick_params annotate quiver contour barh stackplot subplots_adjust axhline axvline semilogx semilogy loglog polar streamplot hexbin pcolor tricontour errorbar clabel set_aspect violinplot set_axis_off spines text hatch plt axis plt.bar() plt.axis import figure pyplot highlight_text pypalettes plt.subplots() xlabel ylabel title legend colorbar savefig tight_layout grid set_xlim set_ylim plot scatter hist boxplot imshow cmap alpha bins tick_params annotate quiver contour barh stackplot subplots_adjust axhline axvline semilogx semilogy loglog polar streamplot hexbin pcolor tricontour errorbar clabel set_aspect violinplot set_axis_off spines text hatch plt axis plt.bar() plt.axis import figure pyplot highlight_text pypalettes plt.subplots() xlabel ylabel title legend colorbar savefig tight_layout grid set_xlim set_ylim plot scatter hist boxplot imshow cmap alpha bins tick_params annotate quiver contour barh stackplot subplots_adjust axhline axvline semilogx semilogy loglog polar streamplot hexbin pcolor tricontour errorbar clabel set_aspect violinplot set_axis_off spines text hatch plt axis plt.bar() plt.axis import figure pyplot highlight_text pypalettes plt.subplots() xlabel ylabel title legend colorbar savefig tight_layout grid set_xlim set_ylim plot scatter hist boxplot imshow cmap alpha bins tick_params annotate quiver contour barh stackplot subplots_adjust axhline axvline semilogx semilogy loglog polar streamplot hexbin pcolor tricontour errorbar clabel set_aspect violinplot set_axis_off spines text hatch plt axis plt.bar() plt.axis import figure pyplot highlight_text pypalettes plt.subplots() xlabel ylabel title legend colorbar savefig tight_layout grid set_xlim set_ylim plot scatter hist boxplot imshow cmap alpha bins tick_params annotate quiver contour barh stackplot subplots_adjust axhline axvline semilogx semilogy loglog polar streamplot hexbin pcolor tricontour errorbar clabel set_aspect violinplot set_axis_off spines text hatch plt axis plt.bar() plt.axis import figure pyplot highlight_text pypalettes plt.subplots() xlabel ylabel title legend colorbar savefig tight_layout grid set_xlim set_ylim plot scatter hist boxplot imshow cmap alpha bins tick_params annotate quiver contour barh stackplot subplots_adjust axhline axvline semilogx semilogy loglog polar streamplot hexbin pcolor tricontour errorbar clabel set_aspect violinplot set_axis_off spines text hatch plt axis plt.bar() plt.axis import figure pyplot highlight_text pypalettes plt.subplots() xlabel ylabel title legend colorbar savefig tight_layout grid set_xlim set_ylim plot scatter hist boxplot imshow cmap alpha bins tick_params annotate quiver contour barh stackplot subplots_adjust axhline axvline semilogx semilogy loglog polar streamplot hexbin pcolor tricontour errorbar clabel set_aspect violinplot set_axis_off spines text hatch plt axis plt.bar() plt.axis import figure pyplot highlight_text pypalettes plt.subplots() xlabel ylabel title legend colorbar savefig tight_layout grid set_xlim set_ylim plot scatter hist boxplot imshow cmap alpha bins tick_params annotate quiver contour barh stackplot subplots_adjust axhline axvline semilogx semilogy loglog polar streamplot hexbin pcolor tricontour errorbar clabel set_aspect violinplot set_axis_off spines text hatch plt axis plt.bar() plt.axis import figure pyplot highlight_text pypalettes plt.subplots() xlabel ylabel title legend colorbar savefig tight_layout grid set_xlim set_ylim plot scatter hist boxplot imshow cmap alpha bins tick_params annotate quiver contour barh stackplot subplots_adjust axhline axvline semilogx semilogy loglog polar streamplot hexbin pcolor tricontour errorbar clabel set_aspect violinplot set_axis_off spines text hatch plt axis plt.bar() plt.axis import figure pyplot highlight_text pypalettes plt.subplots() xlabel ylabel title legend colorbar savefig tight_layout grid set_xlim set_ylim plot scatter hist boxplot imshow cmap alpha bins tick_params annotate quiver contour barh stackplot subplots_adjust axhline axvline semilogx semilogy loglog polar streamplot hexbin pcolor tricontour errorbar clabel set_aspect violinplot set_axis_off spines text hatch plt axis plt.bar() plt.axis import figure pyplot highlight_text pypalettes plt.subplots() xlabel ylabel title legend colorbar savefig tight_layout grid set_xlim set_ylim plot scatter hist boxplot imshow cmap alpha bins tick_params annotate quiver contour barh stackplot subplots_adjust axhline axvline semilogx semilogy loglog polar streamplot hexbin pcolor tricontour errorbar clabel set_aspect violinplot set_axis_off spines text hatch plt axis plt.bar() plt.axis import figure pyplot highlight_text pypalettes plt.subplots() xlabel ylabel title legend colorbar savefig tight_layout grid set_xlim set_ylim plot scatter hist boxplot imshow cmap alpha bins tick_params annotate quiver contour barh stackplot subplots_adjust axhline axvline semilogx semilogy loglog polar streamplot hexbin pcolor tricontour errorbar clabel set_aspect violinplot set_axis_off spines text hatch plt axis plt.bar() plt.axis import figure pyplot highlight_text pypalettes plt.subplots() xlabel ylabel title legend colorbar savefig tight_layout grid set_xlim set_ylim plot scatter hist boxplot imshow cmap alpha bins tick_params annotate quiver contour barh stackplot subplots_adjust axhline axvline semilogx semilogy loglog polar streamplot hexbin pcolor tricontour errorbar clabel set_aspect violinplot set_axis_off spines text hatch plt axis plt.bar() plt.axis import figure pyplot highlight_text pypalettes plt.subplots() xlabel ylabel title legend colorbar savefig tight_layout grid set_xlim set_ylim plot scatter hist boxplot imshow cmap alpha bins tick_params annotate quiver contour barh stackplot subplots_adjust axhline axvline semilogx semilogy loglog polar streamplot hexbin pcolor tricontour errorbar clabel set_aspect violinplot set_axis_off spines text hatch plt axis plt.bar() plt.axis import figure pyplot highlight_text pypalettes plt.subplots() xlabel ylabel title legend colorbar savefig tight_layout grid set_xlim set_ylim plot scatter hist boxplot imshow cmap alpha bins tick_params annotate quiver contour barh stackplot subplots_adjust axhline axvline semilogx semilogy loglog polar streamplot hexbin pcolor tricontour errorbar clabel set_aspect violinplot set_axis_off spines text hatch plt axis plt.bar() plt.axis import figure pyplot highlight_text pypalettes plt.subplots() xlabel ylabel title legend colorbar savefig tight_layout grid set_xlim set_ylim plot scatter hist boxplot imshow cmap alpha bins tick_params annotate quiver contour barh stackplot subplots_adjust axhline axvline semilogx semilogy loglog polar streamplot hexbin pcolor tricontour errorbar clabel set_aspect violinplot set_axis_off spines text hatch plt axis plt.bar() plt.axis import figure pyplot highlight_text pypalettes plt.subplots() xlabel ylabel title legend colorbar savefig tight_layout grid set_xlim set_ylim plot scatter hist boxplot imshow cmap alpha bins tick_params annotate quiver contour barh stackplot subplots_adjust axhline axvline semilogx semilogy loglog polar streamplot hexbin pcolor tricontour errorbar clabel set_aspect violinplot set_axis_off spines text hatch plt axis plt.bar() plt.axis import figure pyplot highlight_text pypalettes plt.subplots() xlabel ylabel title legend colorbar savefig tight_layout grid set_xlim set_ylim plot scatter hist boxplot imshow cmap alpha bins tick_params annotate quiver contour barh stackplot subplots_adjust axhline axvline semilogx semilogy loglog polar streamplot hexbin pcolor tricontour errorbar clabel set_aspect violinplot set_axis_off spines text hatch plt axis plt.bar() plt.axis import figure pyplot highlight_text pypalettes plt.subplots() xlabel ylabel title legend colorbar savefig tight_layout grid set_xlim set_ylim plot scatter hist boxplot imshow cmap alpha bins tick_params annotate quiver contour barh stackplot subplots_adjust axhline axvline semilogx semilogy loglog polar streamplot hexbin pcolor tricontour errorbar clabel set_aspect violinplot set_axis_off spines text hatch plt axis plt.bar() plt.axis import figure pyplot highlight_text pypalettes plt.subplots() xlabel ylabel title legend colorbar savefig tight_layout grid set_xlim set_ylim plot scatter hist boxplot imshow cmap alpha bins tick_params annotate quiver contour barh stackplot subplots_adjust axhline axvline semilogx semilogy loglog polar streamplot hexbin pcolor tricontour errorbar clabel set_aspect violinplot set_axis_off spines text hatch plt axis plt.bar() plt.axis import figure pyplot highlight_text pypalettes plt.subplots() xlabel ylabel title legend colorbar savefig tight_layout grid set_xlim set_ylim plot scatter hist boxplot imshow cmap alpha bins tick_params annotate quiver contour barh stackplot subplots_adjust axhline axvline semilogx semilogy loglog polar streamplot hexbin pcolor tricontour errorbar clabel set_aspect violinplot set_axis_off spines text hatch plt axis plt.bar() plt.axis import figure pyplot highlight_text pypalettes plt.subplots() xlabel ylabel title legend colorbar savefig tight_layout grid set_xlim set_ylim plot scatter hist boxplot imshow cmap alpha bins tick_params annotate quiver contour barh stackplot subplots_adjust axhline axvline semilogx semilogy loglog polar streamplot hexbin pcolor tricontour errorbar clabel set_aspect violinplot set_axis_off spines text hatch plt axis plt.bar() plt.axis import figure pyplot highlight_text pypalettes plt.subplots() xlabel ylabel title legend colorbar savefig tight_layout grid set_xlim set_ylim plot scatter hist boxplot imshow cmap alpha bins tick_params annotate quiver contour barh stackplot subplots_adjust axhline axvline semilogx semilogy loglog polar streamplot hexbin pcolor tricontour errorbar clabel set_aspect violinplot set_axis_off spines text hatch plt axis plt.bar() plt.axis import figure pyplot highlight_text pypalettes plt.subplots() xlabel ylabel title legend colorbar savefig tight_layout grid set_xlim set_ylim plot scatter hist boxplot imshow cmap alpha bins tick_params annotate quiver contour barh stackplot subplots_adjust axhline axvline semilogx semilogy loglog polar streamplot hexbin pcolor tricontour errorbar clabel set_aspect violinplot set_axis_off spines text hatch plt axis plt.bar() plt.axis import figure pyplot highlight_text pypalettes plt.subplots() xlabel ylabel title legend colorbar savefig tight_layout grid set_xlim set_ylim plot scatter hist boxplot imshow cmap alpha bins tick_params annotate quiver contour barh stackplot subplots_adjust axhline axvline semilogx semilogy loglog polar streamplot hexbin pcolor tricontour errorbar clabel set_aspect violinplot set_axis_off spines text hatch plt axis plt.bar() plt.axis import figure pyplot highlight_text pypalettes plt.subplots() xlabel ylabel title legend colorbar savefig tight_layout grid set_xlim set_ylim plot scatter hist boxplot imshow cmap alpha bins tick_params annotate quiver contour barh stackplot subplots_adjust axhline axvline semilogx semilogy loglog polar streamplot hexbin pcolor tricontour errorbar clabel set_aspect violinplot set_axis_off spines text hatch plt axis plt.bar() plt.axis import figure pyplot highlight_text pypalettes plt.subplots() xlabel ylabel title legend colorbar savefig tight_layout grid set_xlim set_ylim plot scatter hist boxplot imshow cmap alpha bins tick_params annotate quiver contour barh stackplot subplots_adjust axhline axvline semilogx semilogy loglog polar streamplot hexbin pcolor tricontour errorbar clabel set_aspect violinplot set_axis_off spines text hatch plt axis plt.bar() plt.axis import figure pyplot highlight_text pypalettes plt.subplots() xlabel ylabel title legend colorbar savefig tight_layout grid set_xlim set_ylim plot scatter hist boxplot imshow cmap alpha bins tick_params annotate quiver contour barh stackplot subplots_adjust axhline axvline semilogx semilogy loglog polar streamplot hexbin pcolor tricontour errorbar clabel set_aspect violinplot set_axis_off spines text hatch plt axis plt.bar() plt.axis import figure pyplot highlight_text pypalettes plt.subplots() xlabel ylabel title legend colorbar savefig tight_layout grid set_xlim set_ylim plot scatter hist boxplot imshow cmap alpha bins tick_params annotate quiver contour barh stackplot subplots_adjust axhline axvline semilogx semilogy loglog polar streamplot hexbin pcolor tricontour errorbar clabel set_aspect violinplot set_axis_off spines text hatch plt axis plt.bar() plt.axis import figure pyplot highlight_text pypalettes plt.subplots() xlabel ylabel title legend colorbar savefig tight_layout grid set_xlim set_ylim plot scatter hist boxplot imshow cmap alpha bins tick_params annotate quiver contour barh stackplot subplots_adjust axhline axvline semilogx semilogy loglog polar streamplot hexbin pcolor tricontour errorbar clabel set_aspect violinplot set_axis_off spines text hatch plt axis plt.bar() plt.axis import figure pyplot highlight_text pypalettes plt.subplots() xlabel ylabel title legend colorbar savefig tight_layout grid set_xlim set_ylim plot scatter hist boxplot imshow cmap alpha bins tick_params annotate quiver contour barh stackplot subplots_adjust axhline axvline semilogx semilogy loglog polar streamplot hexbin pcolor tricontour errorbar clabel set_aspect violinplot set_axis_off spines text hatch plt axis plt.bar() plt.axis import figure pyplot highlight_text pypalettes plt.subplots() xlabel ylabel title legend colorbar savefig tight_layout grid set_xlim set_ylim plot scatter hist boxplot imshow cmap alpha bins tick_params annotate quiver contour barh stackplot subplots_adjust axhline axvline semilogx semilogy loglog polar streamplot hexbin pcolor tricontour errorbar clabel set_aspect violinplot set_axis_off spines text hatch plt axis plt.bar() plt.axis import figure pyplot highlight_text pypalettes plt.subplots() xlabel ylabel title legend colorbar savefig tight_layout grid set_xlim set_ylim plot scatter hist boxplot imshow cmap alpha bins tick_params annotate quiver contour barh stackplot subplots_adjust axhline axvline semilogx semilogy loglog polar streamplot hexbin pcolor tricontour errorbar clabel set_aspect violinplot set_axis_off spines text hatch plt axis plt.bar() plt.axis import figure pyplot highlight_text pypalettes plt.subplots() xlabel ylabel title legend colorbar savefig tight_layout grid set_xlim set_ylim plot scatter hist boxplot imshow cmap alpha bins tick_params annotate quiver contour barh stackplot subplots_adjust axhline axvline semilogx semilogy loglog polar streamplot hexbin pcolor tricontour errorbar clabel set_aspect violinplot set_axis_off spines text hatch plt axis plt.bar() plt.axis import figure pyplot highlight_text pypalettes plt.subplots() xlabel ylabel title legend colorbar savefig tight_layout grid set_xlim set_ylim plot scatter hist boxplot imshow cmap alpha bins tick_params annotate quiver contour barh stackplot subplots_adjust axhline axvline semilogx semilogy loglog polar streamplot hexbin pcolor tricontour errorbar clabel set_aspect violinplot set_axis_off spines text hatch plt axis plt.bar() plt.axis import figure pyplot highlight_text pypalettes plt.subplots() xlabel ylabel title legend colorbar savefig tight_layout grid set_xlim set_ylim plot scatter hist boxplot imshow cmap alpha bins tick_params annotate quiver contour barh stackplot subplots_adjust axhline axvline semilogx semilogy loglog polar streamplot hexbin pcolor tricontour errorbar clabel set_aspect violinplot set_axis_off spines text hatch plt axis plt.bar() plt.axis import figure pyplot highlight_text pypalettes plt.subplots() xlabel ylabel title legend colorbar savefig tight_layout grid set_xlim set_ylim plot scatter hist boxplot imshow cmap alpha bins tick_params annotate quiver contour barh stackplot subplots_adjust axhline axvline semilogx semilogy loglog polar streamplot hexbin pcolor tricontour errorbar clabel set_aspect violinplot set_axis_off spines text hatch plt axis plt.bar() plt.axis import figure pyplot highlight_text pypalettes plt.subplots() xlabel ylabel title legend colorbar savefig tight_layout grid set_xlim set_ylim plot scatter hist boxplot imshow cmap alpha bins tick_params annotate quiver contour barh stackplot subplots_adjust axhline axvline semilogx semilogy loglog polar streamplot hexbin pcolor tricontour errorbar clabel set_aspect violinplot set_axis_off spines text hatch plt axis plt.bar() plt.axis import figure pyplot highlight_text pypalettes plt.subplots() xlabel ylabel title legend colorbar savefig tight_layout grid set_xlim set_ylim plot scatter hist boxplot imshow cmap alpha bins tick_params annotate quiver contour barh stackplot subplots_adjust axhline axvline semilogx semilogy loglog polar streamplot hexbin pcolor tricontour errorbar clabel set_aspect violinplot set_axis_off spines text hatch plt axis plt.bar() plt.axis import figure pyplot highlight_text pypalettes plt.subplots() xlabel ylabel title legend colorbar savefig tight_layout grid set_xlim set_ylim plot scatter hist boxplot imshow cmap alpha bins tick_params annotate quiver contour barh stackplot subplots_adjust axhline axvline semilogx semilogy loglog polar streamplot hexbin pcolor tricontour errorbar clabel set_aspect violinplot set_axis_off spines text hatch plt axis plt.bar() plt.axis import figure pyplot highlight_text pypalettes plt.subplots() xlabel ylabel title legend colorbar savefig tight_layout grid set_xlim set_ylim plot scatter hist boxplot imshow cmap alpha bins tick_params annotate quiver contour barh stackplot subplots_adjust axhline axvline semilogx semilogy loglog polar streamplot hexbin pcolor tricontour errorbar clabel set_aspect violinplot set_axis_off spines text hatch plt axis plt.bar() plt.axis import figure pyplot highlight_text pypalettes plt.subplots() xlabel ylabel title legend colorbar savefig tight_layout grid set_xlim set_ylim plot scatter hist boxplot imshow cmap alpha bins tick_params annotate quiver contour barh stackplot subplots_adjust axhline axvline semilogx semilogy loglog polar streamplot hexbin pcolor tricontour errorbar clabel set_aspect violinplot set_axis_off spines text hatch plt axis plt.bar() plt.axis import figure pyplot highlight_text pypalettes plt.subplots() xlabel ylabel title legend colorbar savefig tight_layout grid set_xlim set_ylim plot scatter hist boxplot imshow cmap alpha bins tick_params annotate quiver contour barh stackplot subplots_adjust axhline axvline semilogx semilogy loglog polar streamplot hexbin pcolor tricontour errorbar clabel set_aspect violinplot set_axis_off spines text hatch plt axis plt.bar() plt.axis import figure pyplot highlight_text pypalettes plt.subplots() xlabel ylabel title legend colorbar savefig tight_layout grid set_xlim set_ylim plot scatter hist boxplot imshow cmap alpha bins tick_params annotate quiver contour barh stackplot subplots_adjust axhline axvline semilogx semilogy loglog polar streamplot hexbin pcolor tricontour errorbar clabel set_aspect violinplot set_axis_off spines text hatch plt axis plt.bar() plt.axis import figure pyplot highlight_text pypalettes plt.subplots() xlabel ylabel title legend colorbar savefig tight_layout grid set_xlim set_ylim plot scatter hist boxplot imshow cmap alpha bins tick_params annotate quiver contour barh stackplot subplots_adjust axhline axvline semilogx semilogy loglog polar streamplot hexbin pcolor tricontour errorbar clabel set_aspect violinplot set_axis_off spines text hatch plt axis plt.bar() plt.axis import figure pyplot highlight_text pypalettes plt.subplots() xlabel ylabel title legend colorbar savefig tight_layout grid set_xlim set_ylim plot scatter hist boxplot imshow cmap alpha bins tick_params annotate quiver contour barh stackplot subplots_adjust axhline axvline semilogx semilogy loglog polar streamplot hexbin pcolor tricontour errorbar clabel set_aspect violinplot set_axis_off spines text hatch plt axis plt.bar() plt.axis import figure pyplot highlight_text pypalettes plt.subplots() xlabel ylabel title legend colorbar savefig tight_layout grid set_xlim set_ylim plot scatter hist boxplot imshow cmap alpha bins tick_params annotate quiver contour barh stackplot subplots_adjust axhline axvline semilogx semilogy loglog polar streamplot hexbin pcolor tricontour errorbar clabel set_aspect violinplot set_axis_off spines text hatch plt axis plt.bar() plt.axis import figure pyplot highlight_text pypalettes plt.subplots() xlabel ylabel title legend colorbar savefig tight_layout grid set_xlim set_ylim plot scatter hist boxplot imshow cmap alpha bins tick_params annotate quiver contour barh stackplot subplots_adjust axhline axvline semilogx semilogy loglog polar streamplot hexbin pcolor tricontour errorbar clabel set_aspect violinplot set_axis_off spines text hatch plt axis plt.bar() plt.axis import figure pyplot highlight_text pypalettes plt.subplots() xlabel ylabel title legend colorbar savefig tight_layout grid set_xlim set_ylim plot scatter hist boxplot imshow cmap alpha bins tick_params annotate quiver contour barh stackplot subplots_adjust axhline axvline semilogx semilogy loglog polar streamplot hexbin pcolor tricontour errorbar clabel set_aspect violinplot set_axis_off spines text hatch plt axis plt.bar() plt.axis import figure pyplot highlight_text pypalettes plt.subplots() xlabel ylabel title legend colorbar savefig tight_layout grid set_xlim set_ylim plot scatter hist boxplot imshow cmap alpha bins tick_params annotate quiver contour barh stackplot subplots_adjust axhline axvline semilogx semilogy loglog polar streamplot hexbin pcolor tricontour errorbar clabel set_aspect violinplot set_axis_off spines text hatch plt axis plt.bar() plt.axis import figure pyplot highlight_text pypalettes plt.subplots() xlabel ylabel title legend colorbar savefig tight_layout grid set_xlim set_ylim plot scatter hist boxplot imshow cmap alpha bins tick_params annotate quiver contour barh stackplot subplots_adjust axhline axvline semilogx semilogy loglog polar streamplot hexbin pcolor tricontour errorbar clabel set_aspect violinplot set_axis_off spines text hatch plt axis plt.bar() plt.axis import figure pyplot highlight_text pypalettes plt.subplots() xlabel ylabel title legend colorbar savefig tight_layout grid set_xlim set_ylim plot scatter hist boxplot imshow cmap alpha bins tick_params annotate quiver contour barh stackplot subplots_adjust axhline axvline semilogx semilogy loglog polar streamplot hexbin pcolor tricontour errorbar clabel set_aspect violinplot set_axis_off spines text hatch plt axis plt.bar() plt.axis import figure pyplot highlight_text pypalettes plt.subplots() xlabel ylabel title legend colorbar savefig tight_layout grid set_xlim set_ylim plot scatter hist boxplot imshow cmap alpha bins tick_params annotate quiver contour barh stackplot subplots_adjust axhline axvline semilogx semilogy loglog polar streamplot hexbin pcolor tricontour errorbar clabel set_aspect violinplot set_axis_off spines text hatch plt axis plt.bar() plt.axis import figure pyplot highlight_text pypalettes plt.subplots() xlabel ylabel title legend colorbar savefig tight_layout grid set_xlim set_ylim plot scatter hist boxplot imshow cmap alpha bins tick_params annotate quiver contour barh stackplot subplots_adjust axhline axvline semilogx semilogy loglog polar streamplot hexbin pcolor tricontour errorbar clabel set_aspect violinplot set_axis_off spines text hatch plt axis plt.bar() plt.axis import figure pyplot highlight_text pypalettes plt.subplots() xlabel ylabel title legend colorbar savefig tight_layout grid set_xlim set_ylim plot scatter hist boxplot imshow cmap alpha bins tick_params annotate quiver contour barh stackplot subplots_adjust axhline axvline semilogx semilogy loglog polar streamplot hexbin pcolor tricontour errorbar clabel set_aspect violinplot set_axis_off spines text hatch plt axis plt.bar() plt.axis import figure pyplot highlight_text pypalettes plt.subplots() xlabel ylabel title legend colorbar savefig tight_layout grid set_xlim set_ylim plot scatter hist boxplot imshow cmap alpha bins tick_params annotate quiver contour barh stackplot subplots_adjust axhline axvline semilogx semilogy loglog polar streamplot hexbin pcolor tricontour errorbar clabel set_aspect violinplot set_axis_off spines text hatch plt axis plt.bar() plt.axis import figure pyplot highlight_text pypalettes plt.subplots() xlabel ylabel title legend colorbar savefig tight_layout grid set_xlim set_ylim plot scatter hist boxplot imshow cmap alpha bins tick_params annotate quiver contour barh stackplot subplots_adjust axhline axvline semilogx semilogy loglog polar streamplot hexbin pcolor tricontour errorbar clabel set_aspect violinplot set_axis_off spines text hatch plt axis plt.bar() plt.axis import figure pyplot highlight_text pypalettes plt.subplots() xlabel ylabel title legend colorbar savefig tight_layout grid set_xlim set_ylim plot scatter hist boxplot imshow cmap alpha bins tick_params annotate quiver contour barh stackplot subplots_adjust axhline axvline semilogx semilogy loglog polar streamplot hexbin pcolor tricontour errorbar clabel set_aspect violinplot set_axis_off spines text hatch plt axis plt.bar() plt.axis import figure pyplot highlight_text pypalettes plt.subplots() xlabel ylabel title legend colorbar savefig tight_layout grid set_xlim set_ylim plot scatter hist boxplot imshow cmap alpha bins tick_params annotate quiver contour barh stackplot subplots_adjust axhline axvline semilogx semilogy loglog polar streamplot hexbin pcolor tricontour errorbar clabel set_aspect violinplot set_axis_off spines text hatch plt axis plt.bar() plt.axis import figure pyplot highlight_text pypalettes plt.subplots() xlabel ylabel title legend colorbar savefig tight_layout grid set_xlim set_ylim plot scatter hist boxplot imshow cmap alpha bins tick_params annotate quiver contour barh stackplot subplots_adjust axhline axvline semilogx semilogy loglog polar streamplot hexbin pcolor tricontour errorbar clabel set_aspect violinplot set_axis_off spines text hatch plt axis plt.bar() plt.axis import figure pyplot highlight_text pypalettes plt.subplots() xlabel ylabel title legend colorbar savefig tight_layout grid set_xlim set_ylim plot scatter hist boxplot imshow cmap alpha bins tick_params annotate quiver contour barh stackplot subplots_adjust axhline axvline semilogx semilogy loglog polar streamplot hexbin pcolor tricontour errorbar clabel set_aspect violinplot set_axis_off spines text hatch plt axis plt.bar() plt.axis import figure pyplot highlight_text pypalettes plt.subplots() xlabel ylabel title legend colorbar savefig tight_layout grid set_xlim set_ylim plot scatter hist boxplot imshow cmap alpha bins tick_params annotate quiver contour barh stackplot subplots_adjust axhline axvline semilogx semilogy loglog polar streamplot hexbin pcolor tricontour errorbar clabel set_aspect violinplot set_axis_off spines text hatch plt axis plt.bar() plt.axis import figure pyplot highlight_text pypalettes plt.subplots() xlabel ylabel title legend colorbar savefig tight_layout grid set_xlim set_ylim plot scatter hist boxplot imshow cmap alpha bins tick_params annotate quiver contour barh stackplot subplots_adjust axhline axvline semilogx semilogy loglog polar streamplot hexbin pcolor tricontour errorbar clabel set_aspect violinplot set_axis_off spines text hatch plt axis plt.bar() plt.axis import figure pyplot highlight_text pypalettes plt.subplots() xlabel ylabel title legend colorbar savefig tight_layout grid set_xlim set_ylim plot scatter hist boxplot imshow cmap alpha bins tick_params annotate quiver contour barh stackplot subplots_adjust axhline axvline semilogx semilogy loglog polar streamplot hexbin pcolor tricontour errorbar clabel set_aspect violinplot set_axis_off spines text hatch plt axis plt.bar() plt.axis import figure pyplot highlight_text pypalettes plt.subplots() xlabel ylabel title legend colorbar savefig tight_layout grid set_xlim set_ylim plot scatter hist boxplot imshow cmap alpha bins tick_params annotate quiver contour barh stackplot subplots_adjust axhline axvline semilogx semilogy loglog polar streamplot hexbin pcolor tricontour errorbar clabel set_aspect violinplot set_axis_off spines text hatch plt axis plt.bar() plt.axis import figure pyplot highlight_text pypalettes plt.subplots() xlabel ylabel title legend colorbar savefig tight_layout grid set_xlim set_ylim plot scatter hist boxplot imshow cmap alpha bins tick_params annotate quiver contour barh stackplot subplots_adjust axhline axvline semilogx semilogy loglog polar streamplot hexbin pcolor tricontour errorbar clabel set_aspect violinplot set_axis_off spines text hatch plt axis plt.bar() plt.axis import figure pyplot highlight_text pypalettes plt.subplots() xlabel ylabel title legend colorbar savefig tight_layout grid set_xlim set_ylim plot scatter hist boxplot imshow cmap alpha bins tick_params annotate quiver contour barh stackplot subplots_adjust axhline axvline semilogx semilogy loglog polar streamplot hexbin pcolor tricontour errorbar clabel set_aspect violinplot set_axis_off spines text hatch plt axis plt.bar() plt.axis import figure pyplot highlight_text pypalettes plt.subplots() xlabel ylabel title legend colorbar savefig tight_layout grid set_xlim set_ylim plot scatter hist boxplot imshow cmap alpha bins tick_params annotate quiver contour barh stackplot subplots_adjust axhline axvline semilogx semilogy loglog polar streamplot hexbin pcolor tricontour errorbar clabel set_aspect violinplot set_axis_off spines text hatch plt axis plt.bar() plt.axis import figure pyplot highlight_text pypalettes plt.subplots() xlabel ylabel title legend colorbar savefig tight_layout grid set_xlim set_ylim plot scatter hist boxplot imshow cmap alpha bins tick_params annotate quiver contour barh stackplot subplots_adjust axhline axvline semilogx semilogy loglog polar streamplot hexbin pcolor tricontour errorbar clabel set_aspect violinplot set_axis_off spines text hatch plt axis plt.bar() plt.axis import figure pyplot highlight_text pypalettes plt.subplots() xlabel ylabel title legend colorbar savefig tight_layout grid set_xlim set_ylim plot scatter hist boxplot imshow cmap alpha bins tick_params annotate quiver contour barh stackplot subplots_adjust axhline axvline semilogx semilogy loglog polar streamplot hexbin pcolor tricontour errorbar clabel set_aspect violinplot set_axis_off spines text hatch plt axis plt.bar() plt.axis import figure pyplot highlight_text pypalettes plt.subplots() xlabel ylabel title legend colorbar savefig tight_layout grid set_xlim set_ylim plot scatter hist boxplot imshow cmap alpha bins tick_params annotate quiver contour barh stackplot subplots_adjust axhline axvline semilogx semilogy loglog polar streamplot hexbin pcolor tricontour errorbar clabel set_aspect violinplot set_axis_off spines text hatch plt axis plt.bar() plt.axis import figure pyplot highlight_text pypalettes plt.subplots() xlabel ylabel title legend colorbar savefig tight_layout grid set_xlim set_ylim plot scatter hist boxplot imshow cmap alpha bins tick_params annotate quiver contour barh stackplot subplots_adjust axhline axvline semilogx semilogy loglog polar streamplot hexbin pcolor tricontour errorbar clabel set_aspect violinplot set_axis_off spines text hatch plt axis plt.bar() plt.axis import figure pyplot highlight_text pypalettes plt.subplots() xlabel ylabel title legend colorbar savefig tight_layout grid set_xlim set_ylim plot scatter hist boxplot imshow cmap alpha bins tick_params annotate quiver contour barh stackplot subplots_adjust axhline axvline semilogx semilogy loglog polar streamplot hexbin pcolor tricontour errorbar clabel set_aspect violinplot set_axis_off spines text hatch plt axis plt.bar() plt.axis import figure pyplot highlight_text pypalettes plt.subplots() xlabel ylabel title legend colorbar savefig tight_layout grid set_xlim set_ylim plot scatter hist boxplot imshow cmap alpha bins tick_params annotate quiver contour barh stackplot subplots_adjust axhline axvline semilogx semilogy loglog polar streamplot hexbin pcolor tricontour errorbar clabel set_aspect violinplot set_axis_off spines text hatch plt axis plt.bar() plt.axis import figure pyplot highlight_text pypalettes plt.subplots() xlabel ylabel title legend colorbar savefig tight_layout grid set_xlim set_ylim plot scatter hist boxplot imshow cmap alpha bins tick_params annotate quiver contour barh stackplot subplots_adjust axhline axvline semilogx semilogy loglog polar streamplot hexbin pcolor tricontour errorbar clabel set_aspect violinplot set_axis_off spines text hatch plt axis plt.bar() plt.axis import figure pyplot highlight_text pypalettes plt.subplots() xlabel ylabel title legend colorbar savefig tight_layout grid set_xlim set_ylim plot scatter hist boxplot imshow cmap alpha bins tick_params annotate quiver contour barh stackplot subplots_adjust axhline axvline semilogx semilogy loglog polar streamplot hexbin pcolor tricontour errorbar clabel set_aspect violinplot set_axis_off spines text hatch plt axis plt.bar() plt.axis import figure pyplot highlight_text pypalettes plt.subplots() xlabel ylabel title legend colorbar savefig tight_layout grid set_xlim set_ylim plot scatter hist boxplot imshow cmap alpha bins tick_params annotate quiver contour barh stackplot subplots_adjust axhline axvline semilogx semilogy loglog polar streamplot hexbin pcolor tricontour errorbar clabel set_aspect violinplot set_axis_off spines text hatch plt axis plt.bar() plt.axis import figure pyplot highlight_text pypalettes plt.subplots() xlabel ylabel title legend colorbar savefig tight_layout grid set_xlim set_ylim plot scatter hist boxplot imshow cmap alpha bins tick_params annotate quiver contour barh stackplot subplots_adjust axhline axvline semilogx semilogy loglog polar streamplot hexbin pcolor tricontour errorbar clabel set_aspect violinplot set_axis_off spines text hatch plt axis plt.bar() plt.axis import figure pyplot highlight_text pypalettes plt.subplots() xlabel ylabel title legend colorbar savefig tight_layout grid set_xlim set_ylim plot scatter hist boxplot imshow cmap alpha bins tick_params annotate quiver contour barh stackplot subplots_adjust axhline axvline semilogx semilogy loglog polar streamplot hexbin pcolor tricontour errorbar clabel set_aspect violinplot set_axis_off spines text hatch plt axis plt.bar() plt.axis import figure pyplot highlight_text pypalettes plt.subplots() xlabel ylabel title legend colorbar savefig tight_layout grid set_xlim set_ylim plot scatter hist boxplot imshow cmap alpha bins tick_params annotate quiver contour barh stackplot subplots_adjust axhline axvline semilogx semilogy loglog polar streamplot hexbin pcolor tricontour errorbar clabel set_aspect violinplot set_axis_off spines text hatch plt axis plt.bar() plt.axis import figure pyplot highlight_text pypalettes plt.subplots() xlabel ylabel title legend colorbar savefig tight_layout grid set_xlim set_ylim plot scatter hist boxplot imshow cmap alpha bins tick_params annotate quiver contour barh stackplot subplots_adjust axhline axvline semilogx semilogy loglog polar streamplot hexbin pcolor tricontour errorbar clabel set_aspect violinplot set_axis_off spines text hatch plt axis plt.bar() plt.axis import figure pyplot highlight_text pypalettes plt.subplots() xlabel ylabel title legend colorbar savefig tight_layout grid set_xlim set_ylim plot scatter hist boxplot imshow cmap alpha bins tick_params annotate quiver contour barh stackplot subplots_adjust axhline axvline semilogx semilogy loglog polar streamplot hexbin pcolor tricontour errorbar clabel set_aspect violinplot set_axis_off spines text hatch plt axis plt.bar() plt.axis import figure pyplot highlight_text pypalettes plt.subplots() xlabel ylabel title legend colorbar savefig tight_layout grid set_xlim set_ylim plot scatter hist boxplot imshow cmap alpha bins tick_params annotate quiver contour barh stackplot subplots_adjust axhline axvline semilogx semilogy loglog polar streamplot hexbin pcolor tricontour errorbar clabel set_aspect violinplot set_axis_off spines text hatch plt axis plt.bar() plt.axis import figure pyplot highlight_text pypalettes plt.subplots() xlabel ylabel title legend colorbar savefig tight_layout grid set_xlim set_ylim plot scatter hist boxplot imshow cmap alpha bins tick_params annotate quiver contour barh stackplot subplots_adjust axhline axvline semilogx semilogy loglog polar streamplot hexbin pcolor tricontour errorbar clabel set_aspect violinplot set_axis_off spines text hatch plt axis plt.bar() plt.axis import figure pyplot highlight_text pypalettes plt.subplots() xlabel ylabel title legend colorbar savefig tight_layout grid set_xlim set_ylim plot scatter hist boxplot imshow cmap alpha bins tick_params annotate quiver contour barh stackplot subplots_adjust axhline axvline semilogx semilogy loglog polar streamplot hexbin pcolor tricontour errorbar clabel set_aspect violinplot set_axis_off spines text hatch plt axis plt.bar() plt.axis import figure pyplot highlight_text pypalettes plt.subplots() xlabel ylabel title legend colorbar savefig tight_layout grid set_xlim set_ylim plot scatter hist boxplot imshow cmap alpha bins tick_params annotate quiver contour barh stackplot subplots_adjust axhline axvline semilogx semilogy loglog polar streamplot hexbin pcolor tricontour errorbar clabel set_aspect violinplot set_axis_off spines text hatch plt axis plt.bar() plt.axis import figure pyplot highlight_text pypalettes plt.subplots() xlabel ylabel title legend colorbar savefig tight_layout grid set_xlim set_ylim plot scatter hist boxplot imshow cmap alpha bins tick_params annotate quiver contour barh stackplot subplots_adjust axhline axvline semilogx semilogy loglog polar streamplot hexbin pcolor tricontour errorbar clabel set_aspect violinplot set_axis_off spines text hatch plt axis plt.bar() plt.axis import figure pyplot highlight_text pypalettes plt.subplots() xlabel ylabel title legend colorbar savefig tight_layout grid set_xlim set_ylim plot scatter hist boxplot imshow cmap alpha bins tick_params annotate quiver contour barh stackplot subplots_adjust axhline axvline semilogx semilogy loglog polar streamplot hexbin pcolor tricontour errorbar clabel set_aspect violinplot set_axis_off spines text hatch plt axis plt.bar() plt.axis import figure pyplot highlight_text pypalettes plt.subplots() xlabel ylabel title legend colorbar savefig tight_layout grid set_xlim set_ylim plot scatter hist boxplot imshow cmap alpha bins tick_params annotate quiver contour barh stackplot subplots_adjust axhline axvline semilogx semilogy loglog polar streamplot hexbin pcolor tricontour errorbar clabel set_aspect violinplot set_axis_off spines text hatch plt axis plt.bar() plt.axis import figure pyplot highlight_text pypalettes plt.subplots() xlabel ylabel title legend colorbar savefig tight_layout grid set_xlim set_ylim plot scatter hist boxplot imshow cmap alpha bins tick_params annotate quiver contour barh stackplot subplots_adjust axhline axvline semilogx semilogy loglog polar streamplot hexbin pcolor tricontour errorbar clabel set_aspect violinplot set_axis_off spines text hatch plt axis plt.bar() plt.axis import figure pyplot highlight_text pypalettes plt.subplots() xlabel ylabel title legend colorbar savefig tight_layout grid set_xlim set_ylim plot scatter hist boxplot imshow cmap alpha bins tick_params annotate quiver contour barh stackplot subplots_adjust axhline axvline semilogx semilogy loglog polar streamplot hexbin pcolor tricontour errorbar clabel set_aspect violinplot set_axis_off spines text hatch plt axis plt.bar() plt.axis import figure pyplot highlight_text pypalettes plt.subplots() xlabel ylabel title legend colorbar savefig tight_layout grid set_xlim set_ylim plot scatter hist boxplot imshow cmap alpha bins tick_params annotate quiver contour barh stackplot subplots_adjust axhline axvline semilogx semilogy loglog polar streamplot hexbin pcolor tricontour errorbar clabel set_aspect violinplot set_axis_off spines text hatch plt axis plt.bar() plt.axis import figure pyplot highlight_text pypalettes plt.subplots() xlabel ylabel title legend colorbar savefig tight_layout grid set_xlim set_ylim plot scatter hist boxplot imshow cmap alpha bins tick_params annotate quiver contour barh stackplot subplots_adjust axhline axvline semilogx semilogy loglog polar streamplot hexbin pcolor tricontour errorbar clabel set_aspect violinplot set_axis_off spines text hatch plt axis plt.bar() plt.axis import figure pyplot highlight_text pypalettes plt.subplots() xlabel ylabel title legend colorbar savefig tight_layout grid set_xlim set_ylim plot scatter hist boxplot imshow cmap alpha bins tick_params annotate quiver contour barh stackplot subplots_adjust axhline axvline semilogx semilogy loglog polar streamplot hexbin pcolor tricontour errorbar clabel set_aspect violinplot set_axis_off spines text hatch plt axis plt.bar() plt.axis import figure pyplot highlight_text pypalettes plt.subplots() xlabel ylabel title legend colorbar savefig tight_layout grid set_xlim set_ylim plot scatter hist boxplot imshow cmap alpha bins tick_params annotate quiver contour barh stackplot subplots_adjust axhline axvline semilogx semilogy loglog polar streamplot hexbin pcolor tricontour errorbar clabel set_aspect violinplot set_axis_off spines text hatch plt axis plt.bar() plt.axis import figure pyplot highlight_text pypalettes plt.subplots() xlabel ylabel title legend colorbar savefig tight_layout grid set_xlim set_ylim plot scatter hist boxplot imshow cmap alpha bins tick_params annotate quiver contour barh stackplot subplots_adjust axhline axvline semilogx semilogy loglog polar streamplot hexbin pcolor tricontour errorbar clabel set_aspect violinplot set_axis_off spines text hatch plt axis plt.bar() plt.axis import figure pyplot highlight_text pypalettes plt.subplots() xlabel ylabel title legend colorbar savefig tight_layout grid set_xlim set_ylim plot scatter hist boxplot imshow cmap alpha bins tick_params annotate quiver contour barh stackplot subplots_adjust axhline axvline semilogx semilogy loglog polar streamplot hexbin pcolor tricontour errorbar clabel set_aspect violinplot set_axis_off spines text hatch plt axis plt.bar() plt.axis import figure pyplot highlight_text pypalettes plt.subplots() xlabel ylabel title legend colorbar savefig tight_layout grid set_xlim set_ylim plot scatter hist boxplot imshow cmap alpha bins tick_params annotate quiver contour barh stackplot subplots_adjust axhline axvline semilogx semilogy loglog polar streamplot hexbin pcolor tricontour errorbar clabel set_aspect violinplot set_axis_off spines text hatch plt axis plt.bar() plt.axis import figure pyplot highlight_text pypalettes plt.subplots() xlabel ylabel title legend colorbar savefig tight_layout grid set_xlim set_ylim plot scatter hist boxplot imshow cmap alpha bins tick_params annotate quiver contour barh stackplot subplots_adjust axhline axvline semilogx semilogy loglog polar streamplot hexbin pcolor tricontour errorbar clabel set_aspect violinplot set_axis_off spines text hatch plt axis plt.bar() plt.axis import figure pyplot highlight_text pypalettes plt.subplots() xlabel ylabel title legend colorbar savefig tight_layout grid set_xlim set_ylim plot scatter hist boxplot imshow cmap alpha bins tick_params annotate quiver contour barh stackplot subplots_adjust axhline axvline semilogx semilogy loglog polar streamplot hexbin pcolor tricontour errorbar clabel set_aspect violinplot set_axis_off spines text hatch plt axis plt.bar() plt.axis import figure pyplot highlight_text pypalettes plt.subplots() xlabel ylabel title legend colorbar savefig tight_layout grid set_xlim set_ylim plot scatter hist boxplot imshow cmap alpha bins tick_params annotate quiver contour barh stackplot subplots_adjust axhline axvline semilogx semilogy loglog polar streamplot hexbin pcolor tricontour errorbar clabel set_aspect violinplot set_axis_off spines text hatch plt axis plt.bar() plt.axis import figure pyplot highlight_text pypalettes plt.subplots() xlabel ylabel title legend colorbar savefig tight_layout grid set_xlim set_ylim plot scatter hist boxplot imshow cmap alpha bins tick_params annotate quiver contour barh stackplot subplots_adjust axhline axvline semilogx semilogy loglog polar streamplot hexbin pcolor tricontour errorbar clabel set_aspect violinplot set_axis_off spines text hatch plt axis plt.bar() plt.axis import figure pyplot highlight_text pypalettes plt.subplots() xlabel ylabel title legend colorbar savefig tight_layout grid set_xlim set_ylim plot scatter hist boxplot imshow cmap alpha bins tick_params annotate quiver contour barh stackplot subplots_adjust axhline axvline semilogx semilogy loglog polar streamplot hexbin pcolor tricontour errorbar clabel set_aspect violinplot set_axis_off spines text hatch plt axis plt.bar() plt.axis import figure pyplot highlight_text pypalettes plt.subplots() xlabel ylabel title legend colorbar savefig tight_layout grid set_xlim set_ylim plot scatter hist boxplot imshow cmap alpha bins tick_params annotate quiver contour barh stackplot subplots_adjust axhline axvline semilogx semilogy loglog polar streamplot hexbin pcolor tricontour errorbar clabel set_aspect violinplot set_axis_off spines text hatch plt axis plt.bar() plt.axis import figure pyplot highlight_text pypalettes plt.subplots() xlabel ylabel title legend colorbar savefig tight_layout grid set_xlim set_ylim plot scatter hist boxplot imshow cmap alpha bins tick_params annotate quiver contour barh stackplot subplots_adjust axhline axvline semilogx semilogy loglog polar streamplot hexbin pcolor tricontour errorbar clabel set_aspect violinplot set_axis_off spines text hatch plt axis plt.bar() plt.axis import figure pyplot highlight_text pypalettes plt.subplots() xlabel ylabel title legend colorbar savefig tight_layout grid set_xlim set_ylim plot scatter hist boxplot imshow cmap alpha bins tick_params annotate quiver contour barh stackplot subplots_adjust axhline axvline semilogx semilogy loglog polar streamplot hexbin pcolor tricontour errorbar clabel set_aspect violinplot set_axis_off spines text hatch plt axis plt.bar() plt.axis import figure pyplot highlight_text pypalettes plt.subplots() xlabel ylabel title legend colorbar savefig tight_layout grid set_xlim set_ylim plot scatter hist boxplot imshow cmap alpha bins tick_params annotate quiver contour barh stackplot subplots_adjust axhline axvline semilogx semilogy loglog polar streamplot hexbin pcolor tricontour errorbar clabel set_aspect violinplot set_axis_off spines text hatch plt axis plt.bar() plt.axis import figure pyplot highlight_text pypalettes plt.subplots() xlabel ylabel title legend colorbar savefig tight_layout grid set_xlim set_ylim plot scatter hist boxplot imshow cmap alpha bins tick_params annotate quiver contour barh stackplot subplots_adjust axhline axvline semilogx semilogy loglog polar streamplot hexbin pcolor tricontour errorbar clabel set_aspect violinplot set_axis_off spines text hatch plt axis plt.bar() plt.axis import figure pyplot highlight_text pypalettes plt.subplots() xlabel ylabel title legend colorbar savefig tight_layout grid set_xlim set_ylim plot scatter hist boxplot imshow cmap alpha bins tick_params annotate quiver contour barh stackplot subplots_adjust axhline axvline semilogx semilogy loglog polar streamplot hexbin pcolor tricontour errorbar clabel set_aspect violinplot set_axis_off spines text hatch plt axis plt.bar() plt.axis import figure pyplot highlight_text pypalettes plt.subplots() xlabel ylabel title legend colorbar savefig tight_layout grid set_xlim set_ylim plot scatter hist boxplot imshow cmap alpha bins tick_params annotate quiver contour barh stackplot subplots_adjust axhline axvline semilogx semilogy loglog polar streamplot hexbin pcolor tricontour errorbar clabel set_aspect violinplot set_axis_off spines text hatch plt axis plt.bar() plt.axis import figure pyplot highlight_text pypalettes plt.subplots() xlabel ylabel title legend colorbar savefig tight_layout grid set_xlim set_ylim plot scatter hist boxplot imshow cmap alpha bins tick_params annotate quiver contour barh stackplot subplots_adjust axhline axvline semilogx semilogy loglog polar streamplot hexbin pcolor tricontour errorbar clabel set_aspect violinplot set_axis_off spines text hatch plt axis plt.bar() plt.axis import figure pyplot highlight_text pypalettes plt.subplots() xlabel ylabel title legend colorbar savefig tight_layout grid set_xlim set_ylim plot scatter hist boxplot imshow cmap alpha bins tick_params annotate quiver contour barh stackplot subplots_adjust axhline axvline semilogx semilogy loglog polar streamplot hexbin pcolor tricontour errorbar clabel set_aspect violinplot set_axis_off spines text hatch plt axis plt.bar() plt.axis import figure pyplot highlight_text pypalettes plt.subplots() xlabel ylabel title legend colorbar savefig tight_layout grid set_xlim set_ylim plot scatter hist boxplot imshow cmap alpha bins tick_params annotate quiver contour barh stackplot subplots_adjust axhline axvline semilogx semilogy loglog polar streamplot hexbin pcolor tricontour errorbar clabel set_aspect violinplot set_axis_off spines text hatch plt axis plt.bar() plt.axis import figure pyplot highlight_text pypalettes plt.subplots() xlabel ylabel title legend colorbar savefig tight_layout grid set_xlim set_ylim plot scatter hist boxplot imshow cmap alpha bins tick_params annotate quiver contour barh stackplot subplots_adjust axhline axvline semilogx semilogy loglog polar streamplot hexbin pcolor tricontour errorbar clabel set_aspect violinplot set_axis_off spines text hatch plt axis plt.bar() plt.axis import figure pyplot highlight_text pypalettes plt.subplots() xlabel ylabel title legend colorbar savefig tight_layout grid set_xlim set_ylim plot scatter hist boxplot imshow cmap alpha bins tick_params annotate quiver contour barh stackplot subplots_adjust axhline axvline semilogx semilogy loglog polar streamplot hexbin pcolor tricontour errorbar clabel set_aspect violinplot set_axis_off spines text hatch plt axis plt.bar() plt.axis import figure pyplot highlight_text pypalettes plt.subplots() xlabel ylabel title legend colorbar savefig tight_layout grid set_xlim set_ylim plot scatter hist boxplot imshow cmap alpha bins tick_params annotate quiver contour barh stackplot subplots_adjust axhline axvline semilogx semilogy loglog polar streamplot hexbin pcolor tricontour errorbar clabel set_aspect violinplot set_axis_off spines text hatch plt axis plt.bar() plt.axis import figure pyplot highlight_text pypalettes plt.subplots() xlabel ylabel title legend colorbar savefig tight_layout grid set_xlim set_ylim plot scatter hist boxplot imshow cmap alpha bins tick_params annotate quiver contour barh stackplot subplots_adjust axhline axvline semilogx semilogy loglog polar streamplot hexbin pcolor tricontour errorbar clabel set_aspect violinplot set_axis_off spines text hatch plt axis plt.bar() plt.axis import figure pyplot highlight_text pypalettes plt.subplots() xlabel ylabel title legend colorbar savefig tight_layout grid set_xlim set_ylim plot scatter hist boxplot imshow cmap alpha bins tick_params annotate quiver contour barh stackplot subplots_adjust axhline axvline semilogx semilogy loglog polar streamplot hexbin pcolor tricontour errorbar clabel set_aspect violinplot set_axis_off spines text hatch plt axis plt.bar() plt.axis import figure pyplot highlight_text pypalettes plt.subplots() xlabel ylabel title legend colorbar savefig tight_layout grid set_xlim set_ylim plot scatter hist boxplot imshow cmap alpha bins tick_params annotate quiver contour barh stackplot subplots_adjust axhline axvline semilogx semilogy loglog polar streamplot hexbin pcolor tricontour errorbar clabel set_aspect violinplot set_axis_off spines text hatch plt axis plt.bar() plt.axis import figure pyplot highlight_text pypalettes plt.subplots() xlabel ylabel title legend colorbar savefig tight_layout grid set_xlim set_ylim plot scatter hist boxplot imshow cmap alpha bins tick_params annotate quiver contour barh stackplot subplots_adjust axhline axvline semilogx semilogy loglog polar streamplot hexbin pcolor tricontour errorbar clabel set_aspect violinplot set_axis_off spines text hatch plt axis plt.bar() plt.axis import figure pyplot highlight_text pypalettes plt.subplots() xlabel ylabel title legend colorbar savefig tight_layout grid set_xlim set_ylim plot scatter hist boxplot imshow cmap alpha bins tick_params annotate quiver contour barh stackplot subplots_adjust axhline axvline semilogx semilogy loglog polar streamplot hexbin pcolor tricontour errorbar clabel set_aspect violinplot set_axis_off spines text hatch plt axis plt.bar() plt.axis import figure pyplot highlight_text pypalettes plt.subplots() xlabel ylabel title legend colorbar savefig tight_layout grid set_xlim set_ylim plot scatter hist boxplot imshow cmap alpha bins tick_params annotate quiver contour barh stackplot subplots_adjust axhline axvline semilogx semilogy loglog polar streamplot hexbin pcolor tricontour errorbar clabel set_aspect violinplot set_axis_off spines text hatch plt axis plt.bar() plt.axis import figure pyplot highlight_text pypalettes plt.subplots() xlabel ylabel title legend colorbar savefig tight_layout grid set_xlim set_ylim plot scatter hist boxplot imshow cmap alpha bins tick_params annotate quiver contour barh stackplot subplots_adjust axhline axvline semilogx semilogy loglog polar streamplot hexbin pcolor tricontour errorbar clabel set_aspect violinplot set_axis_off spines text hatch plt axis plt.bar() plt.axis import figure pyplot highlight_text pypalettes plt.subplots() xlabel ylabel title legend colorbar savefig tight_layout grid set_xlim set_ylim plot scatter hist boxplot imshow cmap alpha bins tick_params annotate quiver contour barh stackplot subplots_adjust axhline axvline semilogx semilogy loglog polar streamplot hexbin pcolor tricontour errorbar clabel set_aspect violinplot set_axis_off spines text hatch plt axis plt.bar() plt.axis import figure pyplot highlight_text pypalettes plt.subplots() xlabel ylabel title legend colorbar savefig tight_layout grid set_xlim set_ylim plot scatter hist boxplot imshow cmap alpha bins tick_params annotate quiver contour barh stackplot subplots_adjust axhline axvline semilogx semilogy loglog polar streamplot hexbin pcolor tricontour errorbar clabel set_aspect violinplot set_axis_off spines text hatch plt axis plt.bar() plt.axis import figure pyplot highlight_text pypalettes plt.subplots() xlabel ylabel title legend colorbar savefig tight_layout grid set_xlim set_ylim plot scatter hist boxplot imshow cmap alpha bins tick_params annotate quiver contour barh stackplot subplots_adjust axhline axvline semilogx semilogy loglog polar streamplot hexbin pcolor tricontour errorbar clabel set_aspect violinplot set_axis_off spines text hatch plt axis plt.bar() plt.axis import figure pyplot highlight_text pypalettes plt.subplots() xlabel ylabel title legend colorbar savefig tight_layout grid set_xlim set_ylim plot scatter hist boxplot imshow cmap alpha bins tick_params annotate quiver contour barh stackplot subplots_adjust axhline axvline semilogx semilogy loglog polar streamplot hexbin pcolor tricontour errorbar clabel set_aspect violinplot set_axis_off spines text hatch plt axis plt.bar() plt.axis import figure pyplot highlight_text pypalettes plt.subplots() xlabel ylabel title legend colorbar savefig tight_layout grid set_xlim set_ylim plot scatter hist boxplot imshow cmap alpha bins tick_params annotate quiver contour barh stackplot subplots_adjust axhline axvline semilogx semilogy loglog polar streamplot hexbin pcolor tricontour errorbar clabel set_aspect violinplot set_axis_off spines text hatch plt axis plt.bar() plt.axis import figure pyplot highlight_text pypalettes plt.subplots() xlabel ylabel title legend colorbar savefig tight_layout grid set_xlim set_ylim plot scatter hist boxplot imshow cmap alpha bins tick_params annotate quiver contour barh stackplot subplots_adjust axhline axvline semilogx semilogy loglog polar streamplot hexbin pcolor tricontour errorbar clabel set_aspect violinplot set_axis_off spines text hatch plt axis plt.bar() plt.axis import figure pyplot highlight_text pypalettes plt.subplots() xlabel ylabel title legend colorbar savefig tight_layout grid set_xlim set_ylim plot scatter hist boxplot imshow cmap alpha bins tick_params annotate quiver contour barh stackplot subplots_adjust axhline axvline semilogx semilogy loglog polar streamplot hexbin pcolor tricontour errorbar clabel set_aspect violinplot set_axis_off spines text hatch plt axis plt.bar() plt.axis import figure pyplot highlight_text pypalettes plt.subplots() xlabel ylabel title legend colorbar savefig tight_layout grid set_xlim set_ylim plot scatter hist boxplot imshow cmap alpha bins tick_params annotate quiver contour barh stackplot subplots_adjust axhline axvline semilogx semilogy loglog polar streamplot hexbin pcolor tricontour errorbar clabel set_aspect violinplot set_axis_off spines text hatch plt axis plt.bar() plt.axis import figure pyplot highlight_text pypalettes plt.subplots() xlabel ylabel title legend colorbar savefig tight_layout grid set_xlim set_ylim plot scatter hist boxplot imshow cmap alpha bins tick_params annotate quiver contour barh stackplot subplots_adjust axhline axvline semilogx semilogy loglog polar streamplot hexbin pcolor tricontour errorbar clabel set_aspect violinplot set_axis_off spines text hatch plt axis plt.bar() plt.axis import figure pyplot highlight_text pypalettes plt.subplots() xlabel ylabel title legend colorbar savefig tight_layout grid set_xlim set_ylim plot scatter hist boxplot imshow cmap alpha bins tick_params annotate quiver contour barh stackplot subplots_adjust axhline axvline semilogx semilogy loglog polar streamplot hexbin pcolor tricontour errorbar clabel set_aspect violinplot set_axis_off spines text hatch plt axis plt.bar() plt.axis import figure pyplot highlight_text pypalettes plt.subplots() xlabel ylabel title legend colorbar savefig tight_layout grid set_xlim set_ylim plot scatter hist boxplot imshow cmap alpha bins tick_params annotate quiver contour barh stackplot subplots_adjust axhline axvline semilogx semilogy loglog polar streamplot hexbin pcolor tricontour errorbar clabel set_aspect violinplot set_axis_off spines text hatch plt axis plt.bar() plt.axis import figure pyplot highlight_text pypalettes plt.subplots() xlabel ylabel title legend colorbar savefig tight_layout grid set_xlim set_ylim plot scatter hist boxplot imshow cmap alpha bins tick_params annotate quiver contour barh stackplot subplots_adjust axhline axvline semilogx semilogy loglog polar streamplot hexbin pcolor tricontour errorbar clabel set_aspect violinplot set_axis_off spines text hatch plt axis plt.bar() plt.axis import figure pyplot highlight_text pypalettes plt.subplots() xlabel ylabel title legend colorbar savefig tight_layout grid set_xlim set_ylim plot scatter hist boxplot imshow cmap alpha bins tick_params annotate quiver contour barh stackplot subplots_adjust axhline axvline semilogx semilogy loglog polar streamplot hexbin pcolor tricontour errorbar clabel set_aspect violinplot set_axis_off spines text hatch plt axis plt.bar() plt.axis import figure pyplot highlight_text pypalettes plt.subplots() xlabel ylabel title legend colorbar savefig tight_layout grid set_xlim set_ylim plot scatter hist boxplot imshow cmap alpha bins tick_params annotate quiver contour barh stackplot subplots_adjust axhline axvline semilogx semilogy loglog polar streamplot hexbin pcolor tricontour errorbar clabel set_aspect violinplot set_axis_off spines text hatch plt axis plt.bar() plt.axis import figure pyplot highlight_text pypalettes plt.subplots() xlabel ylabel title legend colorbar savefig tight_layout grid set_xlim set_ylim plot scatter hist boxplot imshow cmap alpha bins tick_params annotate quiver contour barh stackplot subplots_adjust axhline axvline semilogx semilogy loglog polar streamplot hexbin pcolor tricontour errorbar clabel set_aspect violinplot set_axis_off spines text hatch plt axis plt.bar() plt.axis import figure pyplot highlight_text pypalettes plt.subplots() xlabel ylabel title legend colorbar savefig tight_layout grid set_xlim set_ylim plot scatter hist boxplot imshow cmap alpha bins tick_params annotate quiver contour barh stackplot subplots_adjust axhline axvline semilogx semilogy loglog polar streamplot hexbin pcolor tricontour errorbar clabel set_aspect violinplot set_axis_off spines text hatch plt axis plt.bar() plt.axis import figure pyplot highlight_text pypalettes plt.subplots() xlabel ylabel title legend colorbar savefig tight_layout grid set_xlim set_ylim plot scatter hist boxplot imshow cmap alpha bins tick_params annotate quiver contour barh stackplot subplots_adjust axhline axvline semilogx semilogy loglog polar streamplot hexbin pcolor tricontour errorbar clabel set_aspect violinplot set_axis_off spines text hatch plt axis plt.bar() plt.axis import figure pyplot highlight_text pypalettes plt.subplots() xlabel ylabel title legend colorbar savefig tight_layout grid set_xlim set_ylim plot scatter hist boxplot imshow cmap alpha bins tick_params annotate quiver contour barh stackplot subplots_adjust axhline axvline semilogx semilogy loglog polar streamplot hexbin pcolor tricontour errorbar clabel set_aspect violinplot set_axis_off spines text hatch plt axis plt.bar() plt.axis import figure pyplot highlight_text pypalettes plt.subplots() xlabel ylabel title legend colorbar savefig tight_layout grid set_xlim set_ylim plot scatter hist boxplot imshow cmap alpha bins tick_params annotate quiver contour barh stackplot subplots_adjust axhline axvline semilogx semilogy loglog polar streamplot hexbin pcolor tricontour errorbar clabel set_aspect violinplot set_axis_off spines text hatch plt axis plt.bar() plt.axis import figure pyplot highlight_text pypalettes plt.subplots() xlabel ylabel title legend colorbar savefig tight_layout grid set_xlim set_ylim plot scatter hist boxplot imshow cmap alpha bins tick_params annotate quiver contour barh stackplot subplots_adjust axhline axvline semilogx semilogy loglog polar streamplot hexbin pcolor tricontour errorbar clabel set_aspect violinplot set_axis_off spines text hatch plt axis plt.bar() plt.axis import figure pyplot highlight_text pypalettes plt.subplots() xlabel ylabel title legend colorbar savefig tight_layout grid set_xlim set_ylim plot scatter hist boxplot imshow cmap alpha bins tick_params annotate quiver contour barh stackplot subplots_adjust axhline axvline semilogx semilogy loglog polar streamplot hexbin pcolor tricontour errorbar clabel set_aspect violinplot set_axis_off spines text hatch plt axis plt.bar() plt.axis import figure pyplot highlight_text pypalettes plt.subplots() xlabel ylabel title legend colorbar savefig tight_layout grid set_xlim set_ylim plot scatter hist boxplot imshow cmap alpha bins tick_params annotate quiver contour barh stackplot subplots_adjust axhline axvline semilogx semilogy loglog polar streamplot hexbin pcolor tricontour errorbar clabel set_aspect violinplot set_axis_off spines text hatch plt axis plt.bar() plt.axis import figure pyplot highlight_text pypalettes plt.subplots() xlabel ylabel title legend colorbar savefig tight_layout grid set_xlim set_ylim plot scatter hist boxplot imshow cmap alpha bins tick_params annotate quiver contour barh stackplot subplots_adjust axhline axvline semilogx semilogy loglog polar streamplot hexbin pcolor tricontour errorbar clabel set_aspect violinplot set_axis_off spines text hatch plt axis plt.bar() plt.axis import figure pyplot highlight_text pypalettes plt.subplots() xlabel ylabel title legend colorbar savefig tight_layout grid set_xlim set_ylim plot scatter hist boxplot imshow cmap alpha bins tick_params annotate quiver contour barh stackplot subplots_adjust axhline axvline semilogx semilogy loglog polar streamplot hexbin pcolor tricontour errorbar clabel set_aspect violinplot set_axis_off spines text hatch plt axis plt.bar() plt.axis import figure pyplot highlight_text pypalettes plt.subplots() xlabel ylabel title legend colorbar savefig tight_layout grid set_xlim set_ylim plot scatter hist boxplot imshow cmap alpha bins tick_params annotate quiver contour barh stackplot subplots_adjust axhline axvline semilogx semilogy loglog polar streamplot hexbin pcolor tricontour errorbar clabel set_aspect violinplot set_axis_off spines text hatch plt axis plt.bar() plt.axis import figure pyplot highlight_text pypalettes plt.subplots() xlabel ylabel title legend colorbar savefig tight_layout grid set_xlim set_ylim plot scatter hist boxplot imshow cmap alpha bins tick_params annotate quiver contour barh stackplot subplots_adjust axhline axvline semilogx semilogy loglog polar streamplot hexbin pcolor tricontour errorbar clabel set_aspect violinplot set_axis_off spines text hatch plt axis plt.bar() plt.axis import figure pyplot highlight_text pypalettes plt.subplots() xlabel ylabel title legend colorbar savefig tight_layout grid set_xlim set_ylim plot scatter hist boxplot imshow cmap alpha bins tick_params annotate quiver contour barh stackplot subplots_adjust axhline axvline semilogx semilogy loglog polar streamplot hexbin pcolor tricontour errorbar clabel set_aspect violinplot set_axis_off spines text hatch plt axis plt.bar() plt.axis import figure pyplot highlight_text pypalettes plt.subplots() xlabel ylabel title legend colorbar savefig tight_layout grid set_xlim set_ylim plot scatter hist boxplot imshow cmap alpha bins tick_params annotate quiver contour barh stackplot subplots_adjust axhline axvline semilogx semilogy loglog polar streamplot hexbin pcolor tricontour errorbar clabel set_aspect violinplot set_axis_off spines text hatch plt axis plt.bar() plt.axis import figure pyplot highlight_text pypalettes plt.subplots() xlabel ylabel title legend colorbar savefig tight_layout grid set_xlim set_ylim plot scatter hist boxplot imshow cmap alpha bins tick_params annotate quiver contour barh stackplot subplots_adjust axhline axvline semilogx semilogy loglog polar streamplot hexbin pcolor tricontour errorbar clabel set_aspect violinplot set_axis_off spines text hatch plt axis plt.bar() plt.axis import figure pyplot highlight_text pypalettes plt.subplots() xlabel ylabel title legend colorbar savefig tight_layout grid set_xlim set_ylim plot scatter hist boxplot imshow cmap alpha bins tick_params annotate quiver contour barh stackplot subplots_adjust axhline axvline semilogx semilogy loglog polar streamplot hexbin pcolor tricontour errorbar clabel set_aspect violinplot set_axis_off spines text hatch plt axis plt.bar() plt.axis import figure pyplot highlight_text pypalettes plt.subplots() xlabel ylabel title legend colorbar savefig tight_layout grid set_xlim set_ylim plot scatter hist boxplot imshow cmap alpha bins tick_params annotate quiver contour barh stackplot subplots_adjust axhline axvline semilogx semilogy loglog polar streamplot hexbin pcolor tricontour errorbar clabel set_aspect violinplot set_axis_off spines text hatch plt axis plt.bar() plt.axis import figure pyplot highlight_text pypalettes plt.subplots() xlabel ylabel title legend colorbar savefig tight_layout grid set_xlim set_ylim plot scatter hist boxplot imshow cmap alpha bins tick_params annotate quiver contour barh stackplot subplots_adjust axhline axvline semilogx semilogy loglog polar streamplot hexbin pcolor tricontour errorbar clabel set_aspect violinplot set_axis_off spines text hatch plt axis plt.bar() plt.axis import figure pyplot highlight_text pypalettes plt.subplots() xlabel ylabel title legend colorbar savefig tight_layout grid set_xlim set_ylim plot scatter hist boxplot imshow cmap alpha bins tick_params annotate quiver contour barh stackplot subplots_adjust axhline axvline semilogx semilogy loglog polar streamplot hexbin pcolor tricontour errorbar clabel set_aspect violinplot set_axis_off spines text hatch plt axis plt.bar() plt.axis import figure pyplot highlight_text pypalettes plt.subplots() xlabel ylabel title legend colorbar savefig tight_layout grid set_xlim set_ylim plot scatter hist boxplot imshow cmap alpha bins tick_params annotate quiver contour barh stackplot subplots_adjust axhline axvline semilogx semilogy loglog polar streamplot hexbin pcolor tricontour errorbar clabel set_aspect violinplot set_axis_off spines text hatch plt axis plt.bar() plt.axis import figure pyplot highlight_text pypalettes plt.subplots() xlabel ylabel title legend colorbar savefig tight_layout grid set_xlim set_ylim plot scatter hist boxplot imshow cmap alpha bins tick_params annotate quiver contour barh stackplot subplots_adjust axhline axvline semilogx semilogy loglog polar streamplot hexbin pcolor tricontour errorbar clabel set_aspect violinplot set_axis_off spines text hatch plt axis plt.bar() plt.axis import figure pyplot highlight_text pypalettes plt.subplots() xlabel ylabel title legend colorbar savefig tight_layout grid set_xlim set_ylim plot scatter hist boxplot imshow cmap alpha bins tick_params annotate quiver contour barh stackplot subplots_adjust axhline axvline semilogx semilogy loglog polar streamplot hexbin pcolor tricontour errorbar clabel set_aspect violinplot set_axis_off spines text hatch plt axis plt.bar() plt.axis import figure pyplot highlight_text pypalettes plt.subplots() xlabel ylabel title legend colorbar savefig tight_layout grid set_xlim set_ylim plot scatter hist boxplot imshow cmap alpha bins tick_params annotate quiver contour barh stackplot subplots_adjust axhline axvline semilogx semilogy loglog polar streamplot hexbin pcolor tricontour errorbar clabel set_aspect violinplot set_axis_off spines text hatch plt axis plt.bar() plt.axis import figure pyplot highlight_text pypalettes plt.subplots() xlabel ylabel title legend colorbar savefig tight_layout grid set_xlim set_ylim plot scatter hist boxplot imshow cmap alpha bins tick_params annotate quiver contour barh stackplot subplots_adjust axhline axvline semilogx semilogy loglog polar streamplot hexbin pcolor tricontour errorbar clabel set_aspect violinplot set_axis_off spines text hatch plt axis plt.bar() plt.axis import figure pyplot highlight_text pypalettes plt.subplots() xlabel ylabel title legend colorbar savefig tight_layout grid set_xlim set_ylim plot scatter hist boxplot imshow cmap alpha bins tick_params annotate quiver contour barh stackplot subplots_adjust axhline axvline semilogx semilogy loglog polar streamplot hexbin pcolor tricontour errorbar clabel set_aspect violinplot set_axis_off spines text hatch plt axis plt.bar() plt.axis import figure pyplot highlight_text pypalettes plt.subplots() xlabel ylabel title legend colorbar savefig tight_layout grid set_xlim set_ylim plot scatter hist boxplot imshow cmap alpha bins tick_params annotate quiver contour barh stackplot subplots_adjust axhline axvline semilogx semilogy loglog polar streamplot hexbin pcolor tricontour errorbar clabel set_aspect violinplot set_axis_off spines text hatch plt axis plt.bar() plt.axis import figure pyplot highlight_text pypalettes plt.subplots() xlabel ylabel title legend colorbar savefig tight_layout grid set_xlim set_ylim plot scatter hist boxplot imshow cmap alpha bins tick_params annotate quiver contour barh stackplot subplots_adjust axhline axvline semilogx semilogy loglog polar streamplot hexbin pcolor tricontour errorbar clabel set_aspect violinplot set_axis_off spines text hatch plt axis plt.bar() plt.axis import figure pyplot highlight_text pypalettes plt.subplots() xlabel ylabel title legend colorbar savefig tight_layout grid set_xlim set_ylim plot scatter hist boxplot imshow cmap alpha bins tick_params annotate quiver contour barh stackplot subplots_adjust axhline axvline semilogx semilogy loglog polar streamplot hexbin pcolor tricontour errorbar clabel set_aspect violinplot set_axis_off spines text hatch plt axis plt.bar() plt.axis import figure pyplot highlight_text pypalettes plt.subplots() xlabel ylabel title legend colorbar savefig tight_layout grid set_xlim set_ylim plot scatter hist boxplot imshow cmap alpha bins tick_params annotate quiver contour barh stackplot subplots_adjust axhline axvline semilogx semilogy loglog polar streamplot hexbin pcolor tricontour errorbar clabel set_aspect violinplot set_axis_off spines text hatch plt axis plt.bar() plt.axis import figure pyplot highlight_text pypalettes plt.subplots() xlabel ylabel title legend colorbar savefig tight_layout grid set_xlim set_ylim plot scatter hist boxplot imshow cmap alpha bins tick_params annotate quiver contour barh stackplot subplots_adjust axhline axvline semilogx semilogy loglog polar streamplot hexbin pcolor tricontour errorbar clabel set_aspect violinplot set_axis_off spines text hatch plt axis plt.bar() plt.axis import figure pyplot highlight_text pypalettes plt.subplots() xlabel ylabel title legend colorbar savefig tight_layout grid set_xlim set_ylim plot scatter hist boxplot imshow cmap alpha bins tick_params annotate quiver contour barh stackplot subplots_adjust axhline axvline semilogx semilogy loglog polar streamplot hexbin pcolor tricontour errorbar clabel set_aspect violinplot set_axis_off spines text hatch plt axis plt.bar() plt.axis import figure pyplot highlight_text pypalettes plt.subplots() xlabel ylabel title legend colorbar savefig tight_layout grid set_xlim set_ylim plot scatter hist boxplot imshow cmap alpha bins tick_params annotate quiver contour barh stackplot subplots_adjust axhline axvline semilogx semilogy loglog polar streamplot hexbin pcolor tricontour errorbar clabel set_aspect violinplot set_axis_off spines text hatch plt axis plt.bar() plt.axis import figure pyplot highlight_text pypalettes plt.subplots() xlabel ylabel title legend colorbar savefig tight_layout grid set_xlim set_ylim plot scatter hist boxplot imshow cmap alpha bins tick_params annotate quiver contour barh stackplot subplots_adjust axhline axvline semilogx semilogy loglog polar streamplot hexbin pcolor tricontour errorbar clabel set_aspect violinplot set_axis_off spines text hatch plt axis plt.bar() plt.axis import figure pyplot highlight_text pypalettes plt.subplots() xlabel ylabel title legend colorbar savefig tight_layout grid set_xlim set_ylim plot scatter hist boxplot imshow cmap alpha bins tick_params annotate quiver contour barh stackplot subplots_adjust axhline axvline semilogx semilogy loglog polar streamplot hexbin pcolor tricontour errorbar clabel set_aspect violinplot set_axis_off spines text hatch plt axis plt.bar() plt.axis import figure pyplot highlight_text pypalettes plt.subplots() xlabel ylabel title legend colorbar savefig tight_layout grid set_xlim set_ylim plot scatter hist boxplot imshow cmap alpha bins tick_params annotate quiver contour barh stackplot subplots_adjust axhline axvline semilogx semilogy loglog polar streamplot hexbin pcolor tricontour errorbar clabel set_aspect violinplot set_axis_off spines text hatch plt axis plt.bar() plt.axis import figure pyplot highlight_text pypalettes plt.subplots() xlabel ylabel title legend colorbar savefig tight_layout grid set_xlim set_ylim plot scatter hist boxplot imshow cmap alpha bins tick_params annotate quiver contour barh stackplot subplots_adjust axhline axvline semilogx semilogy loglog polar streamplot hexbin pcolor tricontour errorbar clabel set_aspect violinplot set_axis_off spines text hatch plt axis plt.bar() plt.axis import figure pyplot highlight_text pypalettes plt.subplots() xlabel ylabel title legend colorbar savefig tight_layout grid set_xlim set_ylim plot scatter hist boxplot imshow cmap alpha bins tick_params annotate quiver contour barh stackplot subplots_adjust axhline axvline semilogx semilogy loglog polar streamplot hexbin pcolor tricontour errorbar clabel set_aspect violinplot set_axis_off spines text hatch plt axis plt.bar() plt.axis import figure pyplot highlight_text pypalettes plt.subplots() xlabel ylabel title legend colorbar savefig tight_layout grid set_xlim set_ylim plot scatter hist boxplot imshow cmap alpha bins tick_params annotate quiver contour barh stackplot subplots_adjust axhline axvline semilogx semilogy loglog polar streamplot hexbin pcolor tricontour errorbar clabel set_aspect violinplot set_axis_off spines text hatch plt axis plt.bar() plt.axis import figure pyplot highlight_text pypalettes plt.subplots() xlabel ylabel title legend colorbar savefig tight_layout grid set_xlim set_ylim plot scatter hist boxplot imshow cmap alpha bins tick_params annotate quiver contour barh stackplot subplots_adjust axhline axvline semilogx semilogy loglog polar streamplot hexbin pcolor tricontour errorbar clabel set_aspect violinplot set_axis_off spines text hatch plt axis plt.bar() plt.axis import figure pyplot highlight_text pypalettes plt.subplots() xlabel ylabel title legend colorbar savefig tight_layout grid set_xlim set_ylim plot scatter hist boxplot imshow cmap alpha bins tick_params annotate quiver contour barh stackplot subplots_adjust axhline axvline semilogx semilogy loglog polar streamplot hexbin pcolor tricontour errorbar clabel set_aspect violinplot set_axis_off spines text hatch plt axis plt.bar() plt.axis import figure pyplot highlight_text pypalettes plt.subplots() xlabel ylabel title legend colorbar savefig tight_layout grid set_xlim set_ylim plot scatter hist boxplot imshow cmap alpha bins tick_params annotate quiver contour barh stackplot subplots_adjust axhline axvline semilogx semilogy loglog polar streamplot hexbin pcolor tricontour errorbar clabel set_aspect violinplot set_axis_off spines text hatch plt axis plt.bar() plt.axis import figure pyplot highlight_text pypalettes plt.subplots() xlabel ylabel title legend colorbar savefig tight_layout grid set_xlim set_ylim plot scatter hist boxplot imshow cmap alpha bins tick_params annotate quiver contour barh stackplot subplots_adjust axhline axvline semilogx semilogy loglog polar streamplot hexbin pcolor tricontour errorbar clabel set_aspect violinplot set_axis_off spines text hatch plt axis plt.bar() plt.axis import figure pyplot highlight_text pypalettes plt.subplots() xlabel ylabel title legend colorbar savefig tight_layout grid set_xlim set_ylim plot scatter hist boxplot imshow cmap alpha bins tick_params annotate quiver contour barh stackplot subplots_adjust axhline axvline semilogx semilogy loglog polar streamplot hexbin pcolor tricontour errorbar clabel set_aspect violinplot set_axis_off spines text hatch plt axis plt.bar() plt.axis import figure pyplot highlight_text pypalettes plt.subplots() xlabel ylabel title legend colorbar savefig tight_layout grid set_xlim set_ylim plot scatter hist boxplot imshow cmap alpha bins tick_params annotate quiver contour barh stackplot subplots_adjust axhline axvline semilogx semilogy loglog polar streamplot hexbin pcolor tricontour errorbar clabel set_aspect violinplot set_axis_off spines text hatch plt axis plt.bar() plt.axis import figure pyplot highlight_text pypalettes plt.subplots() xlabel ylabel title legend colorbar savefig tight_layout grid set_xlim set_ylim plot scatter hist boxplot imshow cmap alpha bins tick_params annotate quiver contour barh stackplot subplots_adjust axhline axvline semilogx semilogy loglog polar streamplot hexbin pcolor tricontour errorbar clabel set_aspect violinplot set_axis_off spines text hatch plt axis plt.bar() plt.axis import figure pyplot highlight_text pypalettes plt.subplots() xlabel ylabel title legend colorbar savefig tight_layout grid set_xlim set_ylim plot scatter hist boxplot imshow cmap alpha bins tick_params annotate quiver contour barh stackplot subplots_adjust axhline axvline semilogx semilogy loglog polar streamplot hexbin pcolor tricontour errorbar clabel set_aspect violinplot set_axis_off spines text hatch plt axis plt.bar() plt.axis import figure pyplot highlight_text pypalettes plt.subplots() xlabel ylabel title legend colorbar savefig tight_layout grid set_xlim set_ylim plot scatter hist boxplot imshow cmap alpha bins tick_params annotate quiver contour barh stackplot subplots_adjust axhline axvline semilogx semilogy loglog polar streamplot hexbin pcolor tricontour errorbar clabel set_aspect violinplot set_axis_off spines text hatch plt axis plt.bar() plt.axis import figure pyplot highlight_text pypalettes plt.subplots() xlabel ylabel title legend colorbar savefig tight_layout grid set_xlim set_ylim plot scatter hist boxplot imshow cmap alpha bins tick_params annotate quiver contour barh stackplot subplots_adjust axhline axvline semilogx semilogy loglog polar streamplot hexbin pcolor tricontour errorbar clabel set_aspect violinplot set_axis_off spines text hatch plt axis plt.bar() plt.axis import figure pyplot highlight_text pypalettes plt.subplots() xlabel ylabel title legend colorbar savefig tight_layout grid set_xlim set_ylim plot scatter hist boxplot imshow cmap alpha bins tick_params annotate quiver contour barh stackplot subplots_adjust axhline axvline semilogx semilogy loglog polar streamplot hexbin pcolor tricontour errorbar clabel set_aspect violinplot set_axis_off spines text hatch plt axis plt.bar() plt.axis import figure pyplot highlight_text pypalettes plt.subplots() xlabel ylabel title legend colorbar savefig tight_layout grid set_xlim set_ylim plot scatter hist boxplot imshow cmap alpha bins tick_params annotate quiver contour barh stackplot subplots_adjust axhline axvline semilogx semilogy loglog polar streamplot hexbin pcolor tricontour errorbar clabel set_aspect violinplot set_axis_off spines text hatch plt axis plt.bar() plt.axis import figure pyplot highlight_text pypalettes plt.subplots() xlabel ylabel title legend colorbar savefig tight_layout grid set_xlim set_ylim plot scatter hist boxplot imshow cmap alpha bins tick_params annotate quiver contour barh stackplot subplots_adjust axhline axvline semilogx semilogy loglog polar streamplot hexbin pcolor tricontour errorbar clabel set_aspect violinplot set_axis_off spines text hatch plt axis plt.bar() plt.axis import figure pyplot highlight_text pypalettes plt.subplots() xlabel ylabel title legend colorbar savefig tight_layout grid set_xlim set_ylim plot scatter hist boxplot imshow cmap alpha bins tick_params annotate quiver contour barh stackplot subplots_adjust axhline axvline semilogx semilogy loglog polar streamplot hexbin pcolor tricontour errorbar clabel set_aspect violinplot set_axis_off spines text hatch plt axis plt.bar() plt.axis import figure pyplot highlight_text pypalettes plt.subplots() xlabel ylabel title legend colorbar savefig tight_layout grid set_xlim set_ylim plot scatter hist boxplot imshow cmap alpha bins tick_params annotate quiver contour barh stackplot subplots_adjust axhline axvline semilogx semilogy loglog polar streamplot hexbin pcolor tricontour errorbar clabel set_aspect violinplot set_axis_off spines text hatch plt axis plt.bar() plt.axis import figure pyplot highlight_text pypalettes plt.subplots() xlabel ylabel title legend colorbar savefig tight_layout grid set_xlim set_ylim plot scatter hist boxplot imshow cmap alpha bins tick_params annotate quiver contour barh stackplot subplots_adjust axhline axvline semilogx semilogy loglog polar streamplot hexbin pcolor tricontour errorbar clabel set_aspect violinplot set_axis_off spines text hatch plt axis plt.bar() plt.axis import figure pyplot highlight_text pypalettes plt.subplots() xlabel ylabel title legend colorbar savefig tight_layout grid set_xlim set_ylim plot scatter hist boxplot imshow cmap alpha bins tick_params annotate quiver contour barh stackplot subplots_adjust axhline axvline semilogx semilogy loglog polar streamplot hexbin pcolor tricontour errorbar clabel set_aspect violinplot set_axis_off spines text hatch plt axis plt.bar() plt.axis import figure pyplot highlight_text pypalettes plt.subplots() xlabel ylabel title legend colorbar savefig tight_layout grid set_xlim set_ylim plot scatter hist boxplot imshow cmap alpha bins tick_params annotate quiver contour barh stackplot subplots_adjust axhline axvline semilogx semilogy loglog polar streamplot hexbin pcolor tricontour errorbar clabel set_aspect violinplot set_axis_off spines text hatch plt axis plt.bar() plt.axis import figure pyplot highlight_text pypalettes plt.subplots() xlabel ylabel title legend colorbar savefig tight_layout grid set_xlim set_ylim plot scatter hist boxplot imshow cmap alpha bins tick_params annotate quiver contour barh stackplot subplots_adjust axhline axvline semilogx semilogy loglog polar streamplot hexbin pcolor tricontour errorbar clabel set_aspect violinplot set_axis_off spines text hatch plt axis plt.bar() plt.axis import figure pyplot highlight_text pypalettes plt.subplots() xlabel ylabel title legend colorbar savefig tight_layout grid set_xlim set_ylim plot scatter hist boxplot imshow cmap alpha bins tick_params annotate quiver contour barh stackplot subplots_adjust axhline axvline semilogx semilogy loglog polar streamplot hexbin pcolor tricontour errorbar clabel set_aspect violinplot set_axis_off spines text hatch plt axis plt.bar() plt.axis import figure pyplot highlight_text pypalettes plt.subplots() xlabel ylabel title legend colorbar savefig tight_layout grid set_xlim set_ylim plot scatter hist boxplot imshow cmap alpha bins tick_params annotate quiver contour barh stackplot subplots_adjust axhline axvline semilogx semilogy loglog polar streamplot hexbin pcolor tricontour errorbar clabel set_aspect violinplot set_axis_off spines text hatch plt axis plt.bar() plt.axis import figure pyplot highlight_text pypalettes plt.subplots() xlabel ylabel title legend colorbar savefig tight_layout grid set_xlim set_ylim plot scatter hist boxplot imshow cmap alpha bins tick_params annotate quiver contour barh stackplot subplots_adjust axhline axvline semilogx semilogy loglog polar streamplot hexbin pcolor tricontour errorbar clabel set_aspect violinplot set_axis_off spines text hatch plt axis plt.bar() plt.axis import figure pyplot highlight_text pypalettes plt.subplots() xlabel ylabel title legend colorbar savefig tight_layout grid set_xlim set_ylim plot scatter hist boxplot imshow cmap alpha bins tick_params annotate quiver contour barh stackplot subplots_adjust axhline axvline semilogx semilogy loglog polar streamplot hexbin pcolor tricontour errorbar clabel set_aspect violinplot set_axis_off spines text hatch plt axis plt.bar() plt.axis import figure pyplot highlight_text pypalettes plt.subplots() xlabel ylabel title legend colorbar savefig tight_layout grid set_xlim set_ylim plot scatter hist boxplot imshow cmap alpha bins tick_params annotate quiver contour barh stackplot subplots_adjust axhline axvline semilogx semilogy loglog polar streamplot hexbin pcolor tricontour errorbar clabel set_aspect violinplot set_axis_off spines text hatch plt axis plt.bar() plt.axis import figure pyplot highlight_text pypalettes plt.subplots() xlabel ylabel title legend colorbar savefig tight_layout grid set_xlim set_ylim plot scatter hist boxplot imshow cmap alpha bins tick_params annotate quiver contour barh stackplot subplots_adjust axhline axvline semilogx semilogy loglog polar streamplot hexbin pcolor tricontour errorbar clabel set_aspect violinplot set_axis_off spines text hatch plt axis plt.bar() plt.axis import figure pyplot highlight_text pypalettes plt.subplots() xlabel ylabel title legend colorbar savefig tight_layout grid set_xlim set_ylim plot scatter hist boxplot imshow cmap alpha bins tick_params annotate quiver contour barh stackplot subplots_adjust axhline axvline semilogx semilogy loglog polar streamplot hexbin pcolor tricontour errorbar clabel set_aspect violinplot set_axis_off spines text hatch plt axis plt.bar() plt.axis import figure pyplot highlight_text pypalettes plt.subplots() xlabel ylabel title legend colorbar savefig tight_layout grid set_xlim set_ylim plot scatter hist boxplot imshow cmap alpha bins tick_params annotate quiver contour barh stackplot subplots_adjust axhline axvline semilogx semilogy loglog polar streamplot hexbin pcolor tricontour errorbar clabel set_aspect violinplot set_axis_off spines text hatch plt axis plt.bar() plt.axis import figure pyplot highlight_text pypalettes plt.subplots() xlabel ylabel title legend colorbar savefig tight_layout grid set_xlim set_ylim plot scatter hist boxplot imshow cmap alpha bins tick_params annotate quiver contour barh stackplot subplots_adjust axhline axvline semilogx semilogy loglog polar streamplot hexbin pcolor tricontour errorbar clabel set_aspect violinplot set_axis_off spines text hatch plt axis plt.bar() plt.axis import figure pyplot highlight_text pypalettes plt.subplots() xlabel ylabel title legend colorbar savefig tight_layout grid set_xlim set_ylim plot scatter hist boxplot imshow cmap alpha bins tick_params annotate quiver contour barh stackplot subplots_adjust axhline axvline semilogx semilogy loglog polar streamplot hexbin pcolor tricontour errorbar clabel set_aspect violinplot set_axis_off spines text hatch plt axis plt.bar() plt.axis import figure pyplot highlight_text pypalettes plt.subplots() xlabel ylabel title legend colorbar savefig tight_layout grid set_xlim set_ylim plot scatter hist boxplot imshow cmap alpha bins tick_params annotate quiver contour barh stackplot subplots_adjust axhline axvline semilogx semilogy loglog polar streamplot hexbin pcolor tricontour errorbar clabel set_aspect violinplot set_axis_off spines text hatch plt axis plt.bar() plt.axis import figure pyplot highlight_text pypalettes plt.subplots() xlabel ylabel title legend colorbar savefig tight_layout grid set_xlim set_ylim plot scatter hist boxplot imshow cmap alpha bins tick_params annotate quiver contour barh stackplot subplots_adjust axhline axvline semilogx semilogy loglog polar streamplot hexbin pcolor tricontour errorbar clabel set_aspect violinplot set_axis_off spines text hatch plt axis plt.bar() plt.axis import figure pyplot highlight_text pypalettes plt.subplots() xlabel ylabel title legend colorbar savefig tight_layout grid set_xlim set_ylim plot scatter hist boxplot imshow cmap alpha bins tick_params annotate quiver contour barh stackplot subplots_adjust axhline axvline semilogx semilogy loglog polar streamplot hexbin pcolor tricontour errorbar clabel set_aspect violinplot set_axis_off spines text hatch plt axis plt.bar() plt.axis import figure pyplot highlight_text pypalettes plt.subplots() xlabel ylabel title legend colorbar savefig tight_layout grid set_xlim set_ylim plot scatter hist boxplot imshow cmap alpha bins tick_params annotate quiver contour barh stackplot subplots_adjust axhline axvline semilogx semilogy loglog polar streamplot hexbin pcolor tricontour errorbar clabel set_aspect violinplot set_axis_off spines text hatch plt axis plt.bar() plt.axis import figure pyplot highlight_text pypalettes plt.subplots() xlabel ylabel title legend colorbar savefig tight_layout grid set_xlim set_ylim plot scatter hist boxplot imshow cmap alpha bins tick_params annotate quiver contour barh stackplot subplots_adjust axhline axvline semilogx semilogy loglog polar streamplot hexbin pcolor tricontour errorbar clabel set_aspect violinplot set_axis_off spines text hatch plt axis plt.bar() plt.axis import figure pyplot highlight_text pypalettes plt.subplots() xlabel ylabel title legend colorbar savefig tight_layout grid set_xlim set_ylim plot scatter hist boxplot imshow cmap alpha bins tick_params annotate quiver contour barh stackplot subplots_adjust axhline axvline semilogx semilogy loglog polar streamplot hexbin pcolor tricontour errorbar clabel set_aspect violinplot set_axis_off spines text hatch plt axis plt.bar() plt.axis import figure pyplot highlight_text pypalettes plt.subplots() xlabel ylabel title legend colorbar savefig tight_layout grid set_xlim set_ylim plot scatter hist boxplot imshow cmap alpha bins tick_params annotate quiver contour barh stackplot subplots_adjust axhline axvline semilogx semilogy loglog polar streamplot hexbin pcolor tricontour errorbar clabel set_aspect violinplot set_axis_off spines text hatch plt axis plt.bar() plt.axis import figure pyplot highlight_text pypalettes plt.subplots() xlabel ylabel title legend colorbar savefig tight_layout grid set_xlim set_ylim plot scatter hist boxplot imshow cmap alpha bins tick_params annotate quiver contour barh stackplot subplots_adjust axhline axvline semilogx semilogy loglog polar streamplot hexbin pcolor tricontour errorbar clabel set_aspect violinplot set_axis_off spines text hatch plt axis plt.bar() plt.axis import figure pyplot highlight_text pypalettes plt.subplots() xlabel ylabel title legend colorbar savefig tight_layout grid set_xlim set_ylim plot scatter hist boxplot imshow cmap alpha bins tick_params annotate quiver contour barh stackplot subplots_adjust axhline axvline semilogx semilogy loglog polar streamplot hexbin pcolor tricontour errorbar clabel set_aspect violinplot set_axis_off spines text hatch plt axis plt.bar() plt.axis import figure pyplot highlight_text pypalettes plt.subplots() xlabel ylabel title legend colorbar savefig tight_layout grid set_xlim set_ylim plot scatter hist boxplot imshow cmap alpha bins tick_params annotate quiver contour barh stackplot subplots_adjust axhline axvline semilogx semilogy loglog polar streamplot hexbin pcolor tricontour errorbar clabel set_aspect violinplot set_axis_off spines text hatch plt axis plt.bar() plt.axis import figure pyplot highlight_text pypalettes plt.subplots() xlabel ylabel title legend colorbar savefig tight_layout grid set_xlim set_ylim plot scatter hist boxplot imshow cmap alpha bins tick_params annotate quiver contour barh stackplot subplots_adjust axhline axvline semilogx semilogy loglog polar streamplot hexbin pcolor tricontour errorbar clabel set_aspect violinplot set_axis_off spines text hatch plt axis plt.bar() plt.axis import figure pyplot highlight_text pypalettes plt.subplots() xlabel ylabel title legend colorbar savefig tight_layout grid set_xlim set_ylim plot scatter hist boxplot imshow cmap alpha bins tick_params annotate quiver contour barh stackplot subplots_adjust axhline axvline semilogx semilogy loglog polar streamplot hexbin pcolor tricontour errorbar clabel set_aspect violinplot set_axis_off spines text hatch plt axis plt.bar() plt.axis import figure pyplot highlight_text pypalettes plt.subplots() xlabel ylabel title legend colorbar savefig tight_layout grid set_xlim set_ylim plot scatter hist boxplot imshow cmap alpha bins tick_params annotate quiver contour barh stackplot subplots_adjust axhline axvline semilogx semilogy loglog polar streamplot hexbin pcolor tricontour errorbar clabel set_aspect violinplot set_axis_off spines text hatch plt axis plt.bar() plt.axis import figure pyplot highlight_text pypalettes plt.subplots() xlabel ylabel title legend colorbar savefig tight_layout grid set_xlim set_ylim plot scatter hist boxplot imshow cmap alpha bins tick_params annotate quiver contour barh stackplot subplots_adjust axhline axvline semilogx semilogy loglog polar streamplot hexbin pcolor tricontour errorbar clabel set_aspect violinplot set_axis_off spines text hatch plt axis plt.bar() plt.axis import figure pyplot highlight_text pypalettes plt.subplots() xlabel ylabel title legend colorbar savefig tight_layout grid set_xlim set_ylim plot scatter hist boxplot imshow cmap alpha bins tick_params annotate quiver contour barh stackplot subplots_adjust axhline axvline semilogx semilogy loglog polar streamplot hexbin pcolor tricontour errorbar clabel set_aspect violinplot set_axis_off spines text hatch plt axis plt.bar() plt.axis import figure pyplot highlight_text pypalettes plt.subplots() xlabel ylabel title legend colorbar savefig tight_layout grid set_xlim set_ylim plot scatter hist boxplot imshow cmap alpha bins tick_params annotate quiver contour barh stackplot subplots_adjust axhline axvline semilogx semilogy loglog polar streamplot hexbin pcolor tricontour errorbar clabel set_aspect violinplot set_axis_off spines text hatch plt axis plt.bar() plt.axis import figure pyplot highlight_text pypalettes plt.subplots() xlabel ylabel title legend colorbar savefig tight_layout grid set_xlim set_ylim plot scatter hist boxplot imshow cmap alpha bins tick_params annotate quiver contour barh stackplot subplots_adjust axhline axvline semilogx semilogy loglog polar streamplot hexbin pcolor tricontour errorbar clabel set_aspect violinplot set_axis_off spines text hatch plt axis plt.bar() plt.axis import figure pyplot highlight_text pypalettes plt.subplots() xlabel ylabel title legend colorbar savefig tight_layout grid set_xlim set_ylim plot scatter hist boxplot imshow cmap alpha bins tick_params annotate quiver contour barh stackplot subplots_adjust axhline axvline semilogx semilogy loglog polar streamplot hexbin pcolor tricontour errorbar clabel set_aspect violinplot set_axis_off spines text hatch plt axis plt.bar() plt.axis import figure pyplot highlight_text pypalettes plt.subplots() xlabel ylabel title legend colorbar savefig tight_layout grid set_xlim set_ylim plot scatter hist boxplot imshow cmap alpha bins tick_params annotate quiver contour barh stackplot subplots_adjust axhline axvline semilogx semilogy loglog polar streamplot hexbin pcolor tricontour errorbar clabel set_aspect violinplot set_axis_off spines text hatch plt axis plt.bar() plt.axis import figure pyplot highlight_text pypalettes plt.subplots() xlabel ylabel title legend colorbar savefig tight_layout grid set_xlim set_ylim plot scatter hist boxplot imshow cmap alpha bins tick_params annotate quiver contour barh stackplot subplots_adjust axhline axvline semilogx semilogy loglog polar streamplot hexbin pcolor tricontour errorbar clabel set_aspect violinplot set_axis_off spines text hatch plt axis plt.bar() plt.axis import figure pyplot highlight_text pypalettes plt.subplots() xlabel ylabel title legend colorbar savefig tight_layout grid set_xlim set_ylim plot scatter hist boxplot imshow cmap alpha bins tick_params annotate quiver contour barh stackplot subplots_adjust axhline axvline semilogx semilogy loglog polar streamplot hexbin pcolor tricontour errorbar clabel set_aspect violinplot set_axis_off spines text hatch plt axis plt.bar() plt.axis import figure pyplot highlight_text pypalettes plt.subplots() xlabel ylabel title legend colorbar savefig tight_layout grid set_xlim set_ylim plot scatter hist boxplot imshow cmap alpha bins tick_params annotate quiver contour barh stackplot subplots_adjust axhline axvline semilogx semilogy loglog polar streamplot hexbin pcolor tricontour errorbar clabel set_aspect violinplot set_axis_off spines text hatch plt axis plt.bar() plt.axis import figure pyplot highlight_text pypalettes plt.subplots() xlabel ylabel title legend colorbar savefig tight_layout grid set_xlim set_ylim plot scatter hist boxplot imshow cmap alpha bins tick_params annotate quiver contour barh stackplot subplots_adjust axhline axvline semilogx semilogy loglog polar streamplot hexbin pcolor tricontour errorbar clabel set_aspect violinplot set_axis_off spines text hatch plt axis plt.bar() plt.axis import figure pyplot highlight_text pypalettes plt.subplots() xlabel ylabel title legend colorbar savefig tight_layout grid set_xlim set_ylim plot scatter hist boxplot imshow cmap alpha bins tick_params annotate quiver contour barh stackplot subplots_adjust axhline axvline semilogx semilogy loglog polar streamplot hexbin pcolor tricontour errorbar clabel set_aspect violinplot set_axis_off spines text hatch plt axis plt.bar() plt.axis import figure pyplot highlight_text pypalettes plt.subplots() xlabel ylabel title legend colorbar savefig tight_layout grid set_xlim set_ylim plot scatter hist boxplot imshow cmap alpha bins tick_params annotate quiver contour barh stackplot subplots_adjust axhline axvline semilogx semilogy loglog polar streamplot hexbin pcolor tricontour errorbar clabel set_aspect violinplot set_axis_off spines text hatch plt axis plt.bar() plt.axis import figure pyplot highlight_text pypalettes plt.subplots() xlabel ylabel title legend colorbar savefig tight_layout grid set_xlim set_ylim plot scatter hist boxplot imshow cmap alpha bins tick_params annotate quiver contour barh stackplot subplots_adjust axhline axvline semilogx semilogy loglog polar streamplot hexbin pcolor tricontour errorbar clabel set_aspect violinplot set_axis_off spines text hatch plt axis plt.bar() plt.axis import figure pyplot highlight_text pypalettes plt.subplots() xlabel ylabel title legend colorbar savefig tight_layout grid set_xlim set_ylim plot scatter hist boxplot imshow cmap alpha bins tick_params annotate quiver contour barh stackplot subplots_adjust axhline axvline semilogx semilogy loglog polar streamplot hexbin pcolor tricontour errorbar clabel set_aspect violinplot set_axis_off spines text hatch plt axis plt.bar() plt.axis import figure pyplot highlight_text pypalettes plt.subplots() xlabel ylabel title legend colorbar savefig tight_layout grid set_xlim set_ylim plot scatter hist boxplot imshow cmap alpha bins tick_params annotate quiver contour barh stackplot subplots_adjust axhline axvline semilogx semilogy loglog polar streamplot hexbin pcolor tricontour errorbar clabel set_aspect violinplot set_axis_off spines text hatch plt axis plt.bar() plt.axis import figure pyplot highlight_text pypalettes plt.subplots() xlabel ylabel title legend colorbar savefig tight_layout grid set_xlim set_ylim plot scatter hist boxplot imshow cmap alpha bins tick_params annotate quiver contour barh stackplot subplots_adjust axhline axvline semilogx semilogy loglog polar streamplot hexbin pcolor tricontour errorbar clabel set_aspect violinplot set_axis_off spines text hatch plt axis plt.bar() plt.axis import figure pyplot highlight_text pypalettes plt.subplots() xlabel ylabel title legend colorbar savefig tight_layout grid set_xlim set_ylim plot scatter hist boxplot imshow cmap alpha bins tick_params annotate quiver contour barh stackplot subplots_adjust axhline axvline semilogx semilogy loglog polar streamplot hexbin pcolor tricontour errorbar clabel set_aspect violinplot set_axis_off spines text hatch plt axis plt.bar() plt.axis import figure pyplot highlight_text pypalettes plt.subplots() xlabel ylabel title legend colorbar savefig tight_layout grid set_xlim set_ylim plot scatter hist boxplot imshow cmap alpha bins tick_params annotate quiver contour barh stackplot subplots_adjust axhline axvline semilogx semilogy loglog polar streamplot hexbin pcolor tricontour errorbar clabel set_aspect violinplot set_axis_off spines text hatch plt axis plt.bar() plt.axis import figure pyplot highlight_text pypalettes plt.subplots() xlabel ylabel title legend colorbar savefig tight_layout grid set_xlim set_ylim plot scatter hist boxplot imshow cmap alpha bins tick_params annotate quiver contour barh stackplot subplots_adjust axhline axvline semilogx semilogy loglog polar streamplot hexbin pcolor tricontour errorbar clabel set_aspect violinplot set_axis_off spines text hatch plt axis plt.bar() plt.axis import figure pyplot highlight_text pypalettes plt.subplots() xlabel ylabel title legend colorbar savefig tight_layout grid set_xlim set_ylim plot scatter hist boxplot imshow cmap alpha bins tick_params annotate quiver contour barh stackplot subplots_adjust axhline axvline semilogx semilogy loglog polar streamplot hexbin pcolor tricontour errorbar clabel set_aspect violinplot set_axis_off spines text hatch plt axis plt.bar() plt.axis import figure pyplot highlight_text pypalettes plt.subplots() xlabel ylabel title legend colorbar savefig tight_layout grid set_xlim set_ylim plot scatter hist boxplot imshow cmap alpha bins tick_params annotate quiver contour barh stackplot subplots_adjust axhline axvline semilogx semilogy loglog polar streamplot hexbin pcolor tricontour errorbar clabel set_aspect violinplot set_axis_off spines text hatch plt axis plt.bar() plt.axis import figure pyplot highlight_text pypalettes plt.subplots() xlabel ylabel title legend colorbar savefig tight_layout grid set_xlim set_ylim plot scatter hist boxplot imshow cmap alpha bins tick_params annotate quiver contour barh stackplot subplots_adjust axhline axvline semilogx semilogy loglog polar streamplot hexbin pcolor tricontour errorbar clabel set_aspect violinplot set_axis_off spines text hatch plt axis plt.bar() plt.axis import figure pyplot highlight_text pypalettes plt.subplots() xlabel ylabel title legend colorbar savefig tight_layout grid set_xlim set_ylim plot scatter hist boxplot imshow cmap alpha bins tick_params annotate quiver contour barh stackplot subplots_adjust axhline axvline semilogx semilogy loglog polar streamplot hexbin pcolor tricontour errorbar clabel set_aspect violinplot set_axis_off spines text hatch plt axis plt.bar() plt.axis import figure pyplot highlight_text pypalettes plt.subplots() xlabel ylabel title legend colorbar savefig tight_layout grid set_xlim set_ylim plot scatter hist boxplot imshow cmap alpha bins tick_params annotate quiver contour barh stackplot subplots_adjust axhline axvline semilogx semilogy loglog polar streamplot hexbin pcolor tricontour errorbar clabel set_aspect violinplot set_axis_off spines text hatch plt axis plt.bar() plt.axis import figure pyplot highlight_text pypalettes plt.subplots() xlabel ylabel title legend colorbar savefig tight_layout grid set_xlim set_ylim plot scatter hist boxplot imshow cmap alpha bins tick_params annotate quiver contour barh stackplot subplots_adjust axhline axvline semilogx semilogy loglog polar streamplot hexbin pcolor tricontour errorbar clabel set_aspect violinplot set_axis_off spines text hatch plt axis plt.bar() plt.axis import figure pyplot highlight_text pypalettes plt.subplots() xlabel ylabel title legend colorbar savefig tight_layout grid set_xlim set_ylim plot scatter hist boxplot imshow cmap alpha bins tick_params annotate quiver contour barh stackplot subplots_adjust axhline axvline semilogx semilogy loglog polar streamplot hexbin pcolor tricontour errorbar clabel set_aspect violinplot set_axis_off spines text hatch plt axis plt.bar() plt.axis import figure pyplot highlight_text pypalettes plt.subplots() xlabel ylabel title legend colorbar savefig tight_layout grid set_xlim set_ylim plot scatter hist boxplot imshow cmap alpha bins tick_params annotate quiver contour barh stackplot subplots_adjust axhline axvline semilogx semilogy loglog polar streamplot hexbin pcolor tricontour errorbar clabel set_aspect violinplot set_axis_off spines text hatch plt axis plt.bar() plt.axis import figure pyplot highlight_text pypalettes plt.subplots() xlabel ylabel title legend colorbar savefig tight_layout grid set_xlim set_ylim plot scatter hist boxplot imshow cmap alpha bins tick_params annotate quiver contour barh stackplot subplots_adjust axhline axvline semilogx semilogy loglog polar streamplot hexbin pcolor tricontour errorbar clabel set_aspect violinplot set_axis_off spines text hatch plt axis plt.bar() plt.axis import figure pyplot highlight_text pypalettes plt.subplots() xlabel ylabel title legend colorbar savefig tight_layout grid set_xlim set_ylim plot scatter hist boxplot imshow cmap alpha bins tick_params annotate quiver contour barh stackplot subplots_adjust axhline axvline semilogx semilogy loglog polar streamplot hexbin pcolor tricontour errorbar clabel set_aspect violinplot set_axis_off spines text hatch plt axis plt.bar() plt.axis import figure pyplot highlight_text pypalettes plt.subplots() xlabel ylabel title legend colorbar savefig tight_layout grid set_xlim set_ylim plot scatter hist boxplot imshow cmap alpha bins tick_params annotate quiver contour barh stackplot subplots_adjust axhline axvline semilogx semilogy loglog polar streamplot hexbin pcolor tricontour errorbar clabel set_aspect violinplot set_axis_off spines text hatch plt axis plt.bar() plt.axis import figure pyplot highlight_text pypalettes plt.subplots() xlabel ylabel title legend colorbar savefig tight_layout grid set_xlim set_ylim plot scatter hist boxplot imshow cmap alpha bins tick_params annotate quiver contour barh stackplot subplots_adjust axhline axvline semilogx semilogy loglog polar streamplot hexbin pcolor tricontour errorbar clabel set_aspect violinplot set_axis_off spines text hatch plt axis plt.bar() plt.axis import figure pyplot highlight_text pypalettes plt.subplots() xlabel ylabel title legend colorbar savefig tight_layout grid set_xlim set_ylim plot scatter hist boxplot imshow cmap alpha bins tick_params annotate quiver contour barh stackplot subplots_adjust axhline axvline semilogx semilogy loglog polar streamplot hexbin pcolor tricontour errorbar clabel set_aspect violinplot set_axis_off spines text hatch plt axis plt.bar() plt.axis import figure pyplot highlight_text pypalettes plt.subplots() xlabel ylabel title legend colorbar savefig tight_layout grid set_xlim set_ylim plot scatter hist boxplot imshow cmap alpha bins tick_params annotate quiver contour barh stackplot subplots_adjust axhline axvline semilogx semilogy loglog polar streamplot hexbin pcolor tricontour errorbar clabel set_aspect violinplot set_axis_off spines text hatch plt axis plt.bar() plt.axis import figure pyplot highlight_text pypalettes plt.subplots() xlabel ylabel title legend colorbar savefig tight_layout grid set_xlim set_ylim plot scatter hist boxplot imshow cmap alpha bins tick_params annotate quiver contour barh stackplot subplots_adjust axhline axvline semilogx semilogy loglog polar streamplot hexbin pcolor tricontour errorbar clabel set_aspect violinplot set_axis_off spines text hatch plt axis plt.bar() plt.axis import figure pyplot highlight_text pypalettes plt.subplots() xlabel ylabel title legend colorbar savefig tight_layout grid set_xlim set_ylim plot scatter hist boxplot imshow cmap alpha bins tick_params annotate quiver contour barh stackplot subplots_adjust axhline axvline semilogx semilogy loglog polar streamplot hexbin pcolor tricontour errorbar clabel set_aspect violinplot set_axis_off spines text hatch plt axis plt.bar() plt.axis import figure pyplot highlight_text pypalettes plt.subplots() xlabel ylabel title legend colorbar savefig tight_layout grid set_xlim set_ylim plot scatter hist boxplot imshow cmap alpha bins tick_params annotate quiver contour barh stackplot subplots_adjust axhline axvline semilogx semilogy loglog polar streamplot hexbin pcolor tricontour errorbar clabel set_aspect violinplot set_axis_off spines text hatch plt axis plt.bar() plt.axis import figure pyplot highlight_text pypalettes plt.subplots() xlabel ylabel title legend colorbar savefig tight_layout grid set_xlim set_ylim plot scatter hist boxplot imshow cmap alpha bins tick_params annotate quiver contour barh stackplot subplots_adjust axhline axvline semilogx semilogy loglog polar streamplot hexbin pcolor tricontour errorbar clabel set_aspect violinplot set_axis_off spines text hatch plt axis plt.bar() plt.axis import figure pyplot highlight_text pypalettes plt.subplots() xlabel ylabel title legend colorbar savefig tight_layout grid set_xlim set_ylim plot scatter hist boxplot imshow cmap alpha bins tick_params annotate quiver contour barh stackplot subplots_adjust axhline axvline semilogx semilogy loglog polar streamplot hexbin pcolor tricontour errorbar clabel set_aspect violinplot set_axis_off spines text hatch plt axis plt.bar() plt.axis import figure pyplot highlight_text pypalettes plt.subplots() xlabel ylabel title legend colorbar savefig tight_layout grid set_xlim set_ylim plot scatter hist boxplot imshow cmap alpha bins tick_params annotate quiver contour barh stackplot subplots_adjust axhline axvline semilogx semilogy loglog polar streamplot hexbin pcolor tricontour errorbar clabel set_aspect violinplot set_axis_off spines text hatch plt axis plt.bar() plt.axis import figure pyplot highlight_text pypalettes plt.subplots() xlabel ylabel title legend colorbar savefig tight_layout grid set_xlim set_ylim plot scatter hist boxplot imshow cmap alpha bins tick_params annotate quiver contour barh stackplot subplots_adjust axhline axvline semilogx semilogy loglog polar streamplot hexbin pcolor tricontour errorbar clabel set_aspect violinplot set_axis_off spines text hatch plt axis plt.bar() plt.axis import figure pyplot highlight_text pypalettes plt.subplots() xlabel ylabel title legend colorbar savefig tight_layout grid set_xlim set_ylim plot scatter hist boxplot imshow cmap alpha bins tick_params annotate quiver contour barh stackplot subplots_adjust axhline axvline semilogx semilogy loglog polar streamplot hexbin pcolor tricontour errorbar clabel set_aspect violinplot set_axis_off spines text hatch plt axis plt.bar() plt.axis import figure pyplot highlight_text pypalettes plt.subplots() xlabel ylabel title legend colorbar savefig tight_layout grid set_xlim set_ylim plot scatter hist boxplot imshow cmap alpha bins tick_params annotate quiver contour barh stackplot subplots_adjust axhline axvline semilogx semilogy loglog polar streamplot hexbin pcolor tricontour errorbar clabel set_aspect violinplot set_axis_off spines text hatch plt axis plt.bar() plt.axis import figure pyplot highlight_text pypalettes plt.subplots() xlabel ylabel title legend colorbar savefig tight_layout grid set_xlim set_ylim plot scatter hist boxplot imshow cmap alpha bins tick_params annotate quiver contour barh stackplot subplots_adjust axhline axvline semilogx semilogy loglog polar streamplot hexbin pcolor tricontour errorbar clabel set_aspect violinplot set_axis_off spines text hatch plt axis plt.bar() plt.axis import figure pyplot highlight_text pypalettes plt.subplots() xlabel ylabel title legend colorbar savefig tight_layout grid set_xlim set_ylim plot scatter hist boxplot imshow cmap alpha bins tick_params annotate quiver contour barh stackplot subplots_adjust axhline axvline semilogx semilogy loglog polar streamplot hexbin pcolor tricontour errorbar clabel set_aspect violinplot set_axis_off spines text hatch plt axis plt.bar() plt.axis import figure pyplot highlight_text pypalettes plt.subplots() xlabel ylabel title legend colorbar savefig tight_layout grid set_xlim set_ylim plot scatter hist boxplot imshow cmap alpha bins tick_params annotate quiver contour barh stackplot subplots_adjust axhline axvline semilogx semilogy loglog polar streamplot hexbin pcolor tricontour errorbar clabel set_aspect violinplot set_axis_off spines text hatch plt axis plt.bar() plt.axis import figure pyplot highlight_text pypalettes plt.subplots() xlabel ylabel title legend colorbar savefig tight_layout grid set_xlim set_ylim plot scatter hist boxplot imshow cmap alpha bins tick_params annotate quiver contour barh stackplot subplots_adjust axhline axvline semilogx semilogy loglog polar streamplot hexbin pcolor tricontour errorbar clabel set_aspect violinplot set_axis_off spines text hatch plt axis plt.bar() plt.axis import figure pyplot highlight_text pypalettes plt.subplots() xlabel ylabel title legend colorbar savefig tight_layout grid set_xlim set_ylim plot scatter hist boxplot imshow cmap alpha bins tick_params annotate quiver contour barh stackplot subplots_adjust axhline axvline semilogx semilogy loglog polar streamplot hexbin pcolor tricontour errorbar clabel set_aspect violinplot set_axis_off spines text hatch plt axis plt.bar() plt.axis import figure pyplot highlight_text pypalettes plt.subplots() xlabel ylabel title legend colorbar savefig tight_layout grid set_xlim set_ylim plot scatter hist boxplot imshow cmap alpha bins tick_params annotate quiver contour barh stackplot subplots_adjust axhline axvline semilogx semilogy loglog polar streamplot hexbin pcolor tricontour errorbar clabel set_aspect violinplot set_axis_off spines text hatch plt axis plt.bar() plt.axis import figure pyplot highlight_text pypalettes plt.subplots() xlabel ylabel title legend colorbar savefig tight_layout grid set_xlim set_ylim plot scatter hist boxplot imshow cmap alpha bins tick_params annotate quiver contour barh stackplot subplots_adjust axhline axvline semilogx semilogy loglog polar streamplot hexbin pcolor tricontour errorbar clabel set_aspect violinplot set_axis_off spines text hatch plt axis plt.bar() plt.axis import figure pyplot highlight_text pypalettes plt.subplots() xlabel ylabel title legend colorbar savefig tight_layout grid set_xlim set_ylim plot scatter hist boxplot imshow cmap alpha bins tick_params annotate quiver contour barh stackplot subplots_adjust axhline axvline semilogx semilogy loglog polar streamplot hexbin pcolor tricontour errorbar clabel set_aspect violinplot set_axis_off spines text hatch plt axis plt.bar() plt.axis import figure pyplot highlight_text pypalettes plt.subplots() xlabel ylabel title legend colorbar savefig tight_layout grid set_xlim set_ylim plot scatter hist boxplot imshow cmap alpha bins tick_params annotate quiver contour barh stackplot subplots_adjust axhline axvline semilogx semilogy loglog polar streamplot hexbin pcolor tricontour errorbar clabel set_aspect violinplot set_axis_off spines text hatch plt axis plt.bar() plt.axis import figure pyplot highlight_text pypalettes plt.subplots() xlabel ylabel title legend colorbar savefig tight_layout grid set_xlim set_ylim plot scatter hist boxplot imshow cmap alpha bins tick_params annotate quiver contour barh stackplot subplots_adjust axhline axvline semilogx semilogy loglog polar streamplot hexbin pcolor tricontour errorbar clabel set_aspect violinplot set_axis_off spines text hatch plt axis plt.bar() plt.axis import figure pyplot highlight_text pypalettes plt.subplots() xlabel ylabel title legend colorbar savefig tight_layout grid set_xlim set_ylim plot scatter hist boxplot imshow cmap alpha bins tick_params annotate quiver contour barh stackplot subplots_adjust axhline axvline semilogx semilogy loglog polar streamplot hexbin pcolor tricontour errorbar clabel set_aspect violinplot set_axis_off spines text hatch plt axis plt.bar() plt.axis import figure pyplot highlight_text pypalettes plt.subplots() xlabel ylabel title legend colorbar savefig tight_layout grid set_xlim set_ylim plot scatter hist boxplot imshow cmap alpha bins tick_params annotate quiver contour barh stackplot subplots_adjust axhline axvline semilogx semilogy loglog polar streamplot hexbin pcolor tricontour errorbar clabel set_aspect violinplot set_axis_off spines text hatch plt axis plt.bar() plt.axis import figure pyplot highlight_text pypalettes plt.subplots() xlabel ylabel title legend colorbar savefig tight_layout grid set_xlim set_ylim plot scatter hist boxplot imshow cmap alpha bins tick_params annotate quiver contour barh stackplot subplots_adjust axhline axvline semilogx semilogy loglog polar streamplot hexbin pcolor tricontour errorbar clabel set_aspect violinplot set_axis_off spines text hatch plt axis plt.bar() plt.axis import figure pyplot highlight_text pypalettes plt.subplots() xlabel ylabel title legend colorbar savefig tight_layout grid set_xlim set_ylim plot scatter hist boxplot imshow cmap alpha bins tick_params annotate quiver contour barh stackplot subplots_adjust axhline axvline semilogx semilogy loglog polar streamplot hexbin pcolor tricontour errorbar clabel set_aspect violinplot set_axis_off spines text hatch plt axis plt.bar() plt.axis import figure pyplot highlight_text pypalettes plt.subplots() xlabel ylabel title legend colorbar savefig tight_layout grid set_xlim set_ylim plot scatter hist boxplot imshow cmap alpha bins tick_params annotate quiver contour barh stackplot subplots_adjust axhline axvline semilogx semilogy loglog polar streamplot hexbin pcolor tricontour errorbar clabel set_aspect violinplot set_axis_off spines text hatch plt axis plt.bar() plt.axis import figure pyplot highlight_text pypalettes plt.subplots() xlabel ylabel title legend colorbar savefig tight_layout grid set_xlim set_ylim plot scatter hist boxplot imshow cmap alpha bins tick_params annotate quiver contour barh stackplot subplots_adjust axhline axvline semilogx semilogy loglog polar streamplot hexbin pcolor tricontour errorbar clabel set_aspect violinplot set_axis_off spines text hatch plt axis plt.bar() plt.axis import figure pyplot highlight_text pypalettes plt.subplots() xlabel ylabel title legend colorbar savefig tight_layout grid set_xlim set_ylim plot scatter hist boxplot imshow cmap alpha bins tick_params annotate quiver contour barh stackplot subplots_adjust axhline axvline semilogx semilogy loglog polar streamplot hexbin pcolor tricontour errorbar clabel set_aspect violinplot set_axis_off spines text hatch plt axis plt.bar() plt.axis import figure pyplot highlight_text pypalettes plt.subplots() xlabel ylabel title legend colorbar savefig tight_layout grid set_xlim set_ylim plot scatter hist boxplot imshow cmap alpha bins tick_params annotate quiver contour barh stackplot subplots_adjust axhline axvline semilogx semilogy loglog polar streamplot hexbin pcolor tricontour errorbar clabel set_aspect violinplot set_axis_off spines text hatch plt axis plt.bar() plt.axis import figure pyplot highlight_text pypalettes plt.subplots() xlabel ylabel title legend colorbar savefig tight_layout grid set_xlim set_ylim plot scatter hist boxplot imshow cmap alpha bins tick_params annotate quiver contour barh stackplot subplots_adjust axhline axvline semilogx semilogy loglog polar streamplot hexbin pcolor tricontour errorbar clabel set_aspect violinplot set_axis_off spines text hatch plt axis plt.bar() plt.axis import figure pyplot highlight_text pypalettes plt.subplots() xlabel ylabel title legend colorbar savefig tight_layout grid set_xlim set_ylim plot scatter hist boxplot imshow cmap alpha bins tick_params annotate quiver contour barh stackplot subplots_adjust axhline axvline semilogx semilogy loglog polar streamplot hexbin pcolor tricontour errorbar clabel set_aspect violinplot set_axis_off spines text hatch plt axis plt.bar() plt.axis import figure pyplot highlight_text pypalettes plt.subplots() xlabel ylabel title legend colorbar savefig tight_layout grid set_xlim set_ylim plot scatter hist boxplot imshow cmap alpha bins tick_params annotate quiver contour barh stackplot subplots_adjust axhline axvline semilogx semilogy loglog polar streamplot hexbin pcolor tricontour errorbar clabel set_aspect violinplot set_axis_off spines text hatch plt axis plt.bar() plt.axis import figure pyplot highlight_text pypalettes plt.subplots() xlabel ylabel title legend colorbar savefig tight_layout grid set_xlim set_ylim plot scatter hist boxplot imshow cmap alpha bins tick_params annotate quiver contour barh stackplot subplots_adjust axhline axvline semilogx semilogy loglog polar streamplot hexbin pcolor tricontour errorbar clabel set_aspect violinplot set_axis_off spines text hatch plt axis plt.bar() plt.axis import figure pyplot highlight_text pypalettes plt.subplots() xlabel ylabel title legend colorbar savefig tight_layout grid set_xlim set_ylim plot scatter hist boxplot imshow cmap alpha bins tick_params annotate quiver contour barh stackplot subplots_adjust axhline axvline semilogx semilogy loglog polar streamplot hexbin pcolor tricontour errorbar clabel set_aspect violinplot set_axis_off spines text hatch plt axis plt.bar() plt.axis import figure pyplot highlight_text pypalettes plt.subplots() xlabel ylabel title legend colorbar savefig tight_layout grid set_xlim set_ylim plot scatter hist boxplot imshow cmap alpha bins tick_params annotate quiver contour barh stackplot subplots_adjust axhline axvline semilogx semilogy loglog polar streamplot hexbin pcolor tricontour errorbar clabel set_aspect violinplot set_axis_off spines text hatch plt axis plt.bar() plt.axis import figure pyplot highlight_text pypalettes plt.subplots() xlabel ylabel title legend colorbar savefig tight_layout grid set_xlim set_ylim plot scatter hist boxplot imshow cmap alpha bins tick_params annotate quiver contour barh stackplot subplots_adjust axhline axvline semilogx semilogy loglog polar streamplot hexbin pcolor tricontour errorbar clabel set_aspect violinplot set_axis_off spines text hatch plt axis plt.bar() plt.axis import figure pyplot highlight_text pypalettes plt.subplots() xlabel ylabel title legend colorbar savefig tight_layout grid set_xlim set_ylim plot scatter hist boxplot imshow cmap alpha bins tick_params annotate quiver contour barh stackplot subplots_adjust axhline axvline semilogx semilogy loglog polar streamplot hexbin pcolor tricontour errorbar clabel set_aspect violinplot set_axis_off spines text hatch plt axis plt.bar() plt.axis import figure pyplot highlight_text pypalettes plt.subplots() xlabel ylabel title legend colorbar savefig tight_layout grid set_xlim set_ylim plot scatter hist boxplot imshow cmap alpha bins tick_params annotate quiver contour barh stackplot subplots_adjust axhline axvline semilogx semilogy loglog polar streamplot hexbin pcolor tricontour errorbar clabel set_aspect violinplot set_axis_off spines text hatch plt axis plt.bar() plt.axis import figure pyplot highlight_text pypalettes plt.subplots() xlabel ylabel title legend colorbar savefig tight_layout grid set_xlim set_ylim plot scatter hist boxplot imshow cmap alpha bins tick_params annotate quiver contour barh stackplot subplots_adjust axhline axvline semilogx semilogy loglog polar streamplot hexbin pcolor tricontour errorbar clabel set_aspect violinplot set_axis_off spines text hatch plt axis plt.bar() plt.axis import figure pyplot highlight_text pypalettes plt.subplots() xlabel ylabel title legend colorbar savefig tight_layout grid set_xlim set_ylim plot scatter hist boxplot imshow cmap alpha bins tick_params annotate quiver contour barh stackplot subplots_adjust axhline axvline semilogx semilogy loglog polar streamplot hexbin pcolor tricontour errorbar clabel set_aspect violinplot set_axis_off spines text hatch plt axis plt.bar() plt.axis import figure pyplot highlight_text pypalettes plt.subplots() xlabel ylabel title legend colorbar savefig tight_layout grid set_xlim set_ylim plot scatter hist boxplot imshow cmap alpha bins tick_params annotate quiver contour barh stackplot subplots_adjust axhline axvline semilogx semilogy loglog polar streamplot hexbin pcolor tricontour errorbar clabel set_aspect violinplot set_axis_off spines text hatch plt axis plt.bar() plt.axis import figure pyplot highlight_text pypalettes plt.subplots() xlabel ylabel title legend colorbar savefig tight_layout grid set_xlim set_ylim plot scatter hist boxplot imshow cmap alpha bins tick_params annotate quiver contour barh stackplot subplots_adjust axhline axvline semilogx semilogy loglog polar streamplot hexbin pcolor tricontour errorbar clabel set_aspect violinplot set_axis_off spines text hatch plt axis plt.bar() plt.axis import figure pyplot highlight_text pypalettes plt.subplots() xlabel ylabel title legend colorbar savefig tight_layout grid set_xlim set_ylim plot scatter hist boxplot imshow cmap alpha bins tick_params annotate quiver contour barh stackplot subplots_adjust axhline axvline semilogx semilogy loglog polar streamplot hexbin pcolor tricontour errorbar clabel set_aspect violinplot set_axis_off spines text hatch plt axis plt.bar() plt.axis import figure pyplot highlight_text pypalettes plt.subplots() xlabel ylabel title legend colorbar savefig tight_layout grid set_xlim set_ylim plot scatter hist boxplot imshow cmap alpha bins tick_params annotate quiver contour barh stackplot subplots_adjust axhline axvline semilogx semilogy loglog polar streamplot hexbin pcolor tricontour errorbar clabel set_aspect violinplot set_axis_off spines text hatch plt axis plt.bar() plt.axis import figure pyplot highlight_text pypalettes plt.subplots() xlabel ylabel title legend colorbar savefig tight_layout grid set_xlim set_ylim plot scatter hist boxplot imshow cmap alpha bins tick_params annotate quiver contour barh stackplot subplots_adjust axhline axvline semilogx semilogy loglog polar streamplot hexbin pcolor tricontour errorbar clabel set_aspect violinplot set_axis_off spines text hatch plt axis plt.bar() plt.axis import figure pyplot highlight_text pypalettes plt.subplots() xlabel ylabel title legend colorbar savefig tight_layout grid set_xlim set_ylim plot scatter hist boxplot imshow cmap alpha bins tick_params annotate quiver contour barh stackplot subplots_adjust axhline axvline semilogx semilogy loglog polar streamplot hexbin pcolor tricontour errorbar clabel set_aspect violinplot set_axis_off spines text hatch plt axis plt.bar() plt.axis import figure pyplot highlight_text pypalettes plt.subplots() xlabel ylabel title legend colorbar savefig tight_layout grid set_xlim set_ylim plot scatter hist boxplot imshow cmap alpha bins tick_params annotate quiver contour barh stackplot subplots_adjust axhline axvline semilogx semilogy loglog polar streamplot hexbin pcolor tricontour errorbar clabel set_aspect violinplot set_axis_off spines text hatch plt axis plt.bar() plt.axis import figure pyplot highlight_text pypalettes plt.subplots() xlabel ylabel title legend colorbar savefig tight_layout grid set_xlim set_ylim plot scatter hist boxplot imshow cmap alpha bins tick_params annotate quiver contour barh stackplot subplots_adjust axhline axvline semilogx semilogy loglog polar streamplot hexbin pcolor tricontour errorbar clabel set_aspect violinplot set_axis_off spines text hatch plt axis plt.bar() plt.axis import figure pyplot highlight_text pypalettes plt.subplots() xlabel ylabel title legend colorbar savefig tight_layout grid set_xlim set_ylim plot scatter hist boxplot imshow cmap alpha bins tick_params annotate quiver contour barh stackplot subplots_adjust axhline axvline semilogx semilogy loglog polar streamplot hexbin pcolor tricontour errorbar clabel set_aspect violinplot set_axis_off spines text hatch plt axis plt.bar() plt.axis import figure pyplot highlight_text pypalettes plt.subplots() xlabel ylabel title legend colorbar savefig tight_layout grid set_xlim set_ylim plot scatter hist boxplot imshow cmap alpha bins tick_params annotate quiver contour barh stackplot subplots_adjust axhline axvline semilogx semilogy loglog polar streamplot hexbin pcolor tricontour errorbar clabel set_aspect violinplot set_axis_off spines text hatch plt axis plt.bar() plt.axis import figure pyplot highlight_text pypalettes plt.subplots() xlabel ylabel title legend colorbar savefig tight_layout grid set_xlim set_ylim plot scatter hist boxplot imshow cmap alpha bins tick_params annotate quiver contour barh stackplot subplots_adjust axhline axvline semilogx semilogy loglog polar streamplot hexbin pcolor tricontour errorbar clabel set_aspect violinplot set_axis_off spines text hatch plt axis plt.bar() plt.axis import figure pyplot highlight_text pypalettes plt.subplots() xlabel ylabel title legend colorbar savefig tight_layout grid set_xlim set_ylim plot scatter hist boxplot imshow cmap alpha bins tick_params annotate quiver contour barh stackplot subplots_adjust axhline axvline semilogx semilogy loglog polar streamplot hexbin pcolor tricontour errorbar clabel set_aspect violinplot set_axis_off spines text hatch plt axis plt.bar() plt.axis import figure pyplot highlight_text pypalettes plt.subplots() xlabel ylabel title legend colorbar savefig tight_layout grid set_xlim set_ylim plot scatter hist boxplot imshow cmap alpha bins tick_params annotate quiver contour barh stackplot subplots_adjust axhline axvline semilogx semilogy loglog polar streamplot hexbin pcolor tricontour errorbar clabel set_aspect violinplot set_axis_off spines text hatch plt axis plt.bar() plt.axis import figure pyplot highlight_text pypalettes plt.subplots() xlabel ylabel title legend colorbar savefig tight_layout grid set_xlim set_ylim plot scatter hist boxplot imshow cmap alpha bins tick_params annotate quiver contour barh stackplot subplots_adjust axhline axvline semilogx semilogy loglog polar streamplot hexbin pcolor tricontour errorbar clabel set_aspect violinplot set_axis_off spines text hatch plt axis plt.bar() plt.axis import figure pyplot highlight_text pypalettes plt.subplots() xlabel ylabel title legend colorbar savefig tight_layout grid set_xlim set_ylim plot scatter hist boxplot imshow cmap alpha bins tick_params annotate quiver contour barh stackplot subplots_adjust axhline axvline semilogx semilogy loglog polar streamplot hexbin pcolor tricontour errorbar clabel set_aspect violinplot set_axis_off spines text hatch plt axis plt.bar() plt.axis import figure pyplot highlight_text pypalettes plt.subplots() xlabel ylabel title legend colorbar savefig tight_layout grid set_xlim set_ylim plot scatter hist boxplot imshow cmap alpha bins tick_params annotate quiver contour barh stackplot subplots_adjust axhline axvline semilogx semilogy loglog polar streamplot hexbin pcolor tricontour errorbar clabel set_aspect violinplot set_axis_off spines text hatch plt axis plt.bar() plt.axis import figure pyplot highlight_text pypalettes plt.subplots() xlabel ylabel title legend colorbar savefig tight_layout grid set_xlim set_ylim plot scatter hist boxplot imshow cmap alpha bins tick_params annotate quiver contour barh stackplot subplots_adjust axhline axvline semilogx semilogy loglog polar streamplot hexbin pcolor tricontour errorbar clabel set_aspect violinplot set_axis_off spines text hatch plt axis plt.bar() plt.axis import figure pyplot highlight_text pypalettes plt.subplots() xlabel ylabel title legend colorbar savefig tight_layout grid set_xlim set_ylim plot scatter hist boxplot imshow cmap alpha bins tick_params annotate quiver contour barh stackplot subplots_adjust axhline axvline semilogx semilogy loglog polar streamplot hexbin pcolor tricontour errorbar clabel set_aspect violinplot set_axis_off spines text hatch plt axis plt.bar() plt.axis import figure pyplot highlight_text pypalettes plt.subplots() xlabel ylabel title legend colorbar savefig tight_layout grid set_xlim set_ylim plot scatter hist boxplot imshow cmap alpha bins tick_params annotate quiver contour barh stackplot subplots_adjust axhline axvline semilogx semilogy loglog polar streamplot hexbin pcolor tricontour errorbar clabel set_aspect violinplot set_axis_off spines text hatch plt axis plt.bar() plt.axis import figure pyplot highlight_text pypalettes plt.subplots() xlabel ylabel title legend colorbar savefig tight_layout grid set_xlim set_ylim plot scatter hist boxplot imshow cmap alpha bins tick_params annotate quiver contour barh stackplot subplots_adjust axhline axvline semilogx semilogy loglog polar streamplot hexbin pcolor tricontour errorbar clabel set_aspect violinplot set_axis_off spines text hatch plt axis plt.bar() plt.axis import figure pyplot highlight_text pypalettes plt.subplots() xlabel ylabel title legend colorbar savefig tight_layout grid set_xlim set_ylim plot scatter hist boxplot imshow cmap alpha bins tick_params annotate quiver contour barh stackplot subplots_adjust axhline axvline semilogx semilogy loglog polar streamplot hexbin pcolor tricontour errorbar clabel set_aspect violinplot set_axis_off spines text hatch plt axis plt.bar() plt.axis import figure pyplot highlight_text pypalettes plt.subplots() xlabel ylabel title legend colorbar savefig tight_layout grid set_xlim set_ylim plot scatter hist boxplot imshow cmap alpha bins tick_params annotate quiver contour barh stackplot subplots_adjust axhline axvline semilogx semilogy loglog polar streamplot hexbin pcolor tricontour errorbar clabel set_aspect violinplot set_axis_off spines text hatch plt axis plt.bar() plt.axis import figure pyplot highlight_text pypalettes plt.subplots() xlabel ylabel title legend colorbar savefig tight_layout grid set_xlim set_ylim plot scatter hist boxplot imshow cmap alpha bins tick_params annotate quiver contour barh stackplot subplots_adjust axhline axvline semilogx semilogy loglog polar streamplot hexbin pcolor tricontour errorbar clabel set_aspect violinplot set_axis_off spines text hatch plt axis plt.bar() plt.axis import figure pyplot highlight_text pypalettes plt.subplots() xlabel ylabel title legend colorbar savefig tight_layout grid set_xlim set_ylim plot scatter hist boxplot imshow cmap alpha bins tick_params annotate quiver contour barh stackplot subplots_adjust axhline axvline semilogx semilogy loglog polar streamplot hexbin pcolor tricontour errorbar clabel set_aspect violinplot set_axis_off spines text hatch plt axis plt.bar() plt.axis import figure pyplot highlight_text pypalettes plt.subplots() xlabel ylabel title legend colorbar savefig tight_layout grid set_xlim set_ylim plot scatter hist boxplot imshow cmap alpha bins tick_params annotate quiver contour barh stackplot subplots_adjust axhline axvline semilogx semilogy loglog polar streamplot hexbin pcolor tricontour errorbar clabel set_aspect violinplot set_axis_off spines text hatch plt axis plt.bar() plt.axis import figure pyplot highlight_text pypalettes plt.subplots() xlabel ylabel title legend colorbar savefig tight_layout grid set_xlim set_ylim plot scatter hist boxplot imshow cmap alpha bins tick_params annotate quiver contour barh stackplot subplots_adjust axhline axvline semilogx semilogy loglog polar streamplot hexbin pcolor tricontour errorbar clabel set_aspect violinplot set_axis_off spines text hatch plt axis plt.bar() plt.axis import figure pyplot highlight_text pypalettes plt.subplots() xlabel ylabel title legend colorbar savefig tight_layout grid set_xlim set_ylim plot scatter hist boxplot imshow cmap alpha bins tick_params annotate quiver contour barh stackplot subplots_adjust axhline axvline semilogx semilogy loglog polar streamplot hexbin pcolor tricontour errorbar clabel set_aspect violinplot set_axis_off spines text hatch plt axis plt.bar() plt.axis import figure pyplot highlight_text pypalettes plt.subplots() xlabel ylabel title legend colorbar savefig tight_layout grid set_xlim set_ylim plot scatter hist boxplot imshow cmap alpha bins tick_params annotate quiver contour barh stackplot subplots_adjust axhline axvline semilogx semilogy loglog polar streamplot hexbin pcolor tricontour errorbar clabel set_aspect violinplot set_axis_off spines text hatch plt axis plt.bar() plt.axis import figure pyplot highlight_text pypalettes plt.subplots() xlabel ylabel title legend colorbar savefig tight_layout grid set_xlim set_ylim plot scatter hist boxplot imshow cmap alpha bins tick_params annotate quiver contour barh stackplot subplots_adjust axhline axvline semilogx semilogy loglog polar streamplot hexbin pcolor tricontour errorbar clabel set_aspect violinplot set_axis_off spines text hatch plt axis plt.bar() plt.axis import figure pyplot highlight_text pypalettes plt.subplots() xlabel ylabel title legend colorbar savefig tight_layout grid set_xlim set_ylim plot scatter hist boxplot imshow cmap alpha bins tick_params annotate quiver contour barh stackplot subplots_adjust axhline axvline semilogx semilogy loglog polar streamplot hexbin pcolor tricontour errorbar clabel set_aspect violinplot set_axis_off spines text hatch plt axis plt.bar() plt.axis import figure pyplot highlight_text pypalettes plt.subplots() xlabel ylabel title legend colorbar savefig tight_layout grid set_xlim set_ylim plot scatter hist boxplot imshow cmap alpha bins tick_params annotate quiver contour barh stackplot subplots_adjust axhline axvline semilogx semilogy loglog polar streamplot hexbin pcolor tricontour errorbar clabel set_aspect violinplot set_axis_off spines text hatch plt axis plt.bar() plt.axis import figure pyplot highlight_text pypalettes plt.subplots() xlabel ylabel title legend colorbar savefig tight_layout grid set_xlim set_ylim plot scatter hist boxplot imshow cmap alpha bins tick_params annotate quiver contour barh stackplot subplots_adjust axhline axvline semilogx semilogy loglog polar streamplot hexbin pcolor tricontour errorbar clabel set_aspect violinplot set_axis_off spines text hatch plt axis plt.bar() plt.axis import figure pyplot highlight_text pypalettes plt.subplots() xlabel ylabel title legend colorbar savefig tight_layout grid set_xlim set_ylim plot scatter hist boxplot imshow cmap alpha bins tick_params annotate quiver contour barh stackplot subplots_adjust axhline axvline semilogx semilogy loglog polar streamplot hexbin pcolor tricontour errorbar clabel set_aspect violinplot set_axis_off spines text hatch plt axis plt.bar() plt.axis import figure pyplot highlight_text pypalettes plt.subplots() xlabel ylabel title legend colorbar savefig tight_layout grid set_xlim set_ylim plot scatter hist boxplot imshow cmap alpha bins tick_params annotate quiver contour barh stackplot subplots_adjust axhline axvline semilogx semilogy loglog polar streamplot hexbin pcolor tricontour errorbar clabel set_aspect violinplot set_axis_off spines text hatch plt axis plt.bar() plt.axis import figure pyplot highlight_text pypalettes plt.subplots() xlabel ylabel title legend colorbar savefig tight_layout grid set_xlim set_ylim plot scatter hist boxplot imshow cmap alpha bins tick_params annotate quiver contour barh stackplot subplots_adjust axhline axvline semilogx semilogy loglog polar streamplot hexbin pcolor tricontour errorbar clabel set_aspect violinplot set_axis_off spines text hatch plt axis plt.bar() plt.axis import figure pyplot highlight_text pypalettes plt.subplots() xlabel ylabel title legend colorbar savefig tight_layout grid set_xlim set_ylim plot scatter hist boxplot imshow cmap alpha bins tick_params annotate quiver contour barh stackplot subplots_adjust axhline axvline semilogx semilogy loglog polar streamplot hexbin pcolor tricontour errorbar clabel set_aspect violinplot set_axis_off spines text hatch plt axis plt.bar() plt.axis import figure pyplot highlight_text pypalettes plt.subplots() xlabel ylabel title legend colorbar savefig tight_layout grid set_xlim set_ylim plot scatter hist boxplot imshow cmap alpha bins tick_params annotate quiver contour barh stackplot subplots_adjust axhline axvline semilogx semilogy loglog polar streamplot hexbin pcolor tricontour errorbar clabel set_aspect violinplot set_axis_off spines text hatch plt axis plt.bar() plt.axis import figure pyplot highlight_text pypalettes plt.subplots() xlabel ylabel title legend colorbar savefig tight_layout grid set_xlim set_ylim plot scatter hist boxplot imshow cmap alpha bins tick_params annotate quiver contour barh stackplot subplots_adjust axhline axvline semilogx semilogy loglog polar streamplot hexbin pcolor tricontour errorbar clabel set_aspect violinplot set_axis_off spines text hatch plt axis plt.bar() plt.axis import figure pyplot highlight_text pypalettes plt.subplots() xlabel ylabel title legend colorbar savefig tight_layout grid set_xlim set_ylim plot scatter hist boxplot imshow cmap alpha bins tick_params annotate quiver contour barh stackplot subplots_adjust axhline axvline semilogx semilogy loglog polar streamplot hexbin pcolor tricontour errorbar clabel set_aspect violinplot set_axis_off spines text hatch plt axis plt.bar() plt.axis import figure pyplot highlight_text pypalettes plt.subplots() xlabel ylabel title legend colorbar savefig tight_layout grid set_xlim set_ylim plot scatter hist boxplot imshow cmap alpha bins tick_params annotate quiver contour barh stackplot subplots_adjust axhline axvline semilogx semilogy loglog polar streamplot hexbin pcolor tricontour errorbar clabel set_aspect violinplot set_axis_off spines text hatch plt axis plt.bar() plt.axis import figure pyplot highlight_text pypalettes plt.subplots() xlabel ylabel title legend colorbar savefig tight_layout grid set_xlim set_ylim plot scatter hist boxplot imshow cmap alpha bins tick_params annotate quiver contour barh stackplot subplots_adjust axhline axvline semilogx semilogy loglog polar streamplot hexbin pcolor tricontour errorbar clabel set_aspect violinplot set_axis_off spines text hatch plt axis plt.bar() plt.axis import figure pyplot highlight_text pypalettes plt.subplots() xlabel ylabel title legend colorbar savefig tight_layout grid set_xlim set_ylim plot scatter hist boxplot imshow cmap alpha bins tick_params annotate quiver contour barh stackplot subplots_adjust axhline axvline semilogx semilogy loglog polar streamplot hexbin pcolor tricontour errorbar clabel set_aspect violinplot set_axis_off spines text hatch plt axis plt.bar() plt.axis import figure pyplot highlight_text pypalettes plt.subplots() xlabel ylabel title legend colorbar savefig tight_layout grid set_xlim set_ylim plot scatter hist boxplot imshow cmap alpha bins tick_params annotate quiver contour barh stackplot subplots_adjust axhline axvline semilogx semilogy loglog polar streamplot hexbin pcolor tricontour errorbar clabel set_aspect violinplot set_axis_off spines text hatch plt axis plt.bar() plt.axis import figure pyplot highlight_text pypalettes plt.subplots() xlabel ylabel title legend colorbar savefig tight_layout grid set_xlim set_ylim plot scatter hist boxplot imshow cmap alpha bins tick_params annotate quiver contour barh stackplot subplots_adjust axhline axvline semilogx semilogy loglog polar streamplot hexbin pcolor tricontour errorbar clabel set_aspect violinplot set_axis_off spines text hatch plt axis plt.bar() plt.axis import figure pyplot highlight_text pypalettes plt.subplots() xlabel ylabel title legend colorbar savefig tight_layout grid set_xlim set_ylim plot scatter hist boxplot imshow cmap alpha bins tick_params annotate quiver contour barh stackplot subplots_adjust axhline axvline semilogx semilogy loglog polar streamplot hexbin pcolor tricontour errorbar clabel set_aspect violinplot set_axis_off spines text hatch plt axis plt.bar() plt.axis import figure pyplot highlight_text pypalettes plt.subplots() xlabel ylabel title legend colorbar savefig tight_layout grid set_xlim set_ylim plot scatter hist boxplot imshow cmap alpha bins tick_params annotate quiver contour barh stackplot subplots_adjust axhline axvline semilogx semilogy loglog polar streamplot hexbin pcolor tricontour errorbar clabel set_aspect violinplot set_axis_off spines text hatch plt axis plt.bar() plt.axis import figure pyplot highlight_text pypalettes plt.subplots() xlabel ylabel title legend colorbar savefig tight_layout grid set_xlim set_ylim plot scatter hist boxplot imshow cmap alpha bins tick_params annotate quiver contour barh stackplot subplots_adjust axhline axvline semilogx semilogy loglog polar streamplot hexbin pcolor tricontour errorbar clabel set_aspect violinplot set_axis_off spines text hatch plt axis plt.bar() plt.axis import figure pyplot highlight_text pypalettes plt.subplots() xlabel ylabel title legend colorbar savefig tight_layout grid set_xlim set_ylim plot scatter hist boxplot imshow cmap alpha bins tick_params annotate quiver contour barh stackplot subplots_adjust axhline axvline semilogx semilogy loglog polar streamplot hexbin pcolor tricontour errorbar clabel set_aspect violinplot set_axis_off spines text hatch plt axis plt.bar() plt.axis import figure pyplot highlight_text pypalettes plt.subplots() xlabel ylabel title legend colorbar savefig tight_layout grid set_xlim set_ylim plot scatter hist boxplot imshow cmap alpha bins tick_params annotate quiver contour barh stackplot subplots_adjust axhline axvline semilogx semilogy loglog polar streamplot hexbin pcolor tricontour errorbar clabel set_aspect violinplot set_axis_off spines text hatch plt axis plt.bar() plt.axis import figure pyplot highlight_text pypalettes plt.subplots() xlabel ylabel title legend colorbar savefig tight_layout grid set_xlim set_ylim plot scatter hist boxplot imshow cmap alpha bins tick_params annotate quiver contour barh stackplot subplots_adjust axhline axvline semilogx semilogy loglog polar streamplot hexbin pcolor tricontour errorbar clabel set_aspect violinplot set_axis_off spines text hatch plt axis plt.bar() plt.axis import figure pyplot highlight_text pypalettes plt.subplots() xlabel ylabel title legend colorbar savefig tight_layout grid set_xlim set_ylim plot scatter hist boxplot imshow cmap alpha bins tick_params annotate quiver contour barh stackplot subplots_adjust axhline axvline semilogx semilogy loglog polar streamplot hexbin pcolor tricontour errorbar clabel set_aspect violinplot set_axis_off spines text hatch plt axis plt.bar() plt.axis import figure pyplot highlight_text pypalettes plt.subplots() xlabel ylabel title legend colorbar savefig tight_layout grid set_xlim set_ylim plot scatter hist boxplot imshow cmap alpha bins tick_params annotate quiver contour barh stackplot subplots_adjust axhline axvline semilogx semilogy loglog polar streamplot hexbin pcolor tricontour errorbar clabel set_aspect violinplot set_axis_off spines text hatch plt axis plt.bar() plt.axis import figure pyplot highlight_text pypalettes plt.subplots() xlabel ylabel title legend colorbar savefig tight_layout grid set_xlim set_ylim plot scatter hist boxplot imshow cmap alpha bins tick_params annotate quiver contour barh stackplot subplots_adjust axhline axvline semilogx semilogy loglog polar streamplot hexbin pcolor tricontour errorbar clabel set_aspect violinplot set_axis_off spines text hatch plt axis plt.bar() plt.axis import figure pyplot highlight_text pypalettes plt.subplots() xlabel ylabel title legend colorbar savefig tight_layout grid set_xlim set_ylim plot scatter hist boxplot imshow cmap alpha bins tick_params annotate quiver contour barh stackplot subplots_adjust axhline axvline semilogx semilogy loglog polar streamplot hexbin pcolor tricontour errorbar clabel set_aspect violinplot set_axis_off spines text hatch plt axis plt.bar() plt.axis import figure pyplot highlight_text pypalettes plt.subplots() xlabel ylabel title legend colorbar savefig tight_layout grid set_xlim set_ylim plot scatter hist boxplot imshow cmap alpha bins tick_params annotate quiver contour barh stackplot subplots_adjust axhline axvline semilogx semilogy loglog polar streamplot hexbin pcolor tricontour errorbar clabel set_aspect violinplot set_axis_off spines text hatch plt axis plt.bar() plt.axis import figure pyplot highlight_text pypalettes plt.subplots() xlabel ylabel title legend colorbar savefig tight_layout grid set_xlim set_ylim plot scatter hist boxplot imshow cmap alpha bins tick_params annotate quiver contour barh stackplot subplots_adjust axhline axvline semilogx semilogy loglog polar streamplot hexbin pcolor tricontour errorbar clabel set_aspect violinplot set_axis_off spines text hatch plt axis plt.bar() plt.axis import figure pyplot highlight_text pypalettes plt.subplots() xlabel ylabel title legend colorbar savefig tight_layout grid set_xlim set_ylim plot scatter hist boxplot imshow cmap alpha bins tick_params annotate quiver contour barh stackplot subplots_adjust axhline axvline semilogx semilogy loglog polar streamplot hexbin pcolor tricontour errorbar clabel set_aspect violinplot set_axis_off spines text hatch plt axis plt.bar() plt.axis import figure pyplot highlight_text pypalettes plt.subplots() xlabel ylabel title legend colorbar savefig tight_layout grid set_xlim set_ylim plot scatter hist boxplot imshow cmap alpha bins tick_params annotate quiver contour barh stackplot subplots_adjust axhline axvline semilogx semilogy loglog polar streamplot hexbin pcolor tricontour errorbar clabel set_aspect violinplot set_axis_off spines text hatch plt axis plt.bar() plt.axis import figure pyplot highlight_text pypalettes plt.subplots() xlabel ylabel title legend colorbar savefig tight_layout grid set_xlim set_ylim plot scatter hist boxplot imshow cmap alpha bins tick_params annotate quiver contour barh stackplot subplots_adjust axhline axvline semilogx semilogy loglog polar streamplot hexbin pcolor tricontour errorbar clabel set_aspect violinplot set_axis_off spines text hatch plt axis plt.bar() plt.axis import figure pyplot highlight_text pypalettes plt.subplots() xlabel ylabel title legend colorbar savefig tight_layout grid set_xlim set_ylim plot scatter hist boxplot imshow cmap alpha bins tick_params annotate quiver contour barh stackplot subplots_adjust axhline axvline semilogx semilogy loglog polar streamplot hexbin pcolor tricontour errorbar clabel set_aspect violinplot set_axis_off spines text hatch plt axis plt.bar() plt.axis import figure pyplot highlight_text pypalettes plt.subplots() xlabel ylabel title legend colorbar savefig tight_layout grid set_xlim set_ylim plot scatter hist boxplot imshow cmap alpha bins tick_params annotate quiver contour barh stackplot subplots_adjust axhline axvline semilogx semilogy loglog polar streamplot hexbin pcolor tricontour errorbar clabel set_aspect violinplot set_axis_off spines text hatch plt axis plt.bar() plt.axis import figure pyplot highlight_text pypalettes plt.subplots() xlabel ylabel title legend colorbar savefig tight_layout grid set_xlim set_ylim plot scatter hist boxplot imshow cmap alpha bins tick_params annotate quiver contour barh stackplot subplots_adjust axhline axvline semilogx semilogy loglog polar streamplot hexbin pcolor tricontour errorbar clabel set_aspect violinplot set_axis_off spines text hatch plt axis plt.bar() plt.axis import figure pyplot highlight_text pypalettes plt.subplots() xlabel ylabel title legend colorbar savefig tight_layout grid set_xlim set_ylim plot scatter hist boxplot imshow cmap alpha bins tick_params annotate quiver contour barh stackplot subplots_adjust axhline axvline semilogx semilogy loglog polar streamplot hexbin pcolor tricontour errorbar clabel set_aspect violinplot set_axis_off spines text hatch plt axis plt.bar() plt.axis import figure pyplot highlight_text pypalettes plt.subplots() xlabel ylabel title legend colorbar savefig tight_layout grid set_xlim set_ylim plot scatter hist boxplot imshow cmap alpha bins tick_params annotate quiver contour barh stackplot subplots_adjust axhline axvline semilogx semilogy loglog polar streamplot hexbin pcolor tricontour errorbar clabel set_aspect violinplot set_axis_off spines text hatch plt axis plt.bar() plt.axis import figure pyplot highlight_text pypalettes plt.subplots() xlabel ylabel title legend colorbar savefig tight_layout grid set_xlim set_ylim plot scatter hist boxplot imshow cmap alpha bins tick_params annotate quiver contour barh stackplot subplots_adjust axhline axvline semilogx semilogy loglog polar streamplot hexbin pcolor tricontour errorbar clabel set_aspect violinplot set_axis_off spines text hatch plt axis plt.bar() plt.axis import figure pyplot highlight_text pypalettes plt.subplots() xlabel ylabel title legend colorbar savefig tight_layout grid set_xlim set_ylim plot scatter hist boxplot imshow cmap alpha bins tick_params annotate quiver contour barh stackplot subplots_adjust axhline axvline semilogx semilogy loglog polar streamplot hexbin pcolor tricontour errorbar clabel set_aspect violinplot set_axis_off spines text hatch plt axis plt.bar() plt.axis import figure pyplot highlight_text pypalettes plt.subplots() xlabel ylabel title legend colorbar savefig tight_layout grid set_xlim set_ylim plot scatter hist boxplot imshow cmap alpha bins tick_params annotate quiver contour barh stackplot subplots_adjust axhline axvline semilogx semilogy loglog polar streamplot hexbin pcolor tricontour errorbar clabel set_aspect violinplot set_axis_off spines text hatch plt axis plt.bar() plt.axis import figure pyplot highlight_text pypalettes plt.subplots() xlabel ylabel title legend colorbar savefig tight_layout grid set_xlim set_ylim plot scatter hist boxplot imshow cmap alpha bins tick_params annotate quiver contour barh stackplot subplots_adjust axhline axvline semilogx semilogy loglog polar streamplot hexbin pcolor tricontour errorbar clabel set_aspect violinplot set_axis_off spines text hatch plt axis plt.bar() plt.axis import figure pyplot highlight_text pypalettes plt.subplots() xlabel ylabel title legend colorbar savefig tight_layout grid set_xlim set_ylim plot scatter hist boxplot imshow cmap alpha bins tick_params annotate quiver contour barh stackplot subplots_adjust axhline axvline semilogx semilogy loglog polar streamplot hexbin pcolor tricontour errorbar clabel set_aspect violinplot set_axis_off spines text hatch plt axis plt.bar() plt.axis import figure pyplot highlight_text pypalettes plt.subplots() xlabel ylabel title legend colorbar savefig tight_layout grid set_xlim set_ylim plot scatter hist boxplot imshow cmap alpha bins tick_params annotate quiver contour barh stackplot subplots_adjust axhline axvline semilogx semilogy loglog polar streamplot hexbin pcolor tricontour errorbar clabel set_aspect violinplot set_axis_off spines text hatch plt axis plt.bar() plt.axis import figure pyplot highlight_text pypalettes plt.subplots() xlabel ylabel title legend colorbar savefig tight_layout grid set_xlim set_ylim plot scatter hist boxplot imshow cmap alpha bins tick_params annotate quiver contour barh stackplot subplots_adjust axhline axvline semilogx semilogy loglog polar streamplot hexbin pcolor tricontour errorbar clabel set_aspect violinplot set_axis_off spines text hatch plt axis plt.bar() plt.axis import figure pyplot highlight_text pypalettes plt.subplots() xlabel ylabel title legend colorbar savefig tight_layout grid set_xlim set_ylim plot scatter hist boxplot imshow cmap alpha bins tick_params annotate quiver contour barh stackplot subplots_adjust axhline axvline semilogx semilogy loglog polar streamplot hexbin pcolor tricontour errorbar clabel set_aspect violinplot set_axis_off spines text hatch plt axis plt.bar() plt.axis import figure pyplot highlight_text pypalettes plt.subplots() xlabel ylabel title legend colorbar savefig tight_layout grid set_xlim set_ylim plot scatter hist boxplot imshow cmap alpha bins tick_params annotate quiver contour barh stackplot subplots_adjust axhline axvline semilogx semilogy loglog polar streamplot hexbin pcolor tricontour errorbar clabel set_aspect violinplot set_axis_off spines text hatch plt axis plt.bar() plt.axis import figure pyplot highlight_text pypalettes plt.subplots() xlabel ylabel title legend colorbar savefig tight_layout grid set_xlim set_ylim plot scatter hist boxplot imshow cmap alpha bins tick_params annotate quiver contour barh stackplot subplots_adjust axhline axvline semilogx semilogy loglog polar streamplot hexbin pcolor tricontour errorbar clabel set_aspect violinplot set_axis_off spines text hatch plt axis plt.bar() plt.axis import figure pyplot highlight_text pypalettes plt.subplots() xlabel ylabel title legend colorbar savefig tight_layout grid set_xlim set_ylim plot scatter hist boxplot imshow cmap alpha bins tick_params annotate quiver contour barh stackplot subplots_adjust axhline axvline semilogx semilogy loglog polar streamplot hexbin pcolor tricontour errorbar clabel set_aspect violinplot set_axis_off spines text hatch plt axis plt.bar() plt.axis import figure pyplot highlight_text pypalettes plt.subplots() xlabel ylabel title legend colorbar savefig tight_layout grid set_xlim set_ylim plot scatter hist boxplot imshow cmap alpha bins tick_params annotate quiver contour barh stackplot subplots_adjust axhline axvline semilogx semilogy loglog polar streamplot hexbin pcolor tricontour errorbar clabel set_aspect violinplot set_axis_off spines text hatch plt axis plt.bar() plt.axis import figure pyplot highlight_text pypalettes plt.subplots() xlabel ylabel title legend colorbar savefig tight_layout grid set_xlim set_ylim plot scatter hist boxplot imshow cmap alpha bins tick_params annotate quiver contour barh stackplot subplots_adjust axhline axvline semilogx semilogy loglog polar streamplot hexbin pcolor tricontour errorbar clabel set_aspect violinplot set_axis_off spines text hatch plt axis plt.bar() plt.axis import figure pyplot highlight_text pypalettes plt.subplots() xlabel ylabel title legend colorbar savefig tight_layout grid set_xlim set_ylim plot scatter hist boxplot imshow cmap alpha bins tick_params annotate quiver contour barh stackplot subplots_adjust axhline axvline semilogx semilogy loglog polar streamplot hexbin pcolor tricontour errorbar clabel set_aspect violinplot set_axis_off spines text hatch plt axis plt.bar() plt.axis import figure pyplot highlight_text pypalettes plt.subplots() xlabel ylabel title legend colorbar savefig tight_layout grid set_xlim set_ylim plot scatter hist boxplot imshow cmap alpha bins tick_params annotate quiver contour barh stackplot subplots_adjust axhline axvline semilogx semilogy loglog polar streamplot hexbin pcolor tricontour errorbar clabel set_aspect violinplot set_axis_off spines text hatch plt axis plt.bar() plt.axis import figure pyplot highlight_text pypalettes plt.subplots() xlabel ylabel title legend colorbar savefig tight_layout grid set_xlim set_ylim plot scatter hist boxplot imshow cmap alpha bins tick_params annotate quiver contour barh stackplot subplots_adjust axhline axvline semilogx semilogy loglog polar streamplot hexbin pcolor tricontour errorbar clabel set_aspect violinplot set_axis_off spines text hatch plt axis plt.bar() plt.axis import figure pyplot highlight_text pypalettes plt.subplots() xlabel ylabel title legend colorbar savefig tight_layout grid set_xlim set_ylim plot scatter hist boxplot imshow cmap alpha bins tick_params annotate quiver contour barh stackplot subplots_adjust axhline axvline semilogx semilogy loglog polar streamplot hexbin pcolor tricontour errorbar clabel set_aspect violinplot set_axis_off spines text hatch plt axis plt.bar() plt.axis import figure pyplot highlight_text pypalettes plt.subplots() xlabel ylabel title legend colorbar savefig tight_layout grid set_xlim set_ylim plot scatter hist boxplot imshow cmap alpha bins tick_params annotate quiver contour barh stackplot subplots_adjust axhline axvline semilogx semilogy loglog polar streamplot hexbin pcolor tricontour errorbar clabel set_aspect violinplot set_axis_off spines text hatch plt axis plt.bar() plt.axis import figure pyplot highlight_text pypalettes plt.subplots() xlabel ylabel title legend colorbar savefig tight_layout grid set_xlim set_ylim plot scatter hist boxplot imshow cmap alpha bins tick_params annotate quiver contour barh stackplot subplots_adjust axhline axvline semilogx semilogy loglog polar streamplot hexbin pcolor tricontour errorbar clabel set_aspect violinplot set_axis_off spines text hatch plt axis plt.bar() plt.axis import figure pyplot highlight_text pypalettes plt.subplots() xlabel ylabel title legend colorbar savefig tight_layout grid set_xlim set_ylim plot scatter hist boxplot imshow cmap alpha bins tick_params annotate quiver contour barh stackplot subplots_adjust axhline axvline semilogx semilogy loglog polar streamplot hexbin pcolor tricontour errorbar clabel set_aspect violinplot set_axis_off spines text hatch plt axis plt.bar() plt.axis import figure pyplot highlight_text pypalettes plt.subplots() xlabel ylabel title legend colorbar savefig tight_layout grid set_xlim set_ylim plot scatter hist boxplot imshow cmap alpha bins tick_params annotate quiver contour barh stackplot subplots_adjust axhline axvline semilogx semilogy loglog polar streamplot hexbin pcolor tricontour errorbar clabel set_aspect violinplot set_axis_off spines text hatch plt axis plt.bar() plt.axis import figure pyplot highlight_text pypalettes plt.subplots() xlabel ylabel title legend colorbar savefig tight_layout grid set_xlim set_ylim plot scatter hist boxplot imshow cmap alpha bins tick_params annotate quiver contour barh stackplot subplots_adjust axhline axvline semilogx semilogy loglog polar streamplot hexbin pcolor tricontour errorbar clabel set_aspect violinplot set_axis_off spines text hatch plt axis plt.bar() plt.axis import figure pyplot highlight_text pypalettes plt.subplots() xlabel ylabel title legend colorbar savefig tight_layout grid set_xlim set_ylim plot scatter hist boxplot imshow cmap alpha bins tick_params annotate quiver contour barh stackplot subplots_adjust axhline axvline semilogx semilogy loglog polar streamplot hexbin pcolor tricontour errorbar clabel set_aspect violinplot set_axis_off spines text hatch plt axis plt.bar() plt.axis import figure pyplot highlight_text pypalettes plt.subplots() xlabel ylabel title legend colorbar savefig tight_layout grid set_xlim set_ylim plot scatter hist boxplot imshow cmap alpha bins tick_params annotate quiver contour barh stackplot subplots_adjust axhline axvline semilogx semilogy loglog polar streamplot hexbin pcolor tricontour errorbar clabel set_aspect violinplot set_axis_off spines text hatch plt axis plt.bar() plt.axis import figure pyplot highlight_text pypalettes plt.subplots() xlabel ylabel title legend colorbar savefig tight_layout grid set_xlim set_ylim plot scatter hist boxplot imshow cmap alpha bins tick_params annotate quiver contour barh stackplot subplots_adjust axhline axvline semilogx semilogy loglog polar streamplot hexbin pcolor tricontour errorbar clabel set_aspect violinplot set_axis_off spines text hatch plt axis plt.bar() plt.axis import figure pyplot highlight_text pypalettes plt.subplots() xlabel ylabel title legend colorbar savefig tight_layout grid set_xlim set_ylim plot scatter hist boxplot imshow cmap alpha bins tick_params annotate quiver contour barh stackplot subplots_adjust axhline axvline semilogx semilogy loglog polar streamplot hexbin pcolor tricontour errorbar clabel set_aspect violinplot set_axis_off spines text hatch plt axis plt.bar() plt.axis import figure pyplot highlight_text pypalettes plt.subplots() xlabel ylabel title legend colorbar savefig tight_layout grid set_xlim set_ylim plot scatter hist boxplot imshow cmap alpha bins tick_params annotate quiver contour barh stackplot subplots_adjust axhline axvline semilogx semilogy loglog polar streamplot hexbin pcolor tricontour errorbar clabel set_aspect violinplot set_axis_off spines text hatch plt axis plt.bar() plt.axis import figure pyplot highlight_text pypalettes plt.subplots() xlabel ylabel title legend colorbar savefig tight_layout grid set_xlim set_ylim plot scatter hist boxplot imshow cmap alpha bins tick_params annotate quiver contour barh stackplot subplots_adjust axhline axvline semilogx semilogy loglog polar streamplot hexbin pcolor tricontour errorbar clabel set_aspect violinplot set_axis_off spines text hatch plt axis plt.bar() plt.axis import figure pyplot highlight_text pypalettes plt.subplots() xlabel ylabel title legend colorbar savefig tight_layout grid set_xlim set_ylim plot scatter hist boxplot imshow cmap alpha bins tick_params annotate quiver contour barh stackplot subplots_adjust axhline axvline semilogx semilogy loglog polar streamplot hexbin pcolor tricontour errorbar clabel set_aspect violinplot set_axis_off spines text hatch plt axis plt.bar() plt.axis import figure pyplot highlight_text pypalettes plt.subplots() xlabel ylabel title legend colorbar savefig tight_layout grid set_xlim set_ylim plot scatter hist boxplot imshow cmap alpha bins tick_params annotate quiver contour barh stackplot subplots_adjust axhline axvline semilogx semilogy loglog polar streamplot hexbin pcolor tricontour errorbar clabel set_aspect violinplot set_axis_off spines text hatch plt axis plt.bar() plt.axis import figure pyplot highlight_text pypalettes plt.subplots() xlabel ylabel title legend colorbar savefig tight_layout grid set_xlim set_ylim plot scatter hist boxplot imshow cmap alpha bins tick_params annotate quiver contour barh stackplot subplots_adjust axhline axvline semilogx semilogy loglog polar streamplot hexbin pcolor tricontour errorbar clabel set_aspect violinplot set_axis_off spines text hatch plt axis plt.bar() plt.axis import figure pyplot highlight_text pypalettes plt.subplots() xlabel ylabel title legend colorbar savefig tight_layout grid set_xlim set_ylim plot scatter hist boxplot imshow cmap alpha bins tick_params annotate quiver contour barh stackplot subplots_adjust axhline axvline semilogx semilogy loglog polar streamplot hexbin pcolor tricontour errorbar clabel set_aspect violinplot set_axis_off spines text hatch plt axis plt.bar() plt.axis import figure pyplot highlight_text pypalettes plt.subplots() xlabel ylabel title legend colorbar savefig tight_layout grid set_xlim set_ylim plot scatter hist boxplot imshow cmap alpha bins tick_params annotate quiver contour barh stackplot subplots_adjust axhline axvline semilogx semilogy loglog polar streamplot hexbin pcolor tricontour errorbar clabel set_aspect violinplot set_axis_off spines text hatch plt axis plt.bar() plt.axis import figure pyplot highlight_text pypalettes plt.subplots() xlabel ylabel title legend colorbar savefig tight_layout grid set_xlim set_ylim plot scatter hist boxplot imshow cmap alpha bins tick_params annotate quiver contour barh stackplot subplots_adjust axhline axvline semilogx semilogy loglog polar streamplot hexbin pcolor tricontour errorbar clabel set_aspect violinplot set_axis_off spines text hatch plt axis plt.bar() plt.axis import figure pyplot highlight_text pypalettes plt.subplots() xlabel ylabel title legend colorbar savefig tight_layout grid set_xlim set_ylim plot scatter hist boxplot imshow cmap alpha bins tick_params annotate quiver contour barh stackplot subplots_adjust axhline axvline semilogx semilogy loglog polar streamplot hexbin pcolor tricontour errorbar clabel set_aspect violinplot set_axis_off spines text hatch plt axis plt.bar() plt.axis import figure pyplot highlight_text pypalettes plt.subplots() xlabel ylabel title legend colorbar savefig tight_layout grid set_xlim set_ylim plot scatter hist boxplot imshow cmap alpha bins tick_params annotate quiver contour barh stackplot subplots_adjust axhline axvline semilogx semilogy loglog polar streamplot hexbin pcolor tricontour errorbar clabel set_aspect violinplot set_axis_off spines text hatch plt axis plt.bar() plt.axis import figure pyplot highlight_text pypalettes plt.subplots() xlabel ylabel title legend colorbar savefig tight_layout grid set_xlim set_ylim plot scatter hist boxplot imshow cmap alpha bins tick_params annotate quiver contour barh stackplot subplots_adjust axhline axvline semilogx semilogy loglog polar streamplot hexbin pcolor tricontour errorbar clabel set_aspect violinplot set_axis_off spines text hatch plt axis plt.bar() plt.axis import figure pyplot highlight_text pypalettes plt.subplots() xlabel ylabel title legend colorbar savefig tight_layout grid set_xlim set_ylim plot scatter hist boxplot imshow cmap alpha bins tick_params annotate quiver contour barh stackplot subplots_adjust axhline axvline semilogx semilogy loglog polar streamplot hexbin pcolor tricontour errorbar clabel set_aspect violinplot set_axis_off spines text hatch plt axis plt.bar() plt.axis import figure pyplot highlight_text pypalettes plt.subplots() xlabel ylabel title legend colorbar savefig tight_layout grid set_xlim set_ylim plot scatter hist boxplot imshow cmap alpha bins tick_params annotate quiver contour barh stackplot subplots_adjust axhline axvline semilogx semilogy loglog polar streamplot hexbin pcolor tricontour errorbar clabel set_aspect violinplot set_axis_off spines text hatch plt axis plt.bar() plt.axis import figure pyplot highlight_text pypalettes plt.subplots() xlabel ylabel title legend colorbar savefig tight_layout grid set_xlim set_ylim plot scatter hist boxplot imshow cmap alpha bins tick_params annotate quiver contour barh stackplot subplots_adjust axhline axvline semilogx semilogy loglog polar streamplot hexbin pcolor tricontour errorbar clabel set_aspect violinplot set_axis_off spines text hatch plt axis plt.bar() plt.axis import figure pyplot highlight_text pypalettes plt.subplots() xlabel ylabel title legend colorbar savefig tight_layout grid set_xlim set_ylim plot scatter hist boxplot imshow cmap alpha bins tick_params annotate quiver contour barh stackplot subplots_adjust axhline axvline semilogx semilogy loglog polar streamplot hexbin pcolor tricontour errorbar clabel set_aspect violinplot set_axis_off spines text hatch plt axis plt.bar() plt.axis import figure pyplot highlight_text pypalettes plt.subplots() xlabel ylabel title legend colorbar savefig tight_layout grid set_xlim set_ylim plot scatter hist boxplot imshow cmap alpha bins tick_params annotate quiver contour barh stackplot subplots_adjust axhline axvline semilogx semilogy loglog polar streamplot hexbin pcolor tricontour errorbar clabel set_aspect violinplot set_axis_off spines text hatch plt axis plt.bar() plt.axis import figure pyplot highlight_text pypalettes plt.subplots() xlabel ylabel title legend colorbar savefig tight_layout grid set_xlim set_ylim plot scatter hist boxplot imshow cmap alpha bins tick_params annotate quiver contour barh stackplot subplots_adjust axhline axvline semilogx semilogy loglog polar streamplot hexbin pcolor tricontour errorbar clabel set_aspect violinplot set_axis_off spines text hatch plt axis plt.bar() plt.axis import figure pyplot highlight_text pypalettes plt.subplots() xlabel ylabel title legend colorbar savefig tight_layout grid set_xlim set_ylim plot scatter hist boxplot imshow cmap alpha bins tick_params annotate quiver contour barh stackplot subplots_adjust axhline axvline semilogx semilogy loglog polar streamplot hexbin pcolor tricontour errorbar clabel set_aspect violinplot set_axis_off spines text hatch plt axis plt.bar() plt.axis import figure pyplot highlight_text pypalettes plt.subplots() xlabel ylabel title legend colorbar savefig tight_layout grid set_xlim set_ylim plot scatter hist boxplot imshow cmap alpha bins tick_params annotate quiver contour barh stackplot subplots_adjust axhline axvline semilogx semilogy loglog polar streamplot hexbin pcolor tricontour errorbar clabel set_aspect violinplot set_axis_off spines text hatch plt axis plt.bar() plt.axis import figure pyplot highlight_text pypalettes plt.subplots() xlabel ylabel title legend colorbar savefig tight_layout grid set_xlim set_ylim plot scatter hist boxplot imshow cmap alpha bins tick_params annotate quiver contour barh stackplot subplots_adjust axhline axvline semilogx semilogy loglog polar streamplot hexbin pcolor tricontour errorbar clabel set_aspect violinplot set_axis_off spines text hatch plt axis plt.bar() plt.axis import figure pyplot highlight_text pypalettes plt.subplots() xlabel ylabel title legend colorbar savefig tight_layout grid set_xlim set_ylim plot scatter hist boxplot imshow cmap alpha bins tick_params annotate quiver contour barh stackplot subplots_adjust axhline axvline semilogx semilogy loglog polar streamplot hexbin pcolor tricontour errorbar clabel set_aspect violinplot set_axis_off spines text hatch plt axis plt.bar() plt.axis import figure pyplot highlight_text pypalettes plt.subplots() xlabel ylabel title legend colorbar savefig tight_layout grid set_xlim set_ylim plot scatter hist boxplot imshow cmap alpha bins tick_params annotate quiver contour barh stackplot subplots_adjust axhline axvline semilogx semilogy loglog polar streamplot hexbin pcolor tricontour errorbar clabel set_aspect violinplot set_axis_off spines text hatch plt axis plt.bar() plt.axis import figure pyplot highlight_text pypalettes plt.subplots() xlabel ylabel title legend colorbar savefig tight_layout grid set_xlim set_ylim plot scatter hist boxplot imshow cmap alpha bins tick_params annotate quiver contour barh stackplot subplots_adjust axhline axvline semilogx semilogy loglog polar streamplot hexbin pcolor tricontour errorbar clabel set_aspect violinplot set_axis_off spines text hatch plt axis plt.bar() plt.axis import figure pyplot highlight_text pypalettes plt.subplots() xlabel ylabel title legend colorbar savefig tight_layout grid set_xlim set_ylim plot scatter hist boxplot imshow cmap alpha bins tick_params annotate quiver contour barh stackplot subplots_adjust axhline axvline semilogx semilogy loglog polar streamplot hexbin pcolor tricontour errorbar clabel set_aspect violinplot set_axis_off spines text hatch plt axis plt.bar() plt.axis import figure pyplot highlight_text pypalettes plt.subplots() xlabel ylabel title legend colorbar savefig tight_layout grid set_xlim set_ylim plot scatter hist boxplot imshow cmap alpha bins tick_params annotate quiver contour barh stackplot subplots_adjust axhline axvline semilogx semilogy loglog polar streamplot hexbin pcolor tricontour errorbar clabel set_aspect violinplot set_axis_off spines text hatch plt axis plt.bar() plt.axis import figure pyplot highlight_text pypalettes plt.subplots() xlabel ylabel title legend colorbar savefig tight_layout grid set_xlim set_ylim plot scatter hist boxplot imshow cmap alpha bins tick_params annotate quiver contour barh stackplot subplots_adjust axhline axvline semilogx semilogy loglog polar streamplot hexbin pcolor tricontour errorbar clabel set_aspect violinplot set_axis_off spines text hatch plt axis plt.bar() plt.axis import figure pyplot highlight_text pypalettes plt.subplots() xlabel ylabel title legend colorbar savefig tight_layout grid set_xlim set_ylim plot scatter hist boxplot imshow cmap alpha bins tick_params annotate quiver contour barh stackplot subplots_adjust axhline axvline semilogx semilogy loglog polar streamplot hexbin pcolor tricontour errorbar clabel set_aspect violinplot set_axis_off spines text hatch plt axis plt.bar() plt.axis import figure pyplot highlight_text pypalettes plt.subplots() xlabel ylabel title legend colorbar savefig tight_layout grid set_xlim set_ylim plot scatter hist boxplot imshow cmap alpha bins tick_params annotate quiver contour barh stackplot subplots_adjust axhline axvline semilogx semilogy loglog polar streamplot hexbin pcolor tricontour errorbar clabel set_aspect violinplot set_axis_off spines text hatch plt axis plt.bar() plt.axis import figure pyplot highlight_text pypalettes plt.subplots() xlabel ylabel title legend colorbar savefig tight_layout grid set_xlim set_ylim plot scatter hist boxplot imshow cmap alpha bins tick_params annotate quiver contour barh stackplot subplots_adjust axhline axvline semilogx semilogy loglog polar streamplot hexbin pcolor tricontour errorbar clabel set_aspect violinplot set_axis_off spines text hatch plt axis plt.bar() plt.axis import figure pyplot highlight_text pypalettes plt.subplots() xlabel ylabel title legend colorbar savefig tight_layout grid set_xlim set_ylim plot scatter hist boxplot imshow cmap alpha bins tick_params annotate quiver contour barh stackplot subplots_adjust axhline axvline semilogx semilogy loglog polar streamplot hexbin pcolor tricontour errorbar clabel set_aspect violinplot set_axis_off spines text hatch plt axis plt.bar() plt.axis import figure pyplot highlight_text pypalettes plt.subplots() xlabel ylabel title legend colorbar savefig tight_layout grid set_xlim set_ylim plot scatter hist boxplot imshow cmap alpha bins tick_params annotate quiver contour barh stackplot subplots_adjust axhline axvline semilogx semilogy loglog polar streamplot hexbin pcolor tricontour errorbar clabel set_aspect violinplot set_axis_off spines text hatch plt axis plt.bar() plt.axis import figure pyplot highlight_text pypalettes plt.subplots() xlabel ylabel title legend colorbar savefig tight_layout grid set_xlim set_ylim plot scatter hist boxplot imshow cmap alpha bins tick_params annotate quiver contour barh stackplot subplots_adjust axhline axvline semilogx semilogy loglog polar streamplot hexbin pcolor tricontour errorbar clabel set_aspect violinplot set_axis_off spines text hatch plt axis plt.bar() plt.axis import figure pyplot highlight_text pypalettes plt.subplots() xlabel ylabel title legend colorbar savefig tight_layout grid set_xlim set_ylim plot scatter hist boxplot imshow cmap alpha bins tick_params annotate quiver contour barh stackplot subplots_adjust axhline axvline semilogx semilogy loglog polar streamplot hexbin pcolor tricontour errorbar clabel set_aspect violinplot set_axis_off spines text hatch plt axis plt.bar() plt.axis import figure pyplot highlight_text pypalettes plt.subplots() xlabel ylabel title legend colorbar savefig tight_layout grid set_xlim set_ylim plot scatter hist boxplot imshow cmap alpha bins tick_params annotate quiver contour barh stackplot subplots_adjust axhline axvline semilogx semilogy loglog polar streamplot hexbin pcolor tricontour errorbar clabel set_aspect violinplot set_axis_off spines text hatch plt axis plt.bar() plt.axis import figure pyplot highlight_text pypalettes plt.subplots() xlabel ylabel title legend colorbar savefig tight_layout grid set_xlim set_ylim plot scatter hist boxplot imshow cmap alpha bins tick_params annotate quiver contour barh stackplot subplots_adjust axhline axvline semilogx semilogy loglog polar streamplot hexbin pcolor tricontour errorbar clabel set_aspect violinplot set_axis_off spines text hatch plt axis plt.bar() plt.axis import figure pyplot highlight_text pypalettes plt.subplots() xlabel ylabel title legend colorbar savefig tight_layout grid set_xlim set_ylim plot scatter hist boxplot imshow cmap alpha bins tick_params annotate quiver contour barh stackplot subplots_adjust axhline axvline semilogx semilogy loglog polar streamplot hexbin pcolor tricontour errorbar clabel set_aspect violinplot set_axis_off spines text hatch plt axis plt.bar() plt.axis import figure pyplot highlight_text pypalettes plt.subplots() xlabel ylabel title legend colorbar savefig tight_layout grid set_xlim set_ylim plot scatter hist boxplot imshow cmap alpha bins tick_params annotate quiver contour barh stackplot subplots_adjust axhline axvline semilogx semilogy loglog polar streamplot hexbin pcolor tricontour errorbar clabel set_aspect violinplot set_axis_off spines text hatch plt axis plt.bar() plt.axis import figure pyplot highlight_text pypalettes plt.subplots() xlabel ylabel title legend colorbar savefig tight_layout grid set_xlim set_ylim plot scatter hist boxplot imshow cmap alpha bins tick_params annotate quiver contour barh stackplot subplots_adjust axhline axvline semilogx semilogy loglog polar streamplot hexbin pcolor tricontour errorbar clabel set_aspect violinplot set_axis_off spines text hatch plt axis plt.bar() plt.axis import figure pyplot highlight_text pypalettes plt.subplots() xlabel ylabel title legend colorbar savefig tight_layout grid set_xlim set_ylim plot scatter hist boxplot imshow cmap alpha bins tick_params annotate quiver contour barh stackplot subplots_adjust axhline axvline semilogx semilogy loglog polar streamplot hexbin pcolor tricontour errorbar clabel set_aspect violinplot set_axis_off spines text hatch plt axis plt.bar() plt.axis import figure pyplot highlight_text pypalettes plt.subplots() xlabel ylabel title legend colorbar savefig tight_layout grid set_xlim set_ylim plot scatter hist boxplot imshow cmap alpha bins tick_params annotate quiver contour barh stackplot subplots_adjust axhline axvline semilogx semilogy loglog polar streamplot hexbin pcolor tricontour errorbar clabel set_aspect violinplot set_axis_off spines text hatch plt axis plt.bar() plt.axis import figure pyplot highlight_text pypalettes plt.subplots() xlabel ylabel title legend colorbar savefig tight_layout grid set_xlim set_ylim plot scatter hist boxplot imshow cmap alpha bins tick_params annotate quiver contour barh stackplot subplots_adjust axhline axvline semilogx semilogy loglog polar streamplot hexbin pcolor tricontour errorbar clabel set_aspect violinplot set_axis_off spines text hatch plt axis plt.bar() plt.axis import figure pyplot highlight_text pypalettes plt.subplots() xlabel ylabel title legend colorbar savefig tight_layout grid set_xlim set_ylim plot scatter hist boxplot imshow cmap alpha bins tick_params annotate quiver contour barh stackplot subplots_adjust axhline axvline semilogx semilogy loglog polar streamplot hexbin pcolor tricontour errorbar clabel set_aspect violinplot set_axis_off spines text hatch plt axis plt.bar() plt.axis import figure pyplot highlight_text pypalettes plt.subplots() xlabel ylabel title legend colorbar savefig tight_layout grid set_xlim set_ylim plot scatter hist boxplot imshow cmap alpha bins tick_params annotate quiver contour barh stackplot subplots_adjust axhline axvline semilogx semilogy loglog polar streamplot hexbin pcolor tricontour errorbar clabel set_aspect violinplot set_axis_off spines text hatch plt axis plt.bar() plt.axis import figure pyplot highlight_text pypalettes plt.subplots() xlabel ylabel title legend colorbar savefig tight_layout grid set_xlim set_ylim plot scatter hist boxplot imshow cmap alpha bins tick_params annotate quiver contour barh stackplot subplots_adjust axhline axvline semilogx semilogy loglog polar streamplot hexbin pcolor tricontour errorbar clabel set_aspect violinplot set_axis_off spines text hatch plt axis plt.bar() plt.axis import figure pyplot highlight_text pypalettes plt.subplots() xlabel ylabel title legend colorbar savefig tight_layout grid set_xlim set_ylim plot scatter hist boxplot imshow cmap alpha bins tick_params annotate quiver contour barh stackplot subplots_adjust axhline axvline semilogx semilogy loglog polar streamplot hexbin pcolor tricontour errorbar clabel set_aspect violinplot set_axis_off spines text hatch plt axis plt.bar() plt.axis import figure pyplot highlight_text pypalettes plt.subplots() xlabel ylabel title legend colorbar savefig tight_layout grid set_xlim set_ylim plot scatter hist boxplot imshow cmap alpha bins tick_params annotate quiver contour barh stackplot subplots_adjust axhline axvline semilogx semilogy loglog polar streamplot hexbin pcolor tricontour errorbar clabel set_aspect violinplot set_axis_off spines text hatch plt axis plt.bar() plt.axis import figure pyplot highlight_text pypalettes plt.subplots() xlabel ylabel title legend colorbar savefig tight_layout grid set_xlim set_ylim plot scatter hist boxplot imshow cmap alpha bins tick_params annotate quiver contour barh stackplot subplots_adjust axhline axvline semilogx semilogy loglog polar streamplot hexbin pcolor tricontour errorbar clabel set_aspect violinplot set_axis_off spines text hatch plt axis plt.bar() plt.axis import figure pyplot highlight_text pypalettes plt.subplots() xlabel ylabel title legend colorbar savefig tight_layout grid set_xlim set_ylim plot scatter hist boxplot imshow cmap alpha bins tick_params annotate quiver contour barh stackplot subplots_adjust axhline axvline semilogx semilogy loglog polar streamplot hexbin pcolor tricontour errorbar clabel set_aspect violinplot set_axis_off spines text hatch plt axis plt.bar() plt.axis import figure pyplot highlight_text pypalettes plt.subplots() xlabel ylabel title legend colorbar savefig tight_layout grid set_xlim set_ylim plot scatter hist boxplot imshow cmap alpha bins tick_params annotate quiver contour barh stackplot subplots_adjust axhline axvline semilogx semilogy loglog polar streamplot hexbin pcolor tricontour errorbar clabel set_aspect violinplot set_axis_off spines text hatch plt axis plt.bar() plt.axis import figure pyplot highlight_text pypalettes plt.subplots() xlabel ylabel title legend colorbar savefig tight_layout grid set_xlim set_ylim plot scatter hist boxplot imshow cmap alpha bins tick_params annotate quiver contour barh stackplot subplots_adjust axhline axvline semilogx semilogy loglog polar streamplot hexbin pcolor tricontour errorbar clabel set_aspect violinplot set_axis_off spines text hatch plt axis plt.bar() plt.axis import figure pyplot highlight_text pypalettes plt.subplots() xlabel ylabel title legend colorbar savefig tight_layout grid set_xlim set_ylim plot scatter hist boxplot imshow cmap alpha bins tick_params annotate quiver contour barh stackplot subplots_adjust axhline axvline semilogx semilogy loglog polar streamplot hexbin pcolor tricontour errorbar clabel set_aspect violinplot set_axis_off spines text hatch plt axis plt.bar() plt.axis import figure pyplot highlight_text pypalettes plt.subplots() xlabel ylabel title legend colorbar savefig tight_layout grid set_xlim set_ylim plot scatter hist boxplot imshow cmap alpha bins tick_params annotate quiver contour barh stackplot subplots_adjust axhline axvline semilogx semilogy loglog polar streamplot hexbin pcolor tricontour errorbar clabel set_aspect violinplot set_axis_off spines text hatch plt axis plt.bar() plt.axis import figure pyplot highlight_text pypalettes plt.subplots() xlabel ylabel title legend colorbar savefig tight_layout grid set_xlim set_ylim plot scatter hist boxplot imshow cmap alpha bins tick_params annotate quiver contour barh stackplot subplots_adjust axhline axvline semilogx semilogy loglog polar streamplot hexbin pcolor tricontour errorbar clabel set_aspect violinplot set_axis_off spines text hatch plt axis plt.bar() plt.axis import figure pyplot highlight_text pypalettes plt.subplots() xlabel ylabel title legend colorbar savefig tight_layout grid set_xlim set_ylim plot scatter hist boxplot imshow cmap alpha bins tick_params annotate quiver contour barh stackplot subplots_adjust axhline axvline semilogx semilogy loglog polar streamplot hexbin pcolor tricontour errorbar clabel set_aspect violinplot set_axis_off spines text hatch plt axis plt.bar() plt.axis import figure pyplot highlight_text pypalettes plt.subplots() xlabel ylabel title legend colorbar savefig tight_layout grid set_xlim set_ylim plot scatter hist boxplot imshow cmap alpha bins tick_params annotate quiver contour barh stackplot subplots_adjust axhline axvline semilogx semilogy loglog polar streamplot hexbin pcolor tricontour errorbar clabel set_aspect violinplot set_axis_off spines text hatch plt axis plt.bar() plt.axis import figure pyplot highlight_text pypalettes plt.subplots() xlabel ylabel title legend colorbar savefig tight_layout grid set_xlim set_ylim plot scatter hist boxplot imshow cmap alpha bins tick_params annotate quiver contour barh stackplot subplots_adjust axhline axvline semilogx semilogy loglog polar streamplot hexbin pcolor tricontour errorbar clabel set_aspect violinplot set_axis_off spines text hatch plt axis plt.bar() plt.axis import figure pyplot highlight_text pypalettes plt.subplots() xlabel ylabel title legend colorbar savefig tight_layout grid set_xlim set_ylim plot scatter hist boxplot imshow cmap alpha bins tick_params annotate quiver contour barh stackplot subplots_adjust axhline axvline semilogx semilogy loglog polar streamplot hexbin pcolor tricontour errorbar clabel set_aspect violinplot set_axis_off spines text hatch plt axis plt.bar() plt.axis import figure pyplot highlight_text pypalettes plt.subplots() xlabel ylabel title legend colorbar savefig tight_layout grid set_xlim set_ylim plot scatter hist boxplot imshow cmap alpha bins tick_params annotate quiver contour barh stackplot subplots_adjust axhline axvline semilogx semilogy loglog polar streamplot hexbin pcolor tricontour errorbar clabel set_aspect violinplot set_axis_off spines text hatch plt axis plt.bar() plt.axis import figure pyplot highlight_text pypalettes plt.subplots() xlabel ylabel title legend colorbar savefig tight_layout grid set_xlim set_ylim plot scatter hist boxplot imshow cmap alpha bins tick_params annotate quiver contour barh stackplot subplots_adjust axhline axvline semilogx semilogy loglog polar streamplot hexbin pcolor tricontour errorbar clabel set_aspect violinplot set_axis_off spines text hatch plt axis plt.bar() plt.axis import figure pyplot highlight_text pypalettes plt.subplots() xlabel ylabel title legend colorbar savefig tight_layout grid set_xlim set_ylim plot scatter hist boxplot imshow cmap alpha bins tick_params annotate quiver contour barh stackplot subplots_adjust axhline axvline semilogx semilogy loglog polar streamplot hexbin pcolor tricontour errorbar clabel set_aspect violinplot set_axis_off spines text hatch plt axis plt.bar() plt.axis import figure pyplot highlight_text pypalettes plt.subplots() xlabel ylabel title legend colorbar savefig tight_layout grid set_xlim set_ylim plot scatter hist boxplot imshow cmap alpha bins tick_params annotate quiver contour barh stackplot subplots_adjust axhline axvline semilogx semilogy loglog polar streamplot hexbin pcolor tricontour errorbar clabel set_aspect violinplot set_axis_off spines text hatch plt axis plt.bar() plt.axis import figure pyplot highlight_text pypalettes plt.subplots() xlabel ylabel title legend colorbar savefig tight_layout grid set_xlim set_ylim plot scatter hist boxplot imshow cmap alpha bins tick_params annotate quiver contour barh stackplot subplots_adjust axhline axvline semilogx semilogy loglog polar streamplot hexbin pcolor tricontour errorbar clabel set_aspect violinplot set_axis_off spines text hatch plt axis plt.bar() plt.axis import figure pyplot highlight_text pypalettes plt.subplots() xlabel ylabel title legend colorbar savefig tight_layout grid set_xlim set_ylim plot scatter hist boxplot imshow cmap alpha bins tick_params annotate quiver contour barh stackplot subplots_adjust axhline axvline semilogx semilogy loglog polar streamplot hexbin pcolor tricontour errorbar clabel set_aspect violinplot set_axis_off spines text hatch plt axis plt.bar() plt.axis import figure pyplot highlight_text pypalettes plt.subplots() xlabel ylabel title legend colorbar savefig tight_layout grid set_xlim set_ylim plot scatter hist boxplot imshow cmap alpha bins tick_params annotate quiver contour barh stackplot subplots_adjust axhline axvline semilogx semilogy loglog polar streamplot hexbin pcolor tricontour errorbar clabel set_aspect violinplot set_axis_off spines text hatch plt axis plt.bar() plt.axis import figure pyplot highlight_text pypalettes plt.subplots() xlabel ylabel title legend colorbar savefig tight_layout grid set_xlim set_ylim plot scatter hist boxplot imshow cmap alpha bins tick_params annotate quiver contour barh stackplot subplots_adjust axhline axvline semilogx semilogy loglog polar streamplot hexbin pcolor tricontour errorbar clabel set_aspect violinplot set_axis_off spines text hatch plt axis plt.bar() plt.axis import figure pyplot highlight_text pypalettes plt.subplots() xlabel ylabel title legend colorbar savefig tight_layout grid set_xlim set_ylim plot scatter hist boxplot imshow cmap alpha bins tick_params annotate quiver contour barh stackplot subplots_adjust axhline axvline semilogx semilogy loglog polar streamplot hexbin pcolor tricontour errorbar clabel set_aspect violinplot set_axis_off spines text hatch plt axis plt.bar() plt.axis import figure pyplot highlight_text pypalettes plt.subplots() xlabel ylabel title legend colorbar savefig tight_layout grid set_xlim set_ylim plot scatter hist boxplot imshow cmap alpha bins tick_params annotate quiver contour barh stackplot subplots_adjust axhline axvline semilogx semilogy loglog polar streamplot hexbin pcolor tricontour errorbar clabel set_aspect violinplot set_axis_off spines text hatch plt axis plt.bar() plt.axis import figure pyplot highlight_text pypalettes plt.subplots() xlabel ylabel title legend colorbar savefig tight_layout grid set_xlim set_ylim plot scatter hist boxplot imshow cmap alpha bins tick_params annotate quiver contour barh stackplot subplots_adjust axhline axvline semilogx semilogy loglog polar streamplot hexbin pcolor tricontour errorbar clabel set_aspect violinplot set_axis_off spines text hatch plt axis plt.bar() plt.axis import figure pyplot highlight_text pypalettes plt.subplots() xlabel ylabel title legend colorbar savefig tight_layout grid set_xlim set_ylim plot scatter hist boxplot imshow cmap alpha bins tick_params annotate quiver contour barh stackplot subplots_adjust axhline axvline semilogx semilogy loglog polar streamplot hexbin pcolor tricontour errorbar clabel set_aspect violinplot set_axis_off spines text hatch plt axis plt.bar() plt.axis import figure pyplot highlight_text pypalettes plt.subplots() xlabel ylabel title legend colorbar savefig tight_layout grid set_xlim set_ylim plot scatter hist boxplot imshow cmap alpha bins tick_params annotate quiver contour barh stackplot subplots_adjust axhline axvline semilogx semilogy loglog polar streamplot hexbin pcolor tricontour errorbar clabel set_aspect violinplot set_axis_off spines text hatch plt axis plt.bar() plt.axis import figure pyplot highlight_text pypalettes plt.subplots() xlabel ylabel title legend colorbar savefig tight_layout grid set_xlim set_ylim plot scatter hist boxplot imshow cmap alpha bins tick_params annotate quiver contour barh stackplot subplots_adjust axhline axvline semilogx semilogy loglog polar streamplot hexbin pcolor tricontour errorbar clabel set_aspect violinplot set_axis_off spines text hatch plt axis plt.bar() plt.axis import figure pyplot highlight_text pypalettes plt.subplots() xlabel ylabel title legend colorbar savefig tight_layout grid set_xlim set_ylim plot scatter hist boxplot imshow cmap alpha bins tick_params annotate quiver contour barh stackplot subplots_adjust axhline axvline semilogx semilogy loglog polar streamplot hexbin pcolor tricontour errorbar clabel set_aspect violinplot set_axis_off spines text hatch plt axis plt.bar() plt.axis import figure pyplot highlight_text pypalettes plt.subplots() xlabel ylabel title legend colorbar savefig tight_layout grid set_xlim set_ylim plot scatter hist boxplot imshow cmap alpha bins tick_params annotate quiver contour barh stackplot subplots_adjust axhline axvline semilogx semilogy loglog polar streamplot hexbin pcolor tricontour errorbar clabel set_aspect violinplot set_axis_off spines text hatch plt axis plt.bar() plt.axis import figure pyplot highlight_text pypalettes plt.subplots() xlabel ylabel title legend colorbar savefig tight_layout grid set_xlim set_ylim plot scatter hist boxplot imshow cmap alpha bins tick_params annotate quiver contour barh stackplot subplots_adjust axhline axvline semilogx semilogy loglog polar streamplot hexbin pcolor tricontour errorbar clabel set_aspect violinplot set_axis_off spines text hatch plt axis plt.bar() plt.axis import figure pyplot highlight_text pypalettes plt.subplots() xlabel ylabel title legend colorbar savefig tight_layout grid set_xlim set_ylim plot scatter hist boxplot imshow cmap alpha bins tick_params annotate quiver contour barh stackplot subplots_adjust axhline axvline semilogx semilogy loglog polar streamplot hexbin pcolor tricontour errorbar clabel set_aspect violinplot set_axis_off spines text hatch plt axis plt.bar() plt.axis import figure pyplot highlight_text pypalettes plt.subplots() xlabel ylabel title legend colorbar savefig tight_layout grid set_xlim set_ylim plot scatter hist boxplot imshow cmap alpha bins tick_params annotate quiver contour barh stackplot subplots_adjust axhline axvline semilogx semilogy loglog polar streamplot hexbin pcolor tricontour errorbar clabel set_aspect violinplot set_axis_off spines text hatch plt axis plt.bar() plt.axis import figure pyplot highlight_text pypalettes plt.subplots() xlabel ylabel title legend colorbar savefig tight_layout grid set_xlim set_ylim plot scatter hist boxplot imshow cmap alpha bins tick_params annotate quiver contour barh stackplot subplots_adjust axhline axvline semilogx semilogy loglog polar streamplot hexbin pcolor tricontour errorbar clabel set_aspect violinplot set_axis_off spines text hatch plt axis plt.bar() plt.axis import figure pyplot highlight_text pypalettes plt.subplots() xlabel ylabel title legend colorbar savefig tight_layout grid set_xlim set_ylim plot scatter hist boxplot imshow cmap alpha bins tick_params annotate quiver contour barh stackplot subplots_adjust axhline axvline semilogx semilogy loglog polar streamplot hexbin pcolor tricontour errorbar clabel set_aspect violinplot set_axis_off spines text hatch plt axis plt.bar() plt.axis import figure pyplot highlight_text pypalettes plt.subplots() xlabel ylabel title legend colorbar savefig tight_layout grid set_xlim set_ylim plot scatter hist boxplot imshow cmap alpha bins tick_params annotate quiver contour barh stackplot subplots_adjust axhline axvline semilogx semilogy loglog polar streamplot hexbin pcolor tricontour errorbar clabel set_aspect violinplot set_axis_off spines text hatch plt axis plt.bar() plt.axis import figure pyplot highlight_text pypalettes plt.subplots() xlabel ylabel title legend colorbar savefig tight_layout grid set_xlim set_ylim plot scatter hist boxplot imshow cmap alpha bins tick_params annotate quiver contour barh stackplot subplots_adjust axhline axvline semilogx semilogy loglog polar streamplot hexbin pcolor tricontour errorbar clabel set_aspect violinplot set_axis_off spines text hatch plt axis plt.bar() plt.axis import figure pyplot highlight_text pypalettes plt.subplots() xlabel ylabel title legend colorbar savefig tight_layout grid set_xlim set_ylim plot scatter hist boxplot imshow cmap alpha bins tick_params annotate quiver contour barh stackplot subplots_adjust axhline axvline semilogx semilogy loglog polar streamplot hexbin pcolor tricontour errorbar clabel set_aspect violinplot set_axis_off spines text hatch plt axis plt.bar() plt.axis import figure pyplot highlight_text pypalettes plt.subplots() xlabel ylabel title legend colorbar savefig tight_layout grid set_xlim set_ylim plot scatter hist boxplot imshow cmap alpha bins tick_params annotate quiver contour barh stackplot subplots_adjust axhline axvline semilogx semilogy loglog polar streamplot hexbin pcolor tricontour errorbar clabel set_aspect violinplot set_axis_off spines text hatch plt axis plt.bar() plt.axis import figure pyplot highlight_text pypalettes plt.subplots() xlabel ylabel title legend colorbar savefig tight_layout grid set_xlim set_ylim plot scatter hist boxplot imshow cmap alpha bins tick_params annotate quiver contour barh stackplot subplots_adjust axhline axvline semilogx semilogy loglog polar streamplot hexbin pcolor tricontour errorbar clabel set_aspect violinplot set_axis_off spines text hatch plt axis plt.bar() plt.axis import figure pyplot highlight_text pypalettes plt.subplots() xlabel ylabel title legend colorbar savefig tight_layout grid set_xlim set_ylim plot scatter hist boxplot imshow cmap alpha bins tick_params annotate quiver contour barh stackplot subplots_adjust axhline axvline semilogx semilogy loglog polar streamplot hexbin pcolor tricontour errorbar clabel set_aspect violinplot set_axis_off spines text hatch plt axis plt.bar() plt.axis import figure pyplot highlight_text pypalettes plt.subplots() xlabel ylabel title legend colorbar savefig tight_layout grid set_xlim set_ylim plot scatter hist boxplot imshow cmap alpha bins tick_params annotate quiver contour barh stackplot subplots_adjust axhline axvline semilogx semilogy loglog polar streamplot hexbin pcolor tricontour errorbar clabel set_aspect violinplot set_axis_off spines text hatch plt axis plt.bar() plt.axis import figure pyplot highlight_text pypalettes plt.subplots() xlabel ylabel title legend colorbar savefig tight_layout grid set_xlim set_ylim plot scatter hist boxplot imshow cmap alpha bins tick_params annotate quiver contour barh stackplot subplots_adjust axhline axvline semilogx semilogy loglog polar streamplot hexbin pcolor tricontour errorbar clabel set_aspect violinplot set_axis_off spines text hatch plt axis plt.bar() plt.axis import figure pyplot highlight_text pypalettes plt.subplots() xlabel ylabel title legend colorbar savefig tight_layout grid set_xlim set_ylim plot scatter hist boxplot imshow cmap alpha bins tick_params annotate quiver contour barh stackplot subplots_adjust axhline axvline semilogx semilogy loglog polar streamplot hexbin pcolor tricontour errorbar clabel set_aspect violinplot set_axis_off spines text hatch plt axis plt.bar() plt.axis import figure pyplot highlight_text pypalettes plt.subplots() xlabel ylabel title legend colorbar savefig tight_layout grid set_xlim set_ylim plot scatter hist boxplot imshow cmap alpha bins tick_params annotate quiver contour barh stackplot subplots_adjust axhline axvline semilogx semilogy loglog polar streamplot hexbin pcolor tricontour errorbar clabel set_aspect violinplot set_axis_off spines text hatch plt axis plt.bar() plt.axis import figure pyplot highlight_text pypalettes plt.subplots() xlabel ylabel title legend colorbar savefig tight_layout grid set_xlim set_ylim plot scatter hist boxplot imshow cmap alpha bins tick_params annotate quiver contour barh stackplot subplots_adjust axhline axvline semilogx semilogy loglog polar streamplot hexbin pcolor tricontour errorbar clabel set_aspect violinplot set_axis_off spines text hatch plt axis plt.bar() plt.axis import figure pyplot highlight_text pypalettes plt.subplots() xlabel ylabel title legend colorbar savefig tight_layout grid set_xlim set_ylim plot scatter hist boxplot imshow cmap alpha bins tick_params annotate quiver contour barh stackplot subplots_adjust axhline axvline semilogx semilogy loglog polar streamplot hexbin pcolor tricontour errorbar clabel set_aspect violinplot set_axis_off spines text hatch plt axis plt.bar() plt.axis import figure pyplot highlight_text pypalettes plt.subplots() xlabel ylabel title legend colorbar savefig tight_layout grid set_xlim set_ylim plot scatter hist boxplot imshow cmap alpha bins tick_params annotate quiver contour barh stackplot subplots_adjust axhline axvline semilogx semilogy loglog polar streamplot hexbin pcolor tricontour errorbar clabel set_aspect violinplot set_axis_off spines text hatch plt axis plt.bar() plt.axis import figure pyplot highlight_text pypalettes plt.subplots() xlabel ylabel title legend colorbar savefig tight_layout grid set_xlim set_ylim plot scatter hist boxplot imshow cmap alpha bins tick_params annotate quiver contour barh stackplot subplots_adjust axhline axvline semilogx semilogy loglog polar streamplot hexbin pcolor tricontour errorbar clabel set_aspect violinplot set_axis_off spines text hatch plt axis plt.bar() plt.axis import figure pyplot highlight_text pypalettes plt.subplots() xlabel ylabel title legend colorbar savefig tight_layout grid set_xlim set_ylim plot scatter hist boxplot imshow cmap alpha bins tick_params annotate quiver contour barh stackplot subplots_adjust axhline axvline semilogx semilogy loglog polar streamplot hexbin pcolor tricontour errorbar clabel set_aspect violinplot set_axis_off spines text hatch plt axis plt.bar() plt.axis import figure pyplot highlight_text pypalettes plt.subplots() xlabel ylabel title legend colorbar savefig tight_layout grid set_xlim set_ylim plot scatter hist boxplot imshow cmap alpha bins tick_params annotate quiver contour barh stackplot subplots_adjust axhline axvline semilogx semilogy loglog polar streamplot hexbin pcolor tricontour errorbar clabel set_aspect violinplot set_axis_off spines text hatch plt axis plt.bar() plt.axis import figure pyplot highlight_text pypalettes plt.subplots() xlabel ylabel title legend colorbar savefig tight_layout grid set_xlim set_ylim plot scatter hist boxplot imshow cmap alpha bins tick_params annotate quiver contour barh stackplot subplots_adjust axhline axvline semilogx semilogy loglog polar streamplot hexbin pcolor tricontour errorbar clabel set_aspect violinplot set_axis_off spines text hatch plt axis plt.bar() plt.axis import figure pyplot highlight_text pypalettes plt.subplots() xlabel ylabel title legend colorbar savefig tight_layout grid set_xlim set_ylim plot scatter hist boxplot imshow cmap alpha bins tick_params annotate quiver contour barh stackplot subplots_adjust axhline axvline semilogx semilogy loglog polar streamplot hexbin pcolor tricontour errorbar clabel set_aspect violinplot set_axis_off spines text hatch plt axis plt.bar() plt.axis import figure pyplot highlight_text pypalettes plt.subplots() xlabel ylabel title legend colorbar savefig tight_layout grid set_xlim set_ylim plot scatter hist boxplot imshow cmap alpha bins tick_params annotate quiver contour barh stackplot subplots_adjust axhline axvline semilogx semilogy loglog polar streamplot hexbin pcolor tricontour errorbar clabel set_aspect violinplot set_axis_off spines text hatch plt axis plt.bar() plt.axis import figure pyplot highlight_text pypalettes plt.subplots() xlabel ylabel title legend colorbar savefig tight_layout grid set_xlim set_ylim plot scatter hist boxplot imshow cmap alpha bins tick_params annotate quiver contour barh stackplot subplots_adjust axhline axvline semilogx semilogy loglog polar streamplot hexbin pcolor tricontour errorbar clabel set_aspect violinplot set_axis_off spines text hatch plt axis plt.bar() plt.axis import figure pyplot highlight_text pypalettes plt.subplots() xlabel ylabel title legend colorbar savefig tight_layout grid set_xlim set_ylim plot scatter hist boxplot imshow cmap alpha bins tick_params annotate quiver contour barh stackplot subplots_adjust axhline axvline semilogx semilogy loglog polar streamplot hexbin pcolor tricontour errorbar clabel set_aspect violinplot set_axis_off spines text hatch plt axis plt.bar() plt.axis import figure pyplot highlight_text pypalettes plt.subplots() xlabel ylabel title legend colorbar savefig tight_layout grid set_xlim set_ylim plot scatter hist boxplot imshow cmap alpha bins tick_params annotate quiver contour barh stackplot subplots_adjust axhline axvline semilogx semilogy loglog polar streamplot hexbin pcolor tricontour errorbar clabel set_aspect violinplot set_axis_off spines text hatch plt axis plt.bar() plt.axis import figure pyplot highlight_text pypalettes plt.subplots() xlabel ylabel title legend colorbar savefig tight_layout grid set_xlim set_ylim plot scatter hist boxplot imshow cmap alpha bins tick_params annotate quiver contour barh stackplot subplots_adjust axhline axvline semilogx semilogy loglog polar streamplot hexbin pcolor tricontour errorbar clabel set_aspect violinplot set_axis_off spines text hatch plt axis plt.bar() plt.axis import figure pyplot highlight_text pypalettes plt.subplots() xlabel ylabel title legend colorbar savefig tight_layout grid set_xlim set_ylim plot scatter hist boxplot imshow cmap alpha bins tick_params annotate quiver contour barh stackplot subplots_adjust axhline axvline semilogx semilogy loglog polar streamplot hexbin pcolor tricontour errorbar clabel set_aspect violinplot set_axis_off spines text hatch plt axis plt.bar() plt.axis import figure pyplot highlight_text pypalettes plt.subplots() xlabel ylabel title legend colorbar savefig tight_layout grid set_xlim set_ylim plot scatter hist boxplot imshow cmap alpha bins tick_params annotate quiver contour barh stackplot subplots_adjust axhline axvline semilogx semilogy loglog polar streamplot hexbin pcolor tricontour errorbar clabel set_aspect violinplot set_axis_off spines text hatch plt axis plt.bar() plt.axis import figure pyplot highlight_text pypalettes plt.subplots() xlabel ylabel title legend colorbar savefig tight_layout grid set_xlim set_ylim plot scatter hist boxplot imshow cmap alpha bins tick_params annotate quiver contour barh stackplot subplots_adjust axhline axvline semilogx semilogy loglog polar streamplot hexbin pcolor tricontour errorbar clabel set_aspect violinplot set_axis_off spines text hatch plt axis plt.bar() plt.axis import figure pyplot highlight_text pypalettes plt.subplots() xlabel ylabel title legend colorbar savefig tight_layout grid set_xlim set_ylim plot scatter hist boxplot imshow cmap alpha bins tick_params annotate quiver contour barh stackplot subplots_adjust axhline axvline semilogx semilogy loglog polar streamplot hexbin pcolor tricontour errorbar clabel set_aspect violinplot set_axis_off spines text hatch plt axis plt.bar() plt.axis import figure pyplot highlight_text pypalettes plt.subplots() xlabel ylabel title legend colorbar savefig tight_layout grid set_xlim set_ylim plot scatter hist boxplot imshow cmap alpha bins tick_params annotate quiver contour barh stackplot subplots_adjust axhline axvline semilogx semilogy loglog polar streamplot hexbin pcolor tricontour errorbar clabel set_aspect violinplot set_axis_off spines text hatch plt axis plt.bar() plt.axis import figure pyplot highlight_text pypalettes plt.subplots() xlabel ylabel title legend colorbar savefig tight_layout grid set_xlim set_ylim plot scatter hist boxplot imshow cmap alpha bins tick_params annotate quiver contour barh stackplot subplots_adjust axhline axvline semilogx semilogy loglog polar streamplot hexbin pcolor tricontour errorbar clabel set_aspect violinplot set_axis_off spines text hatch plt axis plt.bar() plt.axis import figure pyplot highlight_text pypalettes plt.subplots() xlabel ylabel title legend colorbar savefig tight_layout grid set_xlim set_ylim plot scatter hist boxplot imshow cmap alpha bins tick_params annotate quiver contour barh stackplot subplots_adjust axhline axvline semilogx semilogy loglog polar streamplot hexbin pcolor tricontour errorbar clabel set_aspect violinplot set_axis_off spines text hatch plt axis plt.bar() plt.axis import figure pyplot highlight_text pypalettes plt.subplots() xlabel ylabel title legend colorbar savefig tight_layout grid set_xlim set_ylim plot scatter hist boxplot imshow cmap alpha bins tick_params annotate quiver contour barh stackplot subplots_adjust axhline axvline semilogx semilogy loglog polar streamplot hexbin pcolor tricontour errorbar clabel set_aspect violinplot set_axis_off spines text hatch plt axis plt.bar() plt.axis import figure pyplot highlight_text pypalettes plt.subplots() xlabel ylabel title legend colorbar savefig tight_layout grid set_xlim set_ylim plot scatter hist boxplot imshow cmap alpha bins tick_params annotate quiver contour barh stackplot subplots_adjust axhline axvline semilogx semilogy loglog polar streamplot hexbin pcolor tricontour errorbar clabel set_aspect violinplot set_axis_off spines text hatch plt axis plt.bar() plt.axis import figure pyplot highlight_text pypalettes plt.subplots() xlabel ylabel title legend colorbar savefig tight_layout grid set_xlim set_ylim plot scatter hist boxplot imshow cmap alpha bins tick_params annotate quiver contour barh stackplot subplots_adjust axhline axvline semilogx semilogy loglog polar streamplot hexbin pcolor tricontour errorbar clabel set_aspect violinplot set_axis_off spines text hatch plt axis plt.bar() plt.axis import figure pyplot highlight_text pypalettes plt.subplots() xlabel ylabel title legend colorbar savefig tight_layout grid set_xlim set_ylim plot scatter hist boxplot imshow cmap alpha bins tick_params annotate quiver contour barh stackplot subplots_adjust axhline axvline semilogx semilogy loglog polar streamplot hexbin pcolor tricontour errorbar clabel set_aspect violinplot set_axis_off spines text hatch plt axis plt.bar() plt.axis import figure pyplot highlight_text pypalettes plt.subplots() xlabel ylabel title legend colorbar savefig tight_layout grid set_xlim set_ylim plot scatter hist boxplot imshow cmap alpha bins tick_params annotate quiver contour barh stackplot subplots_adjust axhline axvline semilogx semilogy loglog polar streamplot hexbin pcolor tricontour errorbar clabel set_aspect violinplot set_axis_off spines text hatch plt axis plt.bar() plt.axis import figure pyplot highlight_text pypalettes plt.subplots() xlabel ylabel title legend colorbar savefig tight_layout grid set_xlim set_ylim plot scatter hist boxplot imshow cmap alpha bins tick_params annotate quiver contour barh stackplot subplots_adjust axhline axvline semilogx semilogy loglog polar streamplot hexbin pcolor tricontour errorbar clabel set_aspect violinplot set_axis_off spines text hatch plt axis plt.bar() plt.axis import figure pyplot highlight_text pypalettes plt.subplots() xlabel ylabel title legend colorbar savefig tight_layout grid set_xlim set_ylim plot scatter hist boxplot imshow cmap alpha bins tick_params annotate quiver contour barh stackplot subplots_adjust axhline axvline semilogx semilogy loglog polar streamplot hexbin pcolor tricontour errorbar clabel set_aspect violinplot set_axis_off spines text hatch plt axis plt.bar() plt.axis import figure pyplot highlight_text pypalettes plt.subplots() xlabel ylabel title legend colorbar savefig tight_layout grid set_xlim set_ylim plot scatter hist boxplot imshow cmap alpha bins tick_params annotate quiver contour barh stackplot subplots_adjust axhline axvline semilogx semilogy loglog polar streamplot hexbin pcolor tricontour errorbar clabel set_aspect violinplot set_axis_off spines text hatch plt axis plt.bar() plt.axis import figure pyplot highlight_text pypalettes plt.subplots() xlabel ylabel title legend colorbar savefig tight_layout grid set_xlim set_ylim plot scatter hist boxplot imshow cmap alpha bins tick_params annotate quiver contour barh stackplot subplots_adjust axhline axvline semilogx semilogy loglog polar streamplot hexbin pcolor tricontour errorbar clabel set_aspect violinplot set_axis_off spines text hatch plt axis plt.bar() plt.axis import figure pyplot highlight_text pypalettes plt.subplots() xlabel ylabel title legend colorbar savefig tight_layout grid set_xlim set_ylim plot scatter hist boxplot imshow cmap alpha bins tick_params annotate quiver contour barh stackplot subplots_adjust axhline axvline semilogx semilogy loglog polar streamplot hexbin pcolor tricontour errorbar clabel set_aspect violinplot set_axis_off spines text hatch plt axis plt.bar() plt.axis import figure pyplot highlight_text pypalettes plt.subplots() xlabel ylabel title legend colorbar savefig tight_layout grid set_xlim set_ylim plot scatter hist boxplot imshow cmap alpha bins tick_params annotate quiver contour barh stackplot subplots_adjust axhline axvline semilogx semilogy loglog polar streamplot hexbin pcolor tricontour errorbar clabel set_aspect violinplot set_axis_off spines text hatch plt axis plt.bar() plt.axis import figure pyplot highlight_text pypalettes plt.subplots() xlabel ylabel title legend colorbar savefig tight_layout grid set_xlim set_ylim plot scatter hist boxplot imshow cmap alpha bins tick_params annotate quiver contour barh stackplot subplots_adjust axhline axvline semilogx semilogy loglog polar streamplot hexbin pcolor tricontour errorbar clabel set_aspect violinplot set_axis_off spines text hatch plt axis plt.bar() plt.axis import figure pyplot highlight_text pypalettes plt.subplots() xlabel ylabel title legend colorbar savefig tight_layout grid set_xlim set_ylim plot scatter hist boxplot imshow cmap alpha bins tick_params annotate quiver contour barh stackplot subplots_adjust axhline axvline semilogx semilogy loglog polar streamplot hexbin pcolor tricontour errorbar clabel set_aspect violinplot set_axis_off spines text hatch plt axis plt.bar() plt.axis import figure pyplot highlight_text pypalettes plt.subplots() xlabel ylabel title legend colorbar savefig tight_layout grid set_xlim set_ylim plot scatter hist boxplot imshow cmap alpha bins tick_params annotate quiver contour barh stackplot subplots_adjust axhline axvline semilogx semilogy loglog polar streamplot hexbin pcolor tricontour errorbar clabel set_aspect violinplot set_axis_off spines text hatch plt axis plt.bar() plt.axis import figure pyplot highlight_text pypalettes plt.subplots() xlabel ylabel title legend colorbar savefig tight_layout grid set_xlim set_ylim plot scatter hist boxplot imshow cmap alpha bins tick_params annotate quiver contour barh stackplot subplots_adjust axhline axvline semilogx semilogy loglog polar streamplot hexbin pcolor tricontour errorbar clabel set_aspect violinplot set_axis_off spines text hatch plt axis plt.bar() plt.axis import figure pyplot highlight_text pypalettes plt.subplots() xlabel ylabel title legend colorbar savefig tight_layout grid set_xlim set_ylim plot scatter hist boxplot imshow cmap alpha bins tick_params annotate quiver contour barh stackplot subplots_adjust axhline axvline semilogx semilogy loglog polar streamplot hexbin pcolor tricontour errorbar clabel set_aspect violinplot set_axis_off spines text hatch plt axis plt.bar() plt.axis import figure pyplot highlight_text pypalettes plt.subplots() xlabel ylabel title legend colorbar savefig tight_layout grid set_xlim set_ylim plot scatter hist boxplot imshow cmap alpha bins tick_params annotate quiver contour barh stackplot subplots_adjust axhline axvline semilogx semilogy loglog polar streamplot hexbin pcolor tricontour errorbar clabel set_aspect violinplot set_axis_off spines text hatch plt axis plt.bar() plt.axis import figure pyplot highlight_text pypalettes plt.subplots() xlabel ylabel title legend colorbar savefig tight_layout grid set_xlim set_ylim plot scatter hist boxplot imshow cmap alpha bins tick_params annotate quiver contour barh stackplot subplots_adjust axhline axvline semilogx semilogy loglog polar streamplot hexbin pcolor tricontour errorbar clabel set_aspect violinplot set_axis_off spines text hatch plt axis plt.bar() plt.axis import figure pyplot highlight_text pypalettes plt.subplots() xlabel ylabel title legend colorbar savefig tight_layout grid set_xlim set_ylim plot scatter hist boxplot imshow cmap alpha bins tick_params annotate quiver contour barh stackplot subplots_adjust axhline axvline semilogx semilogy loglog polar streamplot hexbin pcolor tricontour errorbar clabel set_aspect violinplot set_axis_off spines text hatch plt axis plt.bar() plt.axis import figure pyplot highlight_text pypalettes plt.subplots() xlabel ylabel title legend colorbar savefig tight_layout grid set_xlim set_ylim plot scatter hist boxplot imshow cmap alpha bins tick_params annotate quiver contour barh stackplot subplots_adjust axhline axvline semilogx semilogy loglog polar streamplot hexbin pcolor tricontour errorbar clabel set_aspect violinplot set_axis_off spines text hatch plt axis plt.bar() plt.axis import figure pyplot highlight_text pypalettes plt.subplots() xlabel ylabel title legend colorbar savefig tight_layout grid set_xlim set_ylim plot scatter hist boxplot imshow cmap alpha bins tick_params annotate quiver contour barh stackplot subplots_adjust axhline axvline semilogx semilogy loglog polar streamplot hexbin pcolor tricontour errorbar clabel set_aspect violinplot set_axis_off spines text hatch plt axis plt.bar() plt.axis import figure pyplot highlight_text pypalettes plt.subplots() xlabel ylabel title legend colorbar savefig tight_layout grid set_xlim set_ylim plot scatter hist boxplot imshow cmap alpha bins tick_params annotate quiver contour barh stackplot subplots_adjust axhline axvline semilogx semilogy loglog polar streamplot hexbin pcolor tricontour errorbar clabel set_aspect violinplot set_axis_off spines text hatch plt axis plt.bar() plt.axis import figure pyplot highlight_text pypalettes plt.subplots() xlabel ylabel title legend colorbar savefig tight_layout grid set_xlim set_ylim plot scatter hist boxplot imshow cmap alpha bins tick_params annotate quiver contour barh stackplot subplots_adjust axhline axvline semilogx semilogy loglog polar streamplot hexbin pcolor tricontour errorbar clabel set_aspect violinplot set_axis_off spines text hatch plt axis plt.bar() plt.axis import figure pyplot highlight_text pypalettes plt.subplots() xlabel ylabel title legend colorbar savefig tight_layout grid set_xlim set_ylim plot scatter hist boxplot imshow cmap alpha bins tick_params annotate quiver contour barh stackplot subplots_adjust axhline axvline semilogx semilogy loglog polar streamplot hexbin pcolor tricontour errorbar clabel set_aspect violinplot set_axis_off spines text hatch plt axis plt.bar() plt.axis import figure pyplot highlight_text pypalettes plt.subplots() xlabel ylabel title legend colorbar savefig tight_layout grid set_xlim set_ylim plot scatter hist boxplot imshow cmap alpha bins tick_params annotate quiver contour barh stackplot subplots_adjust axhline axvline semilogx semilogy loglog polar streamplot hexbin pcolor tricontour errorbar clabel set_aspect violinplot set_axis_off spines text hatch plt axis plt.bar() plt.axis import figure pyplot highlight_text pypalettes plt.subplots() xlabel ylabel title legend colorbar savefig tight_layout grid set_xlim set_ylim plot scatter hist boxplot imshow cmap alpha bins tick_params annotate quiver contour barh stackplot subplots_adjust axhline axvline semilogx semilogy loglog polar streamplot hexbin pcolor tricontour errorbar clabel set_aspect violinplot set_axis_off spines text hatch plt axis plt.bar() plt.axis import figure pyplot highlight_text pypalettes plt.subplots() xlabel ylabel title legend colorbar savefig tight_layout grid set_xlim set_ylim plot scatter hist boxplot imshow cmap alpha bins tick_params annotate quiver contour barh stackplot subplots_adjust axhline axvline semilogx semilogy loglog polar streamplot hexbin pcolor tricontour errorbar clabel set_aspect violinplot set_axis_off spines text hatch plt axis plt.bar() plt.axis import figure pyplot highlight_text pypalettes plt.subplots() xlabel ylabel title legend colorbar savefig tight_layout grid set_xlim set_ylim plot scatter hist boxplot imshow cmap alpha bins tick_params annotate quiver contour barh stackplot subplots_adjust axhline axvline semilogx semilogy loglog polar streamplot hexbin pcolor tricontour errorbar clabel set_aspect violinplot set_axis_off spines text hatch plt axis plt.bar() plt.axis import figure pyplot highlight_text pypalettes plt.subplots() xlabel ylabel title legend colorbar savefig tight_layout grid set_xlim set_ylim plot scatter hist boxplot imshow cmap alpha bins tick_params annotate quiver contour barh stackplot subplots_adjust axhline axvline semilogx semilogy loglog polar streamplot hexbin pcolor tricontour errorbar clabel set_aspect violinplot set_axis_off spines text hatch plt axis plt.bar() plt.axis import figure pyplot highlight_text pypalettes plt.subplots() xlabel ylabel title legend colorbar savefig tight_layout grid set_xlim set_ylim plot scatter hist boxplot imshow cmap alpha bins tick_params annotate quiver contour barh stackplot subplots_adjust axhline axvline semilogx semilogy loglog polar streamplot hexbin pcolor tricontour errorbar clabel set_aspect violinplot set_axis_off spines text hatch plt axis plt.bar() plt.axis import figure pyplot highlight_text pypalettes plt.subplots() xlabel ylabel title legend colorbar savefig tight_layout grid set_xlim set_ylim plot scatter hist boxplot imshow cmap alpha bins tick_params annotate quiver contour barh stackplot subplots_adjust axhline axvline semilogx semilogy loglog polar streamplot hexbin pcolor tricontour errorbar clabel set_aspect violinplot set_axis_off spines text hatch plt axis plt.bar() plt.axis import figure pyplot highlight_text pypalettes plt.subplots() xlabel ylabel title legend colorbar savefig tight_layout grid set_xlim set_ylim plot scatter hist boxplot imshow cmap alpha bins tick_params annotate quiver contour barh stackplot subplots_adjust axhline axvline semilogx semilogy loglog polar streamplot hexbin pcolor tricontour errorbar clabel set_aspect violinplot set_axis_off spines text hatch plt axis plt.bar() plt.axis import figure pyplot highlight_text pypalettes plt.subplots() xlabel ylabel title legend colorbar savefig tight_layout grid set_xlim set_ylim plot scatter hist boxplot imshow cmap alpha bins tick_params annotate quiver contour barh stackplot subplots_adjust axhline axvline semilogx semilogy loglog polar streamplot hexbin pcolor tricontour errorbar clabel set_aspect violinplot set_axis_off spines text hatch plt axis plt.bar() plt.axis import figure pyplot highlight_text pypalettes plt.subplots() xlabel ylabel title legend colorbar savefig tight_layout grid set_xlim set_ylim plot scatter hist boxplot imshow cmap alpha bins tick_params annotate quiver contour barh stackplot subplots_adjust axhline axvline semilogx semilogy loglog polar streamplot hexbin pcolor tricontour errorbar clabel set_aspect violinplot set_axis_off spines text hatch plt axis plt.bar() plt.axis import figure pyplot highlight_text pypalettes plt.subplots() xlabel ylabel title legend colorbar savefig tight_layout grid set_xlim set_ylim plot scatter hist boxplot imshow cmap alpha bins tick_params annotate quiver contour barh stackplot subplots_adjust axhline axvline semilogx semilogy loglog polar streamplot hexbin pcolor tricontour errorbar clabel set_aspect violinplot set_axis_off spines text hatch plt axis plt.bar() plt.axis import figure pyplot highlight_text pypalettes plt.subplots() xlabel ylabel title legend colorbar savefig tight_layout grid set_xlim set_ylim plot scatter hist boxplot imshow cmap alpha bins tick_params annotate quiver contour barh stackplot subplots_adjust axhline axvline semilogx semilogy loglog polar streamplot hexbin pcolor tricontour errorbar clabel set_aspect violinplot set_axis_off spines text hatch plt axis plt.bar() plt.axis import figure pyplot highlight_text pypalettes plt.subplots() xlabel ylabel title legend colorbar savefig tight_layout grid set_xlim set_ylim plot scatter hist boxplot imshow cmap alpha bins tick_params annotate quiver contour barh stackplot subplots_adjust axhline axvline semilogx semilogy loglog polar streamplot hexbin pcolor tricontour errorbar clabel set_aspect violinplot set_axis_off spines text hatch plt axis plt.bar() plt.axis import figure pyplot highlight_text pypalettes plt.subplots() xlabel ylabel title legend colorbar savefig tight_layout grid set_xlim set_ylim plot scatter hist boxplot imshow cmap alpha bins tick_params annotate quiver contour barh stackplot subplots_adjust axhline axvline semilogx semilogy loglog polar streamplot hexbin pcolor tricontour errorbar clabel set_aspect violinplot set_axis_off spines text hatch plt axis plt.bar() plt.axis import figure pyplot highlight_text pypalettes plt.subplots() xlabel ylabel title legend colorbar savefig tight_layout grid set_xlim set_ylim plot scatter hist boxplot imshow cmap alpha bins tick_params annotate quiver contour barh stackplot subplots_adjust axhline axvline semilogx semilogy loglog polar streamplot hexbin pcolor tricontour errorbar clabel set_aspect violinplot set_axis_off spines text hatch plt axis plt.bar() plt.axis import figure pyplot highlight_text pypalettes plt.subplots() xlabel ylabel title legend colorbar savefig tight_layout grid set_xlim set_ylim plot scatter hist boxplot imshow cmap alpha bins tick_params annotate quiver contour barh stackplot subplots_adjust axhline axvline semilogx semilogy loglog polar streamplot hexbin pcolor tricontour errorbar clabel set_aspect violinplot set_axis_off spines text hatch plt axis plt.bar() plt.axis import figure pyplot highlight_text pypalettes plt.subplots() xlabel ylabel title legend colorbar savefig tight_layout grid set_xlim set_ylim plot scatter hist boxplot imshow cmap alpha bins tick_params annotate quiver contour barh stackplot subplots_adjust axhline axvline semilogx semilogy loglog polar streamplot hexbin pcolor tricontour errorbar clabel set_aspect violinplot set_axis_off spines text hatch plt axis plt.bar() plt.axis import figure pyplot highlight_text pypalettes plt.subplots() xlabel ylabel title legend colorbar savefig tight_layout grid set_xlim set_ylim plot scatter hist boxplot imshow cmap alpha bins tick_params annotate quiver contour barh stackplot subplots_adjust axhline axvline semilogx semilogy loglog polar streamplot hexbin pcolor tricontour errorbar clabel set_aspect violinplot set_axis_off spines text hatch plt axis plt.bar() plt.axis import figure pyplot highlight_text pypalettes plt.subplots() xlabel ylabel title legend colorbar savefig tight_layout grid set_xlim set_ylim plot scatter hist boxplot imshow cmap alpha bins tick_params annotate quiver contour barh stackplot subplots_adjust axhline axvline semilogx semilogy loglog polar streamplot hexbin pcolor tricontour errorbar clabel set_aspect violinplot set_axis_off spines text hatch plt axis plt.bar() plt.axis import figure pyplot highlight_text pypalettes plt.subplots() xlabel ylabel title legend colorbar savefig tight_layout grid set_xlim set_ylim plot scatter hist boxplot imshow cmap alpha bins tick_params annotate quiver contour barh stackplot subplots_adjust axhline axvline semilogx semilogy loglog polar streamplot hexbin pcolor tricontour errorbar clabel set_aspect violinplot set_axis_off spines text hatch plt axis plt.bar() plt.axis import figure pyplot highlight_text pypalettes plt.subplots() xlabel ylabel title legend colorbar savefig tight_layout grid set_xlim set_ylim plot scatter hist boxplot imshow cmap alpha bins tick_params annotate quiver contour barh stackplot subplots_adjust axhline axvline semilogx semilogy loglog polar streamplot hexbin pcolor tricontour errorbar clabel set_aspect violinplot set_axis_off spines text hatch plt axis plt.bar() plt.axis import figure pyplot highlight_text pypalettes plt.subplots() xlabel ylabel title legend colorbar savefig tight_layout grid set_xlim set_ylim plot scatter hist boxplot imshow cmap alpha bins tick_params annotate quiver contour barh stackplot subplots_adjust axhline axvline semilogx semilogy loglog polar streamplot hexbin pcolor tricontour errorbar clabel set_aspect violinplot set_axis_off spines text hatch plt axis plt.bar() plt.axis import figure pyplot highlight_text pypalettes plt.subplots() xlabel ylabel title legend colorbar savefig tight_layout grid set_xlim set_ylim plot scatter hist boxplot imshow cmap alpha bins tick_params annotate quiver contour barh stackplot subplots_adjust axhline axvline semilogx semilogy loglog polar streamplot hexbin pcolor tricontour errorbar clabel set_aspect violinplot set_axis_off spines text hatch plt axis plt.bar() plt.axis import figure pyplot highlight_text pypalettes plt.subplots() xlabel ylabel title legend colorbar savefig tight_layout grid set_xlim set_ylim plot scatter hist boxplot imshow cmap alpha bins tick_params annotate quiver contour barh stackplot subplots_adjust axhline axvline semilogx semilogy loglog polar streamplot hexbin pcolor tricontour errorbar clabel set_aspect violinplot set_axis_off spines text hatch plt axis plt.bar() plt.axis import figure pyplot highlight_text pypalettes plt.subplots() xlabel ylabel title legend colorbar savefig tight_layout grid set_xlim set_ylim plot scatter hist boxplot imshow cmap alpha bins tick_params annotate quiver contour barh stackplot subplots_adjust axhline axvline semilogx semilogy loglog polar streamplot hexbin pcolor tricontour errorbar clabel set_aspect violinplot set_axis_off spines text hatch plt axis plt.bar() plt.axis import figure pyplot highlight_text pypalettes plt.subplots() xlabel ylabel title legend colorbar savefig tight_layout grid set_xlim set_ylim plot scatter hist boxplot imshow cmap alpha bins tick_params annotate quiver contour barh stackplot subplots_adjust axhline axvline semilogx semilogy loglog polar streamplot hexbin pcolor tricontour errorbar clabel set_aspect violinplot set_axis_off spines text hatch plt axis plt.bar() plt.axis import figure pyplot highlight_text pypalettes plt.subplots() xlabel ylabel title legend colorbar savefig tight_layout grid set_xlim set_ylim plot scatter hist boxplot imshow cmap alpha bins tick_params annotate quiver contour barh stackplot subplots_adjust axhline axvline semilogx semilogy loglog polar streamplot hexbin pcolor tricontour errorbar clabel set_aspect violinplot set_axis_off spines text hatch plt axis plt.bar() plt.axis import figure pyplot highlight_text pypalettes plt.subplots() xlabel ylabel title legend colorbar savefig tight_layout grid set_xlim set_ylim plot scatter hist boxplot imshow cmap alpha bins tick_params annotate quiver contour barh stackplot subplots_adjust axhline axvline semilogx semilogy loglog polar streamplot hexbin pcolor tricontour errorbar clabel set_aspect violinplot set_axis_off spines text hatch plt axis plt.bar() plt.axis import figure pyplot highlight_text pypalettes plt.subplots() xlabel ylabel title legend colorbar savefig tight_layout grid set_xlim set_ylim plot scatter hist boxplot imshow cmap alpha bins tick_params annotate quiver contour barh stackplot subplots_adjust axhline axvline semilogx semilogy loglog polar streamplot hexbin pcolor tricontour errorbar clabel set_aspect violinplot set_axis_off spines text hatch plt axis plt.bar() plt.axis import figure pyplot highlight_text pypalettes plt.subplots() xlabel ylabel title legend colorbar savefig tight_layout grid set_xlim set_ylim plot scatter hist boxplot imshow cmap alpha bins tick_params annotate quiver contour barh stackplot subplots_adjust axhline axvline semilogx semilogy loglog polar streamplot hexbin pcolor tricontour errorbar clabel set_aspect violinplot set_axis_off spines text hatch plt axis plt.bar() plt.axis import figure pyplot highlight_text pypalettes plt.subplots() xlabel ylabel title legend colorbar savefig tight_layout grid set_xlim set_ylim plot scatter hist boxplot imshow cmap alpha bins tick_params annotate quiver contour barh stackplot subplots_adjust axhline axvline semilogx semilogy loglog polar streamplot hexbin pcolor tricontour errorbar clabel set_aspect violinplot set_axis_off spines text hatch plt axis plt.bar() plt.axis import figure pyplot highlight_text pypalettes plt.subplots() xlabel ylabel title legend colorbar savefig tight_layout grid set_xlim set_ylim plot scatter hist boxplot imshow cmap alpha bins tick_params annotate quiver contour barh stackplot subplots_adjust axhline axvline semilogx semilogy loglog polar streamplot hexbin pcolor tricontour errorbar clabel set_aspect violinplot set_axis_off spines text hatch plt axis plt.bar() plt.axis import figure pyplot highlight_text pypalettes plt.subplots() xlabel ylabel title legend colorbar savefig tight_layout grid set_xlim set_ylim plot scatter hist boxplot imshow cmap alpha bins tick_params annotate quiver contour barh stackplot subplots_adjust axhline axvline semilogx semilogy loglog polar streamplot hexbin pcolor tricontour errorbar clabel set_aspect violinplot set_axis_off spines text hatch plt axis plt.bar() plt.axis import figure pyplot highlight_text pypalettes plt.subplots() xlabel ylabel title legend colorbar savefig tight_layout grid set_xlim set_ylim plot scatter hist boxplot imshow cmap alpha bins tick_params annotate quiver contour barh stackplot subplots_adjust axhline axvline semilogx semilogy loglog polar streamplot hexbin pcolor tricontour errorbar clabel set_aspect violinplot set_axis_off spines text hatch plt axis plt.bar() plt.axis import figure pyplot highlight_text pypalettes plt.subplots() xlabel ylabel title legend colorbar savefig tight_layout grid set_xlim set_ylim plot scatter hist boxplot imshow cmap alpha bins tick_params annotate quiver contour barh stackplot subplots_adjust axhline axvline semilogx semilogy loglog polar streamplot hexbin pcolor tricontour errorbar clabel set_aspect violinplot set_axis_off spines text hatch plt axis plt.bar() plt.axis import figure pyplot highlight_text pypalettes plt.subplots() xlabel ylabel title legend colorbar savefig tight_layout grid set_xlim set_ylim plot scatter hist boxplot imshow cmap alpha bins tick_params annotate quiver contour barh stackplot subplots_adjust axhline axvline semilogx semilogy loglog polar streamplot hexbin pcolor tricontour errorbar clabel set_aspect violinplot set_axis_off spines text hatch plt axis plt.bar() plt.axis import figure pyplot highlight_text pypalettes plt.subplots() xlabel ylabel title legend colorbar savefig tight_layout grid set_xlim set_ylim plot scatter hist boxplot imshow cmap alpha bins tick_params annotate quiver contour barh stackplot subplots_adjust axhline axvline semilogx semilogy loglog polar streamplot hexbin pcolor tricontour errorbar clabel set_aspect violinplot set_axis_off spines text hatch plt axis plt.bar() plt.axis import figure pyplot highlight_text pypalettes plt.subplots() xlabel ylabel title legend colorbar savefig tight_layout grid set_xlim set_ylim plot scatter hist boxplot imshow cmap alpha bins tick_params annotate quiver contour barh stackplot subplots_adjust axhline axvline semilogx semilogy loglog polar streamplot hexbin pcolor tricontour errorbar clabel set_aspect violinplot set_axis_off spines text hatch plt axis plt.bar() plt.axis import figure pyplot highlight_text pypalettes plt.subplots() xlabel ylabel title legend colorbar savefig tight_layout grid set_xlim set_ylim plot scatter hist boxplot imshow cmap alpha bins tick_params annotate quiver contour barh stackplot subplots_adjust axhline axvline semilogx semilogy loglog polar streamplot hexbin pcolor tricontour errorbar clabel set_aspect violinplot set_axis_off spines text hatch plt axis plt.bar() plt.axis import figure pyplot highlight_text pypalettes plt.subplots() xlabel ylabel title legend colorbar savefig tight_layout grid set_xlim set_ylim plot scatter hist boxplot imshow cmap alpha bins tick_params annotate quiver contour barh stackplot subplots_adjust axhline axvline semilogx semilogy loglog polar streamplot hexbin pcolor tricontour errorbar clabel set_aspect violinplot set_axis_off spines text hatch plt axis plt.bar() plt.axis import figure pyplot highlight_text pypalettes plt.subplots() xlabel ylabel title legend colorbar savefig tight_layout grid set_xlim set_ylim plot scatter hist boxplot imshow cmap alpha bins tick_params annotate quiver contour barh stackplot subplots_adjust axhline axvline semilogx semilogy loglog polar streamplot hexbin pcolor tricontour errorbar clabel set_aspect violinplot set_axis_off spines text hatch plt axis plt.bar() plt.axis import figure pyplot highlight_text pypalettes plt.subplots() xlabel ylabel title legend colorbar savefig tight_layout grid set_xlim set_ylim plot scatter hist boxplot imshow cmap alpha bins tick_params annotate quiver contour barh stackplot subplots_adjust axhline axvline semilogx semilogy loglog polar streamplot hexbin pcolor tricontour errorbar clabel set_aspect violinplot set_axis_off spines text hatch plt axis plt.bar() plt.axis import figure pyplot highlight_text pypalettes plt.subplots() xlabel ylabel title legend colorbar savefig tight_layout grid set_xlim set_ylim plot scatter hist boxplot imshow cmap alpha bins tick_params annotate quiver contour barh stackplot subplots_adjust axhline axvline semilogx semilogy loglog polar streamplot hexbin pcolor tricontour errorbar clabel set_aspect violinplot set_axis_off spines text hatch plt axis plt.bar() plt.axis import figure pyplot highlight_text pypalettes plt.subplots() xlabel ylabel title legend colorbar savefig tight_layout grid set_xlim set_ylim plot scatter hist boxplot imshow cmap alpha bins tick_params annotate quiver contour barh stackplot subplots_adjust axhline axvline semilogx semilogy loglog polar streamplot hexbin pcolor tricontour errorbar clabel set_aspect violinplot set_axis_off spines text hatch plt axis plt.bar() plt.axis import figure pyplot highlight_text pypalettes plt.subplots() xlabel ylabel title legend colorbar savefig tight_layout grid set_xlim set_ylim plot scatter hist boxplot imshow cmap alpha bins tick_params annotate quiver contour barh stackplot subplots_adjust axhline axvline semilogx semilogy loglog polar streamplot hexbin pcolor tricontour errorbar clabel set_aspect violinplot set_axis_off spines text hatch plt axis plt.bar() plt.axis import figure pyplot highlight_text pypalettes plt.subplots() xlabel ylabel title legend colorbar savefig tight_layout grid set_xlim set_ylim plot scatter hist boxplot imshow cmap alpha bins tick_params annotate quiver contour barh stackplot subplots_adjust axhline axvline semilogx semilogy loglog polar streamplot hexbin pcolor tricontour errorbar clabel set_aspect violinplot set_axis_off spines text hatch plt axis plt.bar() plt.axis import figure pyplot highlight_text pypalettes plt.subplots() xlabel ylabel title legend colorbar savefig tight_layout grid set_xlim set_ylim plot scatter hist boxplot imshow cmap alpha bins tick_params annotate quiver contour barh stackplot subplots_adjust axhline axvline semilogx semilogy loglog polar streamplot hexbin pcolor tricontour errorbar clabel set_aspect violinplot set_axis_off spines text hatch plt axis plt.bar() plt.axis import figure pyplot highlight_text pypalettes plt.subplots() xlabel ylabel title legend colorbar savefig tight_layout grid set_xlim set_ylim plot scatter hist boxplot imshow cmap alpha bins tick_params annotate quiver contour barh stackplot subplots_adjust axhline axvline semilogx semilogy loglog polar streamplot hexbin pcolor tricontour errorbar clabel set_aspect violinplot set_axis_off spines text hatch plt axis plt.bar() plt.axis import figure pyplot highlight_text pypalettes plt.subplots() xlabel ylabel title legend colorbar savefig tight_layout grid set_xlim set_ylim plot scatter hist boxplot imshow cmap alpha bins tick_params annotate quiver contour barh stackplot subplots_adjust axhline axvline semilogx semilogy loglog polar streamplot hexbin pcolor tricontour errorbar clabel set_aspect violinplot set_axis_off spines text hatch plt axis plt.bar() plt.axis import figure pyplot highlight_text pypalettes plt.subplots() xlabel ylabel title legend colorbar savefig tight_layout grid set_xlim set_ylim plot scatter hist boxplot imshow cmap alpha bins tick_params annotate quiver contour barh stackplot subplots_adjust axhline axvline semilogx semilogy loglog polar streamplot hexbin pcolor tricontour errorbar clabel set_aspect violinplot set_axis_off spines text hatch plt axis plt.bar() plt.axis import figure pyplot highlight_text pypalettes plt.subplots() xlabel ylabel title legend colorbar savefig tight_layout grid set_xlim set_ylim plot scatter hist boxplot imshow cmap alpha bins tick_params annotate quiver contour barh stackplot subplots_adjust axhline axvline semilogx semilogy loglog polar streamplot hexbin pcolor tricontour errorbar clabel set_aspect violinplot set_axis_off spines text hatch plt axis plt.bar() plt.axis import figure pyplot highlight_text pypalettes plt.subplots() xlabel ylabel title legend colorbar savefig tight_layout grid set_xlim set_ylim plot scatter hist boxplot imshow cmap alpha bins tick_params annotate quiver contour barh stackplot subplots_adjust axhline axvline semilogx semilogy loglog polar streamplot hexbin pcolor tricontour errorbar clabel set_aspect violinplot set_axis_off spines text hatch plt axis plt.bar() plt.axis import figure pyplot highlight_text pypalettes plt.subplots() xlabel ylabel title legend colorbar savefig tight_layout grid set_xlim set_ylim plot scatter hist boxplot imshow cmap alpha bins tick_params annotate quiver contour barh stackplot subplots_adjust axhline axvline semilogx semilogy loglog polar streamplot hexbin pcolor tricontour errorbar clabel set_aspect violinplot set_axis_off spines text hatch plt axis plt.bar() plt.axis import figure pyplot highlight_text pypalettes plt.subplots() xlabel ylabel title legend colorbar savefig tight_layout grid set_xlim set_ylim plot scatter hist boxplot imshow cmap alpha bins tick_params annotate quiver contour barh stackplot subplots_adjust axhline axvline semilogx semilogy loglog polar streamplot hexbin pcolor tricontour errorbar clabel set_aspect violinplot set_axis_off spines text hatch plt axis plt.bar() plt.axis import figure pyplot highlight_text pypalettes plt.subplots() xlabel ylabel title legend colorbar savefig tight_layout grid set_xlim set_ylim plot scatter hist boxplot imshow cmap alpha bins tick_params annotate quiver contour barh stackplot subplots_adjust axhline axvline semilogx semilogy loglog polar streamplot hexbin pcolor tricontour errorbar clabel set_aspect violinplot set_axis_off spines text hatch plt axis plt.bar() plt.axis import figure pyplot highlight_text pypalettes plt.subplots() xlabel ylabel title legend colorbar savefig tight_layout grid set_xlim set_ylim plot scatter hist boxplot imshow cmap alpha bins tick_params annotate quiver contour barh stackplot subplots_adjust axhline axvline semilogx semilogy loglog polar streamplot hexbin pcolor tricontour errorbar clabel set_aspect violinplot set_axis_off spines text hatch plt axis plt.bar() plt.axis import figure pyplot highlight_text pypalettes plt.subplots() xlabel ylabel title legend colorbar savefig tight_layout grid set_xlim set_ylim plot scatter hist boxplot imshow cmap alpha bins tick_params annotate quiver contour barh stackplot subplots_adjust axhline axvline semilogx semilogy loglog polar streamplot hexbin pcolor tricontour errorbar clabel set_aspect violinplot set_axis_off spines text hatch plt axis plt.bar() plt.axis import figure pyplot highlight_text pypalettes plt.subplots() xlabel ylabel title legend colorbar savefig tight_layout grid set_xlim set_ylim plot scatter hist boxplot imshow cmap alpha bins tick_params annotate quiver contour barh stackplot subplots_adjust axhline axvline semilogx semilogy loglog polar streamplot hexbin pcolor tricontour errorbar clabel set_aspect violinplot set_axis_off spines text hatch plt axis plt.bar() plt.axis import figure pyplot highlight_text pypalettes plt.subplots() xlabel ylabel title legend colorbar savefig tight_layout grid set_xlim set_ylim plot scatter hist boxplot imshow cmap alpha bins tick_params annotate quiver contour barh stackplot subplots_adjust axhline axvline semilogx semilogy loglog polar streamplot hexbin pcolor tricontour errorbar clabel set_aspect violinplot set_axis_off spines text hatch plt axis plt.bar() plt.axis import figure pyplot highlight_text pypalettes plt.subplots() xlabel ylabel title legend colorbar savefig tight_layout grid set_xlim set_ylim plot scatter hist boxplot imshow cmap alpha bins tick_params annotate quiver contour barh stackplot subplots_adjust axhline axvline semilogx semilogy loglog polar streamplot hexbin pcolor tricontour errorbar clabel set_aspect violinplot set_axis_off spines text hatch plt axis plt.bar() plt.axis import figure pyplot highlight_text pypalettes plt.subplots() xlabel ylabel title legend colorbar savefig tight_layout grid set_xlim set_ylim plot scatter hist boxplot imshow cmap alpha bins tick_params annotate quiver contour barh stackplot subplots_adjust axhline axvline semilogx semilogy loglog polar streamplot hexbin pcolor tricontour errorbar clabel set_aspect violinplot set_axis_off spines text hatch plt axis plt.bar() plt.axis import figure pyplot highlight_text pypalettes plt.subplots() xlabel ylabel title legend colorbar savefig tight_layout grid set_xlim set_ylim plot scatter hist boxplot imshow cmap alpha bins tick_params annotate quiver contour barh stackplot subplots_adjust axhline axvline semilogx semilogy loglog polar streamplot hexbin pcolor tricontour errorbar clabel set_aspect violinplot set_axis_off spines text hatch plt axis plt.bar() plt.axis import figure pyplot highlight_text pypalettes plt.subplots() xlabel ylabel title legend colorbar savefig tight_layout grid set_xlim set_ylim plot scatter hist boxplot imshow cmap alpha bins tick_params annotate quiver contour barh stackplot subplots_adjust axhline axvline semilogx semilogy loglog polar streamplot hexbin pcolor tricontour errorbar clabel set_aspect violinplot set_axis_off spines text hatch plt axis plt.bar() plt.axis import figure pyplot highlight_text pypalettes plt.subplots() xlabel ylabel title legend colorbar savefig tight_layout grid set_xlim set_ylim plot scatter hist boxplot imshow cmap alpha bins tick_params annotate quiver contour barh stackplot subplots_adjust axhline axvline semilogx semilogy loglog polar streamplot hexbin pcolor tricontour errorbar clabel set_aspect violinplot set_axis_off spines text hatch plt axis plt.bar() plt.axis import figure pyplot highlight_text pypalettes plt.subplots() xlabel ylabel title legend colorbar savefig tight_layout grid set_xlim set_ylim plot scatter hist boxplot imshow cmap alpha bins tick_params annotate quiver contour barh stackplot subplots_adjust axhline axvline semilogx semilogy loglog polar streamplot hexbin pcolor tricontour errorbar clabel set_aspect violinplot set_axis_off spines text hatch plt axis plt.bar() plt.axis import figure pyplot highlight_text pypalettes plt.subplots() xlabel ylabel title legend colorbar savefig tight_layout grid set_xlim set_ylim plot scatter hist boxplot imshow cmap alpha bins tick_params annotate quiver contour barh stackplot subplots_adjust axhline axvline semilogx semilogy loglog polar streamplot hexbin pcolor tricontour errorbar clabel set_aspect violinplot set_axis_off spines text hatch plt axis plt.bar() plt.axis import figure pyplot highlight_text pypalettes plt.subplots() xlabel ylabel title legend colorbar savefig tight_layout grid set_xlim set_ylim plot scatter hist boxplot imshow cmap alpha bins tick_params annotate quiver contour barh stackplot subplots_adjust axhline axvline semilogx semilogy loglog polar streamplot hexbin pcolor tricontour errorbar clabel set_aspect violinplot set_axis_off spines text hatch plt axis plt.bar() plt.axis import figure pyplot highlight_text pypalettes plt.subplots() xlabel ylabel title legend colorbar savefig tight_layout grid set_xlim set_ylim plot scatter hist boxplot imshow cmap alpha bins tick_params annotate quiver contour barh stackplot subplots_adjust axhline axvline semilogx semilogy loglog polar streamplot hexbin pcolor tricontour errorbar clabel set_aspect violinplot set_axis_off spines text hatch plt axis plt.bar() plt.axis import figure pyplot highlight_text pypalettes plt.subplots() xlabel ylabel title legend colorbar savefig tight_layout grid set_xlim set_ylim plot scatter hist boxplot imshow cmap alpha bins tick_params annotate quiver contour barh stackplot subplots_adjust axhline axvline semilogx semilogy loglog polar streamplot hexbin pcolor tricontour errorbar clabel set_aspect violinplot set_axis_off spines text hatch plt axis plt.bar() plt.axis import figure pyplot highlight_text pypalettes plt.subplots() xlabel ylabel title legend colorbar savefig tight_layout grid set_xlim set_ylim plot scatter hist boxplot imshow cmap alpha bins tick_params annotate quiver contour barh stackplot subplots_adjust axhline axvline semilogx semilogy loglog polar streamplot hexbin pcolor tricontour errorbar clabel set_aspect violinplot set_axis_off spines text hatch plt axis plt.bar() plt.axis import figure pyplot highlight_text pypalettes plt.subplots() xlabel ylabel title legend colorbar savefig tight_layout grid set_xlim set_ylim plot scatter hist boxplot imshow cmap alpha bins tick_params annotate quiver contour barh stackplot subplots_adjust axhline axvline semilogx semilogy loglog polar streamplot hexbin pcolor tricontour errorbar clabel set_aspect violinplot set_axis_off spines text hatch plt axis plt.bar() plt.axis import figure pyplot highlight_text pypalettes plt.subplots() xlabel ylabel title legend colorbar savefig tight_layout grid set_xlim set_ylim plot scatter hist boxplot imshow cmap alpha bins tick_params annotate quiver contour barh stackplot subplots_adjust axhline axvline semilogx semilogy loglog polar streamplot hexbin pcolor tricontour errorbar clabel set_aspect violinplot set_axis_off spines text hatch plt axis plt.bar() plt.axis import figure pyplot highlight_text pypalettes plt.subplots() xlabel ylabel title legend colorbar savefig tight_layout grid set_xlim set_ylim plot scatter hist boxplot imshow cmap alpha bins tick_params annotate quiver contour barh stackplot subplots_adjust axhline axvline semilogx semilogy loglog polar streamplot hexbin pcolor tricontour errorbar clabel set_aspect violinplot set_axis_off spines text hatch plt axis plt.bar() plt.axis import figure pyplot highlight_text pypalettes plt.subplots() xlabel ylabel title legend colorbar savefig tight_layout grid set_xlim set_ylim plot scatter hist boxplot imshow cmap alpha bins tick_params annotate quiver contour barh stackplot subplots_adjust axhline axvline semilogx semilogy loglog polar streamplot hexbin pcolor tricontour errorbar clabel set_aspect violinplot set_axis_off spines text hatch plt axis plt.bar() plt.axis import figure pyplot highlight_text pypalettes plt.subplots() xlabel ylabel title legend colorbar savefig tight_layout grid set_xlim set_ylim plot scatter hist boxplot imshow cmap alpha bins tick_params annotate quiver contour barh stackplot subplots_adjust axhline axvline semilogx semilogy loglog polar streamplot hexbin pcolor tricontour errorbar clabel set_aspect violinplot set_axis_off spines text hatch plt axis plt.bar() plt.axis import figure pyplot highlight_text pypalettes plt.subplots() xlabel ylabel title legend colorbar savefig tight_layout grid set_xlim set_ylim plot scatter hist boxplot imshow cmap alpha bins tick_params annotate quiver contour barh stackplot subplots_adjust axhline axvline semilogx semilogy loglog polar streamplot hexbin pcolor tricontour errorbar clabel set_aspect violinplot set_axis_off spines text hatch plt axis plt.bar() plt.axis import figure pyplot highlight_text pypalettes plt.subplots() xlabel ylabel title legend colorbar savefig tight_layout grid set_xlim set_ylim plot scatter hist boxplot imshow cmap alpha bins tick_params annotate quiver contour barh stackplot subplots_adjust axhline axvline semilogx semilogy loglog polar streamplot hexbin pcolor tricontour errorbar clabel set_aspect violinplot set_axis_off spines text hatch plt axis plt.bar() plt.axis import figure pyplot highlight_text pypalettes plt.subplots() xlabel ylabel title legend colorbar savefig tight_layout grid set_xlim set_ylim plot scatter hist boxplot imshow cmap alpha bins tick_params annotate quiver contour barh stackplot subplots_adjust axhline axvline semilogx semilogy loglog polar streamplot hexbin pcolor tricontour errorbar clabel set_aspect violinplot set_axis_off spines text hatch plt axis plt.bar() plt.axis import figure pyplot highlight_text pypalettes plt.subplots() xlabel ylabel title legend colorbar savefig tight_layout grid set_xlim set_ylim plot scatter hist boxplot imshow cmap alpha bins tick_params annotate quiver contour barh stackplot subplots_adjust axhline axvline semilogx semilogy loglog polar streamplot hexbin pcolor tricontour errorbar clabel set_aspect violinplot set_axis_off spines text hatch plt axis plt.bar() plt.axis import figure pyplot highlight_text pypalettes plt.subplots() xlabel ylabel title legend colorbar savefig tight_layout grid set_xlim set_ylim plot scatter hist boxplot imshow cmap alpha bins tick_params annotate quiver contour barh stackplot subplots_adjust axhline axvline semilogx semilogy loglog polar streamplot hexbin pcolor tricontour errorbar clabel set_aspect violinplot set_axis_off spines text hatch plt axis plt.bar() plt.axis import figure pyplot highlight_text pypalettes plt.subplots() xlabel ylabel title legend colorbar savefig tight_layout grid set_xlim set_ylim plot scatter hist boxplot imshow cmap alpha bins tick_params annotate quiver contour barh stackplot subplots_adjust axhline axvline semilogx semilogy loglog polar streamplot hexbin pcolor tricontour errorbar clabel set_aspect violinplot set_axis_off spines text hatch plt axis plt.bar() plt.axis import figure pyplot highlight_text pypalettes plt.subplots() xlabel ylabel title legend colorbar savefig tight_layout grid set_xlim set_ylim plot scatter hist boxplot imshow cmap alpha bins tick_params annotate quiver contour barh stackplot subplots_adjust axhline axvline semilogx semilogy loglog polar streamplot hexbin pcolor tricontour errorbar clabel set_aspect violinplot set_axis_off spines text hatch plt axis plt.bar() plt.axis import figure pyplot highlight_text pypalettes plt.subplots() xlabel ylabel title legend colorbar savefig tight_layout grid set_xlim set_ylim plot scatter hist boxplot imshow cmap alpha bins tick_params annotate quiver contour barh stackplot subplots_adjust axhline axvline semilogx semilogy loglog polar streamplot hexbin pcolor tricontour errorbar clabel set_aspect violinplot set_axis_off spines text hatch plt axis plt.bar() plt.axis import figure pyplot highlight_text pypalettes plt.subplots() xlabel ylabel title legend colorbar savefig tight_layout grid set_xlim set_ylim plot scatter hist boxplot imshow cmap alpha bins tick_params annotate quiver contour barh stackplot subplots_adjust axhline axvline semilogx semilogy loglog polar streamplot hexbin pcolor tricontour errorbar clabel set_aspect violinplot set_axis_off spines text hatch plt axis plt.bar() plt.axis import figure pyplot highlight_text pypalettes plt.subplots() xlabel ylabel title legend colorbar savefig tight_layout grid set_xlim set_ylim plot scatter hist boxplot imshow cmap alpha bins tick_params annotate quiver contour barh stackplot subplots_adjust axhline axvline semilogx semilogy loglog polar streamplot hexbin pcolor tricontour errorbar clabel set_aspect violinplot set_axis_off spines text hatch plt axis plt.bar() plt.axis import figure pyplot highlight_text pypalettes plt.subplots() xlabel ylabel title legend colorbar savefig tight_layout grid set_xlim set_ylim plot scatter hist boxplot imshow cmap alpha bins tick_params annotate quiver contour barh stackplot subplots_adjust axhline axvline semilogx semilogy loglog polar streamplot hexbin pcolor tricontour errorbar clabel set_aspect violinplot set_axis_off spines text hatch plt axis plt.bar() plt.axis import figure pyplot highlight_text pypalettes plt.subplots() xlabel ylabel title legend colorbar savefig tight_layout grid set_xlim set_ylim plot scatter hist boxplot imshow cmap alpha bins tick_params annotate quiver contour barh stackplot subplots_adjust axhline axvline semilogx semilogy loglog polar streamplot hexbin pcolor tricontour errorbar clabel set_aspect violinplot set_axis_off spines text hatch plt axis plt.bar() plt.axis import figure pyplot highlight_text pypalettes plt.subplots() xlabel ylabel title legend colorbar savefig tight_layout grid set_xlim set_ylim plot scatter hist boxplot imshow cmap alpha bins tick_params annotate quiver contour barh stackplot subplots_adjust axhline axvline semilogx semilogy loglog polar streamplot hexbin pcolor tricontour errorbar clabel set_aspect violinplot set_axis_off spines text hatch plt axis plt.bar() plt.axis import figure pyplot highlight_text pypalettes plt.subplots() xlabel ylabel title legend colorbar savefig tight_layout grid set_xlim set_ylim plot scatter hist boxplot imshow cmap alpha bins tick_params annotate quiver contour barh stackplot subplots_adjust axhline axvline semilogx semilogy loglog polar streamplot hexbin pcolor tricontour errorbar clabel set_aspect violinplot set_axis_off spines text hatch plt axis plt.bar() plt.axis import figure pyplot highlight_text pypalettes plt.subplots() xlabel ylabel title legend colorbar savefig tight_layout grid set_xlim set_ylim plot scatter hist boxplot imshow cmap alpha bins tick_params annotate quiver contour barh stackplot subplots_adjust axhline axvline semilogx semilogy loglog polar streamplot hexbin pcolor tricontour errorbar clabel set_aspect violinplot set_axis_off spines text hatch plt axis plt.bar() plt.axis import figure pyplot highlight_text pypalettes plt.subplots() xlabel ylabel title legend colorbar savefig tight_layout grid set_xlim set_ylim plot scatter hist boxplot imshow cmap alpha bins tick_params annotate quiver contour barh stackplot subplots_adjust axhline axvline semilogx semilogy loglog polar streamplot hexbin pcolor tricontour errorbar clabel set_aspect violinplot set_axis_off spines text hatch plt axis plt.bar() plt.axis import figure pyplot highlight_text pypalettes plt.subplots() xlabel ylabel title legend colorbar savefig tight_layout grid set_xlim set_ylim plot scatter hist boxplot imshow cmap alpha bins tick_params annotate quiver contour barh stackplot subplots_adjust axhline axvline semilogx semilogy loglog polar streamplot hexbin pcolor tricontour errorbar clabel set_aspect violinplot set_axis_off spines text hatch plt axis plt.bar() plt.axis import figure pyplot highlight_text pypalettes plt.subplots() xlabel ylabel title legend colorbar savefig tight_layout grid set_xlim set_ylim plot scatter hist boxplot imshow cmap alpha bins tick_params annotate quiver contour barh stackplot subplots_adjust axhline axvline semilogx semilogy loglog polar streamplot hexbin pcolor tricontour errorbar clabel set_aspect violinplot set_axis_off spines text hatch plt axis plt.bar() plt.axis import figure pyplot highlight_text pypalettes plt.subplots() xlabel ylabel title legend colorbar savefig tight_layout grid set_xlim set_ylim plot scatter hist boxplot imshow cmap alpha bins tick_params annotate quiver contour barh stackplot subplots_adjust axhline axvline semilogx semilogy loglog polar streamplot hexbin pcolor tricontour errorbar clabel set_aspect violinplot set_axis_off spines text hatch plt axis plt.bar() plt.axis import figure pyplot highlight_text pypalettes plt.subplots() xlabel ylabel title legend colorbar savefig tight_layout grid set_xlim set_ylim plot scatter hist boxplot imshow cmap alpha bins tick_params annotate quiver contour barh stackplot subplots_adjust axhline axvline semilogx semilogy loglog polar streamplot hexbin pcolor tricontour errorbar clabel set_aspect violinplot set_axis_off spines text hatch plt axis plt.bar() plt.axis import figure pyplot highlight_text pypalettes plt.subplots() xlabel ylabel title legend colorbar savefig tight_layout grid set_xlim set_ylim plot scatter hist boxplot imshow cmap alpha bins tick_params annotate quiver contour barh stackplot subplots_adjust axhline axvline semilogx semilogy loglog polar streamplot hexbin pcolor tricontour errorbar clabel set_aspect violinplot set_axis_off spines text hatch plt axis plt.bar() plt.axis import figure pyplot highlight_text pypalettes plt.subplots() xlabel ylabel title legend colorbar savefig tight_layout grid set_xlim set_ylim plot scatter hist boxplot imshow cmap alpha bins tick_params annotate quiver contour barh stackplot subplots_adjust axhline axvline semilogx semilogy loglog polar streamplot hexbin pcolor tricontour errorbar clabel set_aspect violinplot set_axis_off spines text hatch plt axis plt.bar() plt.axis import figure pyplot highlight_text pypalettes plt.subplots() xlabel ylabel title legend colorbar savefig tight_layout grid set_xlim set_ylim plot scatter hist boxplot imshow cmap alpha bins tick_params annotate quiver contour barh stackplot subplots_adjust axhline axvline semilogx semilogy loglog polar streamplot hexbin pcolor tricontour errorbar clabel set_aspect violinplot set_axis_off spines text hatch plt axis plt.bar() plt.axis import figure pyplot highlight_text pypalettes plt.subplots() xlabel ylabel title legend colorbar savefig tight_layout grid set_xlim set_ylim plot scatter hist boxplot imshow cmap alpha bins tick_params annotate quiver contour barh stackplot subplots_adjust axhline axvline semilogx semilogy loglog polar streamplot hexbin pcolor tricontour errorbar clabel set_aspect violinplot set_axis_off spines text hatch plt axis plt.bar() plt.axis import figure pyplot highlight_text pypalettes plt.subplots() xlabel ylabel title legend colorbar savefig tight_layout grid set_xlim set_ylim plot scatter hist boxplot imshow cmap alpha bins tick_params annotate quiver contour barh stackplot subplots_adjust axhline axvline semilogx semilogy loglog polar streamplot hexbin pcolor tricontour errorbar clabel set_aspect violinplot set_axis_off spines text hatch plt axis plt.bar() plt.axis import figure pyplot highlight_text pypalettes plt.subplots() xlabel ylabel title legend colorbar savefig tight_layout grid set_xlim set_ylim plot scatter hist boxplot imshow cmap alpha bins tick_params annotate quiver contour barh stackplot subplots_adjust axhline axvline semilogx semilogy loglog polar streamplot hexbin pcolor tricontour errorbar clabel set_aspect violinplot set_axis_off spines text hatch plt axis plt.bar() plt.axis import figure pyplot highlight_text pypalettes plt.subplots() xlabel ylabel title legend colorbar savefig tight_layout grid set_xlim set_ylim plot scatter hist boxplot imshow cmap alpha bins tick_params annotate quiver contour barh stackplot subplots_adjust axhline axvline semilogx semilogy loglog polar streamplot hexbin pcolor tricontour errorbar clabel set_aspect violinplot set_axis_off spines text hatch plt axis plt.bar() plt.axis import figure pyplot highlight_text pypalettes plt.subplots() xlabel ylabel title legend colorbar savefig tight_layout grid set_xlim set_ylim plot scatter hist boxplot imshow cmap alpha bins tick_params annotate quiver contour barh stackplot subplots_adjust axhline axvline semilogx semilogy loglog polar streamplot hexbin pcolor tricontour errorbar clabel set_aspect violinplot set_axis_off spines text hatch plt axis plt.bar() plt.axis import figure pyplot highlight_text pypalettes plt.subplots() xlabel ylabel title legend colorbar savefig tight_layout grid set_xlim set_ylim plot scatter hist boxplot imshow cmap alpha bins tick_params annotate quiver contour barh stackplot subplots_adjust axhline axvline semilogx semilogy loglog polar streamplot hexbin pcolor tricontour errorbar clabel set_aspect violinplot set_axis_off spines text hatch plt axis plt.bar() plt.axis import figure pyplot highlight_text pypalettes plt.subplots() xlabel ylabel title legend colorbar savefig tight_layout grid set_xlim set_ylim plot scatter hist boxplot imshow cmap alpha bins tick_params annotate quiver contour barh stackplot subplots_adjust axhline axvline semilogx semilogy loglog polar streamplot hexbin pcolor tricontour errorbar clabel set_aspect violinplot set_axis_off spines text hatch plt axis plt.bar() plt.axis import figure pyplot highlight_text pypalettes plt.subplots() xlabel ylabel title legend colorbar savefig tight_layout grid set_xlim set_ylim plot scatter hist boxplot imshow cmap alpha bins tick_params annotate quiver contour barh stackplot subplots_adjust axhline axvline semilogx semilogy loglog polar streamplot hexbin pcolor tricontour errorbar clabel set_aspect violinplot set_axis_off spines text hatch plt axis plt.bar() plt.axis import figure pyplot highlight_text pypalettes plt.subplots() xlabel ylabel title legend colorbar savefig tight_layout grid set_xlim set_ylim plot scatter hist boxplot imshow cmap alpha bins tick_params annotate quiver contour barh stackplot subplots_adjust axhline axvline semilogx semilogy loglog polar streamplot hexbin pcolor tricontour errorbar clabel set_aspect violinplot set_axis_off spines text hatch plt axis plt.bar() plt.axis import figure pyplot highlight_text pypalettes plt.subplots() xlabel ylabel title legend colorbar savefig tight_layout grid set_xlim set_ylim plot scatter hist boxplot imshow cmap alpha bins tick_params annotate quiver contour barh stackplot subplots_adjust axhline axvline semilogx semilogy loglog polar streamplot hexbin pcolor tricontour errorbar clabel set_aspect violinplot set_axis_off spines text hatch plt axis plt.bar() plt.axis import figure pyplot highlight_text pypalettes plt.subplots() xlabel ylabel title legend colorbar savefig tight_layout grid set_xlim set_ylim plot scatter hist boxplot imshow cmap alpha bins tick_params annotate quiver contour barh stackplot subplots_adjust axhline axvline semilogx semilogy loglog polar streamplot hexbin pcolor tricontour errorbar clabel set_aspect violinplot set_axis_off spines text hatch plt axis plt.bar() plt.axis import figure pyplot highlight_text pypalettes plt.subplots() xlabel ylabel title legend colorbar savefig tight_layout grid set_xlim set_ylim plot scatter hist boxplot imshow cmap alpha bins tick_params annotate quiver contour barh stackplot subplots_adjust axhline axvline semilogx semilogy loglog polar streamplot hexbin pcolor tricontour errorbar clabel set_aspect violinplot set_axis_off spines text hatch plt axis plt.bar() plt.axis import figure pyplot highlight_text pypalettes plt.subplots() xlabel ylabel title legend colorbar savefig tight_layout grid set_xlim set_ylim plot scatter hist boxplot imshow cmap alpha bins tick_params annotate quiver contour barh stackplot subplots_adjust axhline axvline semilogx semilogy loglog polar streamplot hexbin pcolor tricontour errorbar clabel set_aspect violinplot set_axis_off spines text hatch plt axis plt.bar() plt.axis import figure pyplot highlight_text pypalettes plt.subplots() xlabel ylabel title legend colorbar savefig tight_layout grid set_xlim set_ylim plot scatter hist boxplot imshow cmap alpha bins tick_params annotate quiver contour barh stackplot subplots_adjust axhline axvline semilogx semilogy loglog polar streamplot hexbin pcolor tricontour errorbar clabel set_aspect violinplot set_axis_off spines text hatch plt axis plt.bar() plt.axis import figure pyplot highlight_text pypalettes plt.subplots() xlabel ylabel title legend colorbar savefig tight_layout grid set_xlim set_ylim plot scatter hist boxplot imshow cmap alpha bins tick_params annotate quiver contour barh stackplot subplots_adjust axhline axvline semilogx semilogy loglog polar streamplot hexbin pcolor tricontour errorbar clabel set_aspect violinplot set_axis_off spines text hatch plt axis plt.bar() plt.axis import figure pyplot highlight_text pypalettes plt.subplots() xlabel ylabel title legend colorbar savefig tight_layout grid set_xlim set_ylim plot scatter hist boxplot imshow cmap alpha bins tick_params annotate quiver contour barh stackplot subplots_adjust axhline axvline semilogx semilogy loglog polar streamplot hexbin pcolor tricontour errorbar clabel set_aspect violinplot set_axis_off spines text hatch plt axis plt.bar() plt.axis import figure pyplot highlight_text pypalettes plt.subplots() xlabel ylabel title legend colorbar savefig tight_layout grid set_xlim set_ylim plot scatter hist boxplot imshow cmap alpha bins tick_params annotate quiver contour barh stackplot subplots_adjust axhline axvline semilogx semilogy loglog polar streamplot hexbin pcolor tricontour errorbar clabel set_aspect violinplot set_axis_off spines text hatch plt axis plt.bar() plt.axis import figure pyplot highlight_text pypalettes plt.subplots() xlabel ylabel title legend colorbar savefig tight_layout grid set_xlim set_ylim plot scatter hist boxplot imshow cmap alpha bins tick_params annotate quiver contour barh stackplot subplots_adjust axhline axvline semilogx semilogy loglog polar streamplot hexbin pcolor tricontour errorbar clabel set_aspect violinplot set_axis_off spines text hatch plt axis plt.bar() plt.axis import figure pyplot highlight_text pypalettes plt.subplots() xlabel ylabel title legend colorbar savefig tight_layout grid set_xlim set_ylim plot scatter hist boxplot imshow cmap alpha bins tick_params annotate quiver contour barh stackplot subplots_adjust axhline axvline semilogx semilogy loglog polar streamplot hexbin pcolor tricontour errorbar clabel set_aspect violinplot set_axis_off spines text hatch plt axis plt.bar() plt.axis import figure pyplot highlight_text pypalettes plt.subplots() xlabel ylabel title legend colorbar savefig tight_layout grid set_xlim set_ylim plot scatter hist boxplot imshow cmap alpha bins tick_params annotate quiver contour barh stackplot subplots_adjust axhline axvline semilogx semilogy loglog polar streamplot hexbin pcolor tricontour errorbar clabel set_aspect violinplot set_axis_off spines text hatch plt axis plt.bar() plt.axis import figure pyplot highlight_text pypalettes plt.subplots() xlabel ylabel title legend colorbar savefig tight_layout grid set_xlim set_ylim plot scatter hist boxplot imshow cmap alpha bins tick_params annotate quiver contour barh stackplot subplots_adjust axhline axvline semilogx semilogy loglog polar streamplot hexbin pcolor tricontour errorbar clabel set_aspect violinplot set_axis_off spines text hatch plt axis plt.bar() plt.axis import figure pyplot highlight_text pypalettes plt.subplots() xlabel ylabel title legend colorbar savefig tight_layout grid set_xlim set_ylim plot scatter hist boxplot imshow cmap alpha bins tick_params annotate quiver contour barh stackplot subplots_adjust axhline axvline semilogx semilogy loglog polar streamplot hexbin pcolor tricontour errorbar clabel set_aspect violinplot set_axis_off spines text hatch plt axis plt.bar() plt.axis import figure pyplot highlight_text pypalettes plt.subplots() xlabel ylabel title legend colorbar savefig tight_layout grid set_xlim set_ylim plot scatter hist boxplot imshow cmap alpha bins tick_params annotate quiver contour barh stackplot subplots_adjust axhline axvline semilogx semilogy loglog polar streamplot hexbin pcolor tricontour errorbar clabel set_aspect violinplot set_axis_off spines text hatch plt axis plt.bar() plt.axis import figure pyplot highlight_text pypalettes plt.subplots() xlabel ylabel title legend colorbar savefig tight_layout grid set_xlim set_ylim plot scatter hist boxplot imshow cmap alpha bins tick_params annotate quiver contour barh stackplot subplots_adjust axhline axvline semilogx semilogy loglog polar streamplot hexbin pcolor tricontour errorbar clabel set_aspect violinplot set_axis_off spines text hatch plt axis plt.bar() plt.axis import figure pyplot highlight_text pypalettes plt.subplots() xlabel ylabel title legend colorbar savefig tight_layout grid set_xlim set_ylim plot scatter hist boxplot imshow cmap alpha bins tick_params annotate quiver contour barh stackplot subplots_adjust axhline axvline semilogx semilogy loglog polar streamplot hexbin pcolor tricontour errorbar clabel set_aspect violinplot set_axis_off spines text hatch plt axis plt.bar() plt.axis import figure pyplot highlight_text pypalettes plt.subplots() xlabel ylabel title legend colorbar savefig tight_layout grid set_xlim set_ylim plot scatter hist boxplot imshow cmap alpha bins tick_params annotate quiver contour barh stackplot subplots_adjust axhline axvline semilogx semilogy loglog polar streamplot hexbin pcolor tricontour errorbar clabel set_aspect violinplot set_axis_off spines text hatch plt axis plt.bar() plt.axis import figure pyplot highlight_text pypalettes plt.subplots() xlabel ylabel title legend colorbar savefig tight_layout grid set_xlim set_ylim plot scatter hist boxplot imshow cmap alpha bins tick_params annotate quiver contour barh stackplot subplots_adjust axhline axvline semilogx semilogy loglog polar streamplot hexbin pcolor tricontour errorbar clabel set_aspect violinplot set_axis_off spines text hatch plt axis plt.bar() plt.axis import figure pyplot highlight_text pypalettes plt.subplots() xlabel ylabel title legend colorbar savefig tight_layout grid set_xlim set_ylim plot scatter hist boxplot imshow cmap alpha bins tick_params annotate quiver contour barh stackplot subplots_adjust axhline axvline semilogx semilogy loglog polar streamplot hexbin pcolor tricontour errorbar clabel set_aspect violinplot set_axis_off spines text hatch plt axis plt.bar() plt.axis import figure pyplot highlight_text pypalettes plt.subplots() xlabel ylabel title legend colorbar savefig tight_layout grid set_xlim set_ylim plot scatter hist boxplot imshow cmap alpha bins tick_params annotate quiver contour barh stackplot subplots_adjust axhline axvline semilogx semilogy loglog polar streamplot hexbin pcolor tricontour errorbar clabel set_aspect violinplot set_axis_off spines text hatch plt axis plt.bar() plt.axis import figure pyplot highlight_text pypalettes plt.subplots() xlabel ylabel title legend colorbar savefig tight_layout grid set_xlim set_ylim plot scatter hist boxplot imshow cmap alpha bins tick_params annotate quiver contour barh stackplot subplots_adjust axhline axvline semilogx semilogy loglog polar streamplot hexbin pcolor tricontour errorbar clabel set_aspect violinplot set_axis_off spines text hatch plt axis plt.bar() plt.axis import figure pyplot highlight_text pypalettes plt.subplots() xlabel ylabel title legend colorbar savefig tight_layout grid set_xlim set_ylim plot scatter hist boxplot imshow cmap alpha bins tick_params annotate quiver contour barh stackplot subplots_adjust axhline axvline semilogx semilogy loglog polar streamplot hexbin pcolor tricontour errorbar clabel set_aspect violinplot set_axis_off spines text hatch plt axis plt.bar() plt.axis import figure pyplot highlight_text pypalettes plt.subplots() xlabel ylabel title legend colorbar savefig tight_layout grid set_xlim set_ylim plot scatter hist boxplot imshow cmap alpha bins tick_params annotate quiver contour barh stackplot subplots_adjust axhline axvline semilogx semilogy loglog polar streamplot hexbin pcolor tricontour errorbar clabel set_aspect violinplot set_axis_off spines text hatch plt axis plt.bar() plt.axis import figure pyplot highlight_text pypalettes plt.subplots() xlabel ylabel title legend colorbar savefig tight_layout grid set_xlim set_ylim plot scatter hist boxplot imshow cmap alpha bins tick_params annotate quiver contour barh stackplot subplots_adjust axhline axvline semilogx semilogy loglog polar streamplot hexbin pcolor tricontour errorbar clabel set_aspect violinplot set_axis_off spines text hatch plt axis plt.bar() plt.axis import figure pyplot highlight_text pypalettes plt.subplots() xlabel ylabel title legend colorbar savefig tight_layout grid set_xlim set_ylim plot scatter hist boxplot imshow cmap alpha bins tick_params annotate quiver contour barh stackplot subplots_adjust axhline axvline semilogx semilogy loglog polar streamplot hexbin pcolor tricontour errorbar clabel set_aspect violinplot set_axis_off spines text hatch plt axis plt.bar() plt.axis import figure pyplot highlight_text pypalettes plt.subplots() xlabel ylabel title legend colorbar savefig tight_layout grid set_xlim set_ylim plot scatter hist boxplot imshow cmap alpha bins tick_params annotate quiver contour barh stackplot subplots_adjust axhline axvline semilogx semilogy loglog polar streamplot hexbin pcolor tricontour errorbar clabel set_aspect violinplot set_axis_off spines text hatch plt axis plt.bar() plt.axis import figure pyplot highlight_text pypalettes plt.subplots() xlabel ylabel title legend colorbar savefig tight_layout grid set_xlim set_ylim plot scatter hist boxplot imshow cmap alpha bins tick_params annotate quiver contour barh stackplot subplots_adjust axhline axvline semilogx semilogy loglog polar streamplot hexbin pcolor tricontour errorbar clabel set_aspect violinplot set_axis_off spines text hatch plt axis plt.bar() plt.axis import figure pyplot highlight_text pypalettes plt.subplots() xlabel ylabel title legend colorbar savefig tight_layout grid set_xlim set_ylim plot scatter hist boxplot imshow cmap alpha bins tick_params annotate quiver contour barh stackplot subplots_adjust axhline axvline semilogx semilogy loglog polar streamplot hexbin pcolor tricontour errorbar clabel set_aspect violinplot set_axis_off spines text hatch plt axis plt.bar() plt.axis import figure pyplot highlight_text pypalettes plt.subplots() xlabel ylabel title legend colorbar savefig tight_layout grid set_xlim set_ylim plot scatter hist boxplot imshow cmap alpha bins tick_params annotate quiver contour barh stackplot subplots_adjust axhline axvline semilogx semilogy loglog polar streamplot hexbin pcolor tricontour errorbar clabel set_aspect violinplot set_axis_off spines text hatch plt axis plt.bar() plt.axis import figure pyplot highlight_text pypalettes plt.subplots() xlabel ylabel title legend colorbar savefig tight_layout grid set_xlim set_ylim plot scatter hist boxplot imshow cmap alpha bins tick_params annotate quiver contour barh stackplot subplots_adjust axhline axvline semilogx semilogy loglog polar streamplot hexbin pcolor tricontour errorbar clabel set_aspect violinplot set_axis_off spines text hatch plt axis plt.bar() plt.axis import figure pyplot highlight_text pypalettes plt.subplots() xlabel ylabel title legend colorbar savefig tight_layout grid set_xlim set_ylim plot scatter hist boxplot imshow cmap alpha bins tick_params annotate quiver contour barh stackplot subplots_adjust axhline axvline semilogx semilogy loglog polar streamplot hexbin pcolor tricontour errorbar clabel set_aspect violinplot set_axis_off spines text hatch plt axis plt.bar() plt.axis import figure pyplot highlight_text pypalettes plt.subplots() xlabel ylabel title legend colorbar savefig tight_layout grid set_xlim set_ylim plot scatter hist boxplot imshow cmap alpha bins tick_params annotate quiver contour barh stackplot subplots_adjust axhline axvline semilogx semilogy loglog polar streamplot hexbin pcolor tricontour errorbar clabel set_aspect violinplot set_axis_off spines text hatch plt axis plt.bar() plt.axis import figure pyplot highlight_text pypalettes plt.subplots() xlabel ylabel title legend colorbar savefig tight_layout grid set_xlim set_ylim plot scatter hist boxplot imshow cmap alpha bins tick_params annotate quiver contour barh stackplot subplots_adjust axhline axvline semilogx semilogy loglog polar streamplot hexbin pcolor tricontour errorbar clabel set_aspect violinplot set_axis_off spines text hatch plt axis plt.bar() plt.axis import figure pyplot highlight_text pypalettes plt.subplots() xlabel ylabel title legend colorbar savefig tight_layout grid set_xlim set_ylim plot scatter hist boxplot imshow cmap alpha bins tick_params annotate quiver contour barh stackplot subplots_adjust axhline axvline semilogx semilogy loglog polar streamplot hexbin pcolor tricontour errorbar clabel set_aspect violinplot set_axis_off spines text hatch plt axis plt.bar() plt.axis import figure pyplot highlight_text pypalettes plt.subplots() xlabel ylabel title legend colorbar savefig tight_layout grid set_xlim set_ylim plot scatter hist boxplot imshow cmap alpha bins tick_params annotate quiver contour barh stackplot subplots_adjust axhline axvline semilogx semilogy loglog polar streamplot hexbin pcolor tricontour errorbar clabel set_aspect violinplot set_axis_off spines text hatch plt axis plt.bar() plt.axis import figure pyplot highlight_text pypalettes plt.subplots() xlabel ylabel title legend colorbar savefig tight_layout grid set_xlim set_ylim plot scatter hist boxplot imshow cmap alpha bins tick_params annotate quiver contour barh stackplot subplots_adjust axhline axvline semilogx semilogy loglog polar streamplot hexbin pcolor tricontour errorbar clabel set_aspect violinplot set_axis_off spines text hatch plt axis plt.bar() plt.axis import figure pyplot highlight_text pypalettes plt.subplots() xlabel ylabel title legend colorbar savefig tight_layout grid set_xlim set_ylim plot scatter hist boxplot imshow cmap alpha bins tick_params annotate quiver contour barh stackplot subplots_adjust axhline axvline semilogx semilogy loglog polar streamplot hexbin pcolor tricontour errorbar clabel set_aspect violinplot set_axis_off spines text hatch plt axis plt.bar() plt.axis import figure pyplot highlight_text pypalettes plt.subplots() xlabel ylabel title legend colorbar savefig tight_layout grid set_xlim set_ylim plot scatter hist boxplot imshow cmap alpha bins tick_params annotate quiver contour barh stackplot subplots_adjust axhline axvline semilogx semilogy loglog polar streamplot hexbin pcolor tricontour errorbar clabel set_aspect violinplot set_axis_off spines text hatch plt axis plt.bar() plt.axis import figure pyplot highlight_text pypalettes plt.subplots() xlabel ylabel title legend colorbar savefig tight_layout grid set_xlim set_ylim plot scatter hist boxplot imshow cmap alpha bins tick_params annotate quiver contour barh stackplot subplots_adjust axhline axvline semilogx semilogy loglog polar streamplot hexbin pcolor tricontour errorbar clabel set_aspect violinplot set_axis_off spines text hatch plt axis plt.bar() plt.axis import figure pyplot highlight_text pypalettes plt.subplots() xlabel ylabel title legend colorbar savefig tight_layout grid set_xlim set_ylim plot scatter hist boxplot imshow cmap alpha bins tick_params annotate quiver contour barh stackplot subplots_adjust axhline axvline semilogx semilogy loglog polar streamplot hexbin pcolor tricontour errorbar clabel set_aspect violinplot set_axis_off spines text hatch plt axis plt.bar() plt.axis import figure pyplot highlight_text pypalettes plt.subplots() xlabel ylabel title legend colorbar savefig tight_layout grid set_xlim set_ylim plot scatter hist boxplot imshow cmap alpha bins tick_params annotate quiver contour barh stackplot subplots_adjust axhline axvline semilogx semilogy loglog polar streamplot hexbin pcolor tricontour errorbar clabel set_aspect violinplot set_axis_off spines text hatch plt axis plt.bar() plt.axis import figure pyplot highlight_text pypalettes plt.subplots() xlabel ylabel title legend colorbar savefig tight_layout grid set_xlim set_ylim plot scatter hist boxplot imshow cmap alpha bins tick_params annotate quiver contour barh stackplot subplots_adjust axhline axvline semilogx semilogy loglog polar streamplot hexbin pcolor tricontour errorbar clabel set_aspect violinplot set_axis_off spines text hatch plt axis plt.bar() plt.axis import figure pyplot highlight_text pypalettes plt.subplots() xlabel ylabel title legend colorbar savefig tight_layout grid set_xlim set_ylim plot scatter hist boxplot imshow cmap alpha bins tick_params annotate quiver contour barh stackplot subplots_adjust axhline axvline semilogx semilogy loglog polar streamplot hexbin pcolor tricontour errorbar clabel set_aspect violinplot set_axis_off spines text hatch plt axis plt.bar() plt.axis import figure pyplot highlight_text pypalettes plt.subplots() xlabel ylabel title legend colorbar savefig tight_layout grid set_xlim set_ylim plot scatter hist boxplot imshow cmap alpha bins tick_params annotate quiver contour barh stackplot subplots_adjust axhline axvline semilogx semilogy loglog polar streamplot hexbin pcolor tricontour errorbar clabel set_aspect violinplot set_axis_off spines text hatch plt axis plt.bar() plt.axis import figure pyplot highlight_text pypalettes plt.subplots() xlabel ylabel title legend colorbar savefig tight_layout grid set_xlim set_ylim plot scatter hist boxplot imshow cmap alpha bins tick_params annotate quiver contour barh stackplot subplots_adjust axhline axvline semilogx semilogy loglog polar streamplot hexbin pcolor tricontour errorbar clabel set_aspect violinplot set_axis_off spines text hatch plt axis plt.bar() plt.axis import figure pyplot highlight_text pypalettes plt.subplots() xlabel ylabel title legend colorbar savefig tight_layout grid set_xlim set_ylim plot scatter hist boxplot imshow cmap alpha bins tick_params annotate quiver contour barh stackplot subplots_adjust axhline axvline semilogx semilogy loglog polar streamplot hexbin pcolor tricontour errorbar clabel set_aspect violinplot set_axis_off spines text hatch plt axis plt.bar() plt.axis import figure pyplot highlight_text pypalettes plt.subplots() xlabel ylabel title legend colorbar savefig tight_layout grid set_xlim set_ylim plot scatter hist boxplot imshow cmap alpha bins tick_params annotate quiver contour barh stackplot subplots_adjust axhline axvline semilogx semilogy loglog polar streamplot hexbin pcolor tricontour errorbar clabel set_aspect violinplot set_axis_off spines text hatch plt axis plt.bar() plt.axis import figure pyplot highlight_text pypalettes plt.subplots() xlabel ylabel title legend colorbar savefig tight_layout grid set_xlim set_ylim plot scatter hist boxplot imshow cmap alpha bins tick_params annotate quiver contour barh stackplot subplots_adjust axhline axvline semilogx semilogy loglog polar streamplot hexbin pcolor tricontour errorbar clabel set_aspect violinplot set_axis_off spines text hatch plt axis plt.bar() plt.axis import figure pyplot highlight_text pypalettes plt.subplots() xlabel ylabel title legend colorbar savefig tight_layout grid set_xlim set_ylim plot scatter hist boxplot imshow cmap alpha bins tick_params annotate quiver contour barh stackplot subplots_adjust axhline axvline semilogx semilogy loglog polar streamplot hexbin pcolor tricontour errorbar clabel set_aspect violinplot set_axis_off spines text hatch plt axis plt.bar() plt.axis import figure pyplot highlight_text pypalettes plt.subplots() xlabel ylabel title legend colorbar savefig tight_layout grid set_xlim set_ylim plot scatter hist boxplot imshow cmap alpha bins tick_params annotate quiver contour barh stackplot subplots_adjust axhline axvline semilogx semilogy loglog polar streamplot hexbin pcolor tricontour errorbar clabel set_aspect violinplot set_axis_off spines text hatch plt axis plt.bar() plt.axis import figure pyplot highlight_text pypalettes plt.subplots() xlabel ylabel title legend colorbar savefig tight_layout grid set_xlim set_ylim plot scatter hist boxplot imshow cmap alpha bins tick_params annotate quiver contour barh stackplot subplots_adjust axhline axvline semilogx semilogy loglog polar streamplot hexbin pcolor tricontour errorbar clabel set_aspect violinplot set_axis_off spines text hatch plt axis plt.bar() plt.axis import figure pyplot highlight_text pypalettes plt.subplots() xlabel ylabel title legend colorbar savefig tight_layout grid set_xlim set_ylim plot scatter hist boxplot imshow cmap alpha bins tick_params annotate quiver contour barh stackplot subplots_adjust axhline axvline semilogx semilogy loglog polar streamplot hexbin pcolor tricontour errorbar clabel set_aspect violinplot set_axis_off spines text hatch plt axis plt.bar() plt.axis import figure pyplot highlight_text pypalettes plt.subplots() xlabel ylabel title legend colorbar savefig tight_layout grid set_xlim set_ylim plot scatter hist boxplot imshow cmap alpha bins tick_params annotate quiver contour barh stackplot subplots_adjust axhline axvline semilogx semilogy loglog polar streamplot hexbin pcolor tricontour errorbar clabel set_aspect violinplot set_axis_off spines text hatch plt axis plt.bar() plt.axis import figure pyplot highlight_text pypalettes plt.subplots() xlabel ylabel title legend colorbar savefig tight_layout grid set_xlim set_ylim plot scatter hist boxplot imshow cmap alpha bins tick_params annotate quiver contour barh stackplot subplots_adjust axhline axvline semilogx semilogy loglog polar streamplot hexbin pcolor tricontour errorbar clabel set_aspect violinplot set_axis_off spines text hatch plt axis plt.bar() plt.axis import figure pyplot highlight_text pypalettes plt.subplots() xlabel ylabel title legend colorbar savefig tight_layout grid set_xlim set_ylim plot scatter hist boxplot imshow cmap alpha bins tick_params annotate quiver contour barh stackplot subplots_adjust axhline axvline semilogx semilogy loglog polar streamplot hexbin pcolor tricontour errorbar clabel set_aspect violinplot set_axis_off spines text hatch plt axis plt.bar() plt.axis import figure pyplot highlight_text pypalettes plt.subplots() xlabel ylabel title legend colorbar savefig tight_layout grid set_xlim set_ylim plot scatter hist boxplot imshow cmap alpha bins tick_params annotate quiver contour barh stackplot subplots_adjust axhline axvline semilogx semilogy loglog polar streamplot hexbin pcolor tricontour errorbar clabel set_aspect violinplot set_axis_off spines text hatch plt axis plt.bar() plt.axis import figure pyplot highlight_text pypalettes plt.subplots() xlabel ylabel title legend colorbar savefig tight_layout grid set_xlim set_ylim plot scatter hist boxplot imshow cmap alpha bins tick_params annotate quiver contour barh stackplot subplots_adjust axhline axvline semilogx semilogy loglog polar streamplot hexbin pcolor tricontour errorbar clabel set_aspect violinplot set_axis_off spines text hatch plt axis plt.bar() plt.axis import figure pyplot highlight_text pypalettes plt.subplots() xlabel ylabel title legend colorbar savefig tight_layout grid set_xlim set_ylim plot scatter hist boxplot imshow cmap alpha bins tick_params annotate quiver contour barh stackplot subplots_adjust axhline axvline semilogx semilogy loglog polar streamplot hexbin pcolor tricontour errorbar clabel set_aspect violinplot set_axis_off spines text hatch plt axis plt.bar() plt.axis import figure pyplot highlight_text pypalettes plt.subplots() xlabel ylabel title legend colorbar savefig tight_layout grid set_xlim set_ylim plot scatter hist boxplot imshow cmap alpha bins tick_params annotate quiver contour barh stackplot subplots_adjust axhline axvline semilogx semilogy loglog polar streamplot hexbin pcolor tricontour errorbar clabel set_aspect violinplot set_axis_off spines text hatch plt axis plt.bar() plt.axis import figure pyplot highlight_text pypalettes plt.subplots() xlabel ylabel title legend colorbar savefig tight_layout grid set_xlim set_ylim plot scatter hist boxplot imshow cmap alpha bins tick_params annotate quiver contour barh stackplot subplots_adjust axhline axvline semilogx semilogy loglog polar streamplot hexbin pcolor tricontour errorbar clabel set_aspect violinplot set_axis_off spines text hatch plt axis plt.bar() plt.axis import figure pyplot highlight_text pypalettes plt.subplots() xlabel ylabel title legend colorbar savefig tight_layout grid set_xlim set_ylim plot scatter hist boxplot imshow cmap alpha bins tick_params annotate quiver contour barh stackplot subplots_adjust axhline axvline semilogx semilogy loglog polar streamplot hexbin pcolor tricontour errorbar clabel set_aspect violinplot set_axis_off spines text hatch plt axis plt.bar() plt.axis import figure pyplot highlight_text pypalettes plt.subplots() xlabel ylabel title legend colorbar savefig tight_layout grid set_xlim set_ylim plot scatter hist boxplot imshow cmap alpha bins tick_params annotate quiver contour barh stackplot subplots_adjust axhline axvline semilogx semilogy loglog polar streamplot hexbin pcolor tricontour errorbar clabel set_aspect violinplot set_axis_off spines text hatch plt axis plt.bar() plt.axis import figure pyplot highlight_text pypalettes plt.subplots() xlabel ylabel title legend colorbar savefig tight_layout grid set_xlim set_ylim plot scatter hist boxplot imshow cmap alpha bins tick_params annotate quiver contour barh stackplot subplots_adjust axhline axvline semilogx semilogy loglog polar streamplot hexbin pcolor tricontour errorbar clabel set_aspect violinplot set_axis_off spines text hatch plt axis plt.bar() plt.axis import figure pyplot highlight_text pypalettes plt.subplots() xlabel ylabel title legend colorbar savefig tight_layout grid set_xlim set_ylim plot scatter hist boxplot imshow cmap alpha bins tick_params annotate quiver contour barh stackplot subplots_adjust axhline axvline semilogx semilogy loglog polar streamplot hexbin pcolor tricontour errorbar clabel set_aspect violinplot set_axis_off spines text hatch plt axis plt.bar() plt.axis import figure pyplot highlight_text pypalettes plt.subplots() xlabel ylabel title legend colorbar savefig tight_layout grid set_xlim set_ylim plot scatter hist boxplot imshow cmap alpha bins tick_params annotate quiver contour barh stackplot subplots_adjust axhline axvline semilogx semilogy loglog polar streamplot hexbin pcolor tricontour errorbar clabel set_aspect violinplot set_axis_off spines text hatch plt axis plt.bar() plt.axis import figure pyplot highlight_text pypalettes plt.subplots() xlabel ylabel title legend colorbar savefig tight_layout grid set_xlim set_ylim plot scatter hist boxplot imshow cmap alpha bins tick_params annotate quiver contour barh stackplot subplots_adjust axhline axvline semilogx semilogy loglog polar streamplot hexbin pcolor tricontour errorbar clabel set_aspect violinplot set_axis_off spines text hatch plt axis plt.bar() plt.axis import figure pyplot highlight_text pypalettes plt.subplots() xlabel ylabel title legend colorbar savefig tight_layout grid set_xlim set_ylim plot scatter hist boxplot imshow cmap alpha bins tick_params annotate quiver contour barh stackplot subplots_adjust axhline axvline semilogx semilogy loglog polar streamplot hexbin pcolor tricontour errorbar clabel set_aspect violinplot set_axis_off spines text hatch plt axis plt.bar() plt.axis import figure pyplot highlight_text pypalettes plt.subplots() xlabel ylabel title legend colorbar savefig tight_layout grid set_xlim set_ylim plot scatter hist boxplot imshow cmap alpha bins tick_params annotate quiver contour barh stackplot subplots_adjust axhline axvline semilogx semilogy loglog polar streamplot hexbin pcolor tricontour errorbar clabel set_aspect violinplot set_axis_off spines text hatch plt axis plt.bar() plt.axis import figure pyplot highlight_text pypalettes plt.subplots() xlabel ylabel title legend colorbar savefig tight_layout grid set_xlim set_ylim plot scatter hist boxplot imshow cmap alpha bins tick_params annotate quiver contour barh stackplot subplots_adjust axhline axvline semilogx semilogy loglog polar streamplot hexbin pcolor tricontour errorbar clabel set_aspect violinplot set_axis_off spines text hatch plt axis plt.bar() plt.axis import figure pyplot highlight_text pypalettes plt.subplots() xlabel ylabel title legend colorbar savefig tight_layout grid set_xlim set_ylim plot scatter hist boxplot imshow cmap alpha bins tick_params annotate quiver contour barh stackplot subplots_adjust axhline axvline semilogx semilogy loglog polar streamplot hexbin pcolor tricontour errorbar clabel set_aspect violinplot set_axis_off spines text hatch plt axis plt.bar() plt.axis import figure pyplot highlight_text pypalettes plt.subplots() xlabel ylabel title legend colorbar savefig tight_layout grid set_xlim set_ylim plot scatter hist boxplot imshow cmap alpha bins tick_params annotate quiver contour barh stackplot subplots_adjust axhline axvline semilogx semilogy loglog polar streamplot hexbin pcolor tricontour errorbar clabel set_aspect violinplot set_axis_off spines text hatch plt axis plt.bar() plt.axis import figure pyplot highlight_text pypalettes plt.subplots() xlabel ylabel title legend colorbar savefig tight_layout grid set_xlim set_ylim plot scatter hist boxplot imshow cmap alpha bins tick_params annotate quiver contour barh stackplot subplots_adjust axhline axvline semilogx semilogy loglog polar streamplot hexbin pcolor tricontour errorbar clabel set_aspect violinplot set_axis_off spines text hatch plt axis plt.bar() plt.axis import figure pyplot highlight_text pypalettes plt.subplots() xlabel ylabel title legend colorbar savefig tight_layout grid set_xlim set_ylim plot scatter hist boxplot imshow cmap alpha bins tick_params annotate quiver contour barh stackplot subplots_adjust axhline axvline semilogx semilogy loglog polar streamplot hexbin pcolor tricontour errorbar clabel set_aspect violinplot set_axis_off spines text hatch plt axis plt.bar() plt.axis import figure pyplot highlight_text pypalettes plt.subplots() xlabel ylabel title legend colorbar savefig tight_layout grid set_xlim set_ylim plot scatter hist boxplot imshow cmap alpha bins tick_params annotate quiver contour barh stackplot subplots_adjust axhline axvline semilogx semilogy loglog polar streamplot hexbin pcolor tricontour errorbar clabel set_aspect violinplot set_axis_off spines text hatch plt axis plt.bar() plt.axis import figure pyplot highlight_text pypalettes plt.subplots() xlabel ylabel title legend colorbar savefig tight_layout grid set_xlim set_ylim plot scatter hist boxplot imshow cmap alpha bins tick_params annotate quiver contour barh stackplot subplots_adjust axhline axvline semilogx semilogy loglog polar streamplot hexbin pcolor tricontour errorbar clabel set_aspect violinplot set_axis_off spines text hatch plt axis plt.bar() plt.axis import figure pyplot highlight_text pypalettes plt.subplots() xlabel ylabel title legend colorbar savefig tight_layout grid set_xlim set_ylim plot scatter hist boxplot imshow cmap alpha bins tick_params annotate quiver contour barh stackplot subplots_adjust axhline axvline semilogx semilogy loglog polar streamplot hexbin pcolor tricontour errorbar clabel set_aspect violinplot set_axis_off spines text hatch plt axis plt.bar() plt.axis import figure pyplot highlight_text pypalettes plt.subplots() xlabel ylabel title legend colorbar savefig tight_layout grid set_xlim set_ylim plot scatter hist boxplot imshow cmap alpha bins tick_params annotate quiver contour barh stackplot subplots_adjust axhline axvline semilogx semilogy loglog polar streamplot hexbin pcolor tricontour errorbar clabel set_aspect violinplot set_axis_off spines text hatch plt axis plt.bar() plt.axis import figure pyplot highlight_text pypalettes plt.subplots() xlabel ylabel title legend colorbar savefig tight_layout grid set_xlim set_ylim plot scatter hist boxplot imshow cmap alpha bins tick_params annotate quiver contour barh stackplot subplots_adjust axhline axvline semilogx semilogy loglog polar streamplot hexbin pcolor tricontour errorbar clabel set_aspect violinplot set_axis_off spines text hatch plt axis plt.bar() plt.axis import figure pyplot highlight_text pypalettes plt.subplots() xlabel ylabel title legend colorbar savefig tight_layout grid set_xlim set_ylim plot scatter hist boxplot imshow cmap alpha bins tick_params annotate quiver contour barh stackplot subplots_adjust axhline axvline semilogx semilogy loglog polar streamplot hexbin pcolor tricontour errorbar clabel set_aspect violinplot set_axis_off spines text hatch plt axis plt.bar() plt.axis import figure pyplot highlight_text pypalettes plt.subplots() xlabel ylabel title legend colorbar savefig tight_layout grid set_xlim set_ylim plot scatter hist boxplot imshow cmap alpha bins tick_params annotate quiver contour barh stackplot subplots_adjust axhline axvline semilogx semilogy loglog polar streamplot hexbin pcolor tricontour errorbar clabel set_aspect violinplot set_axis_off spines text hatch plt axis plt.bar() plt.axis import figure pyplot highlight_text pypalettes plt.subplots() xlabel ylabel title legend colorbar savefig tight_layout grid set_xlim set_ylim plot scatter hist boxplot imshow cmap alpha bins tick_params annotate quiver contour barh stackplot subplots_adjust axhline axvline semilogx semilogy loglog polar streamplot hexbin pcolor tricontour errorbar clabel set_aspect violinplot set_axis_off spines text hatch plt axis plt.bar() plt.axis import figure pyplot highlight_text pypalettes plt.subplots() xlabel ylabel title legend colorbar savefig tight_layout grid set_xlim set_ylim plot scatter hist boxplot imshow cmap alpha bins tick_params annotate quiver contour barh stackplot subplots_adjust axhline axvline semilogx semilogy loglog polar streamplot hexbin pcolor tricontour errorbar clabel set_aspect violinplot set_axis_off spines text hatch plt axis plt.bar() plt.axis import figure pyplot highlight_text pypalettes plt.subplots() xlabel ylabel title legend colorbar savefig tight_layout grid set_xlim set_ylim plot scatter hist boxplot imshow cmap alpha bins tick_params annotate quiver contour barh stackplot subplots_adjust axhline axvline semilogx semilogy loglog polar streamplot hexbin pcolor tricontour errorbar clabel set_aspect violinplot set_axis_off spines text hatch plt axis plt.bar() plt.axis import figure pyplot highlight_text pypalettes plt.subplots() xlabel ylabel title legend colorbar savefig tight_layout grid set_xlim set_ylim plot scatter hist boxplot imshow cmap alpha bins tick_params annotate quiver contour barh stackplot subplots_adjust axhline axvline semilogx semilogy loglog polar streamplot hexbin pcolor tricontour errorbar clabel set_aspect violinplot set_axis_off spines text hatch plt axis plt.bar() plt.axis import figure pyplot highlight_text pypalettes plt.subplots() xlabel ylabel title legend colorbar savefig tight_layout grid set_xlim set_ylim plot scatter hist boxplot imshow cmap alpha bins tick_params annotate quiver contour barh stackplot subplots_adjust axhline axvline semilogx semilogy loglog polar streamplot hexbin pcolor tricontour errorbar clabel set_aspect violinplot set_axis_off spines text hatch plt axis plt.bar() plt.axis import figure pyplot highlight_text pypalettes plt.subplots() xlabel ylabel title legend colorbar savefig tight_layout grid set_xlim set_ylim plot scatter hist boxplot imshow cmap alpha bins tick_params annotate quiver contour barh stackplot subplots_adjust axhline axvline semilogx semilogy loglog polar streamplot hexbin pcolor tricontour errorbar clabel set_aspect violinplot set_axis_off spines text hatch plt axis plt.bar() plt.axis import figure pyplot highlight_text pypalettes plt.subplots() xlabel ylabel title legend colorbar savefig tight_layout grid set_xlim set_ylim plot scatter hist boxplot imshow cmap alpha bins tick_params annotate quiver contour barh stackplot subplots_adjust axhline axvline semilogx semilogy loglog polar streamplot hexbin pcolor tricontour errorbar clabel set_aspect violinplot set_axis_off spines text hatch plt axis plt.bar() plt.axis import figure pyplot highlight_text pypalettes plt.subplots() xlabel ylabel title legend colorbar savefig tight_layout grid set_xlim set_ylim plot scatter hist boxplot imshow cmap alpha bins tick_params annotate quiver contour barh stackplot subplots_adjust axhline axvline semilogx semilogy loglog polar streamplot hexbin pcolor tricontour errorbar clabel set_aspect violinplot set_axis_off spines text hatch plt axis plt.bar() plt.axis import figure pyplot highlight_text pypalettes plt.subplots() xlabel ylabel title legend colorbar savefig tight_layout grid set_xlim set_ylim plot scatter hist boxplot imshow cmap alpha bins tick_params annotate quiver contour barh stackplot subplots_adjust axhline axvline semilogx semilogy loglog polar streamplot hexbin pcolor tricontour errorbar clabel set_aspect violinplot set_axis_off spines text hatch plt axis plt.bar() plt.axis import figure pyplot highlight_text pypalettes plt.subplots() xlabel ylabel title legend colorbar savefig tight_layout grid set_xlim set_ylim plot scatter hist boxplot imshow cmap alpha bins tick_params annotate quiver contour barh stackplot subplots_adjust axhline axvline semilogx semilogy loglog polar streamplot hexbin pcolor tricontour errorbar clabel set_aspect violinplot set_axis_off spines text hatch plt axis plt.bar() plt.axis import figure pyplot highlight_text pypalettes plt.subplots() xlabel ylabel title legend colorbar savefig tight_layout grid set_xlim set_ylim plot scatter hist boxplot imshow cmap alpha bins tick_params annotate quiver contour barh stackplot subplots_adjust axhline axvline semilogx semilogy loglog polar streamplot hexbin pcolor tricontour errorbar clabel set_aspect violinplot set_axis_off spines text hatch plt axis plt.bar() plt.axis import figure pyplot highlight_text pypalettes plt.subplots() xlabel ylabel title legend colorbar savefig tight_layout grid set_xlim set_ylim plot scatter hist boxplot imshow cmap alpha bins tick_params annotate quiver contour barh stackplot subplots_adjust axhline axvline semilogx semilogy loglog polar streamplot hexbin pcolor tricontour errorbar clabel set_aspect violinplot set_axis_off spines text hatch plt axis plt.bar() plt.axis import figure pyplot highlight_text pypalettes plt.subplots() xlabel ylabel title legend colorbar savefig tight_layout grid set_xlim set_ylim plot scatter hist boxplot imshow cmap alpha bins tick_params annotate quiver contour barh stackplot subplots_adjust axhline axvline semilogx semilogy loglog polar streamplot hexbin pcolor tricontour errorbar clabel set_aspect violinplot set_axis_off spines text hatch plt axis plt.bar() plt.axis import figure pyplot highlight_text pypalettes plt.subplots() xlabel ylabel title legend colorbar savefig tight_layout grid set_xlim set_ylim plot scatter hist boxplot imshow cmap alpha bins tick_params annotate quiver contour barh stackplot subplots_adjust axhline axvline semilogx semilogy loglog polar streamplot hexbin pcolor tricontour errorbar clabel set_aspect violinplot set_axis_off spines text hatch plt axis plt.bar() plt.axis import figure pyplot highlight_text pypalettes plt.subplots() xlabel ylabel title legend colorbar savefig tight_layout grid set_xlim set_ylim plot scatter hist boxplot imshow cmap alpha bins tick_params annotate quiver contour barh stackplot subplots_adjust axhline axvline semilogx semilogy loglog polar streamplot hexbin pcolor tricontour errorbar clabel set_aspect violinplot set_axis_off spines text hatch plt axis plt.bar() plt.axis import figure pyplot highlight_text pypalettes plt.subplots() xlabel ylabel title legend colorbar savefig tight_layout grid set_xlim set_ylim plot scatter hist boxplot imshow cmap alpha bins tick_params annotate quiver contour barh stackplot subplots_adjust axhline axvline semilogx semilogy loglog polar streamplot hexbin pcolor tricontour errorbar clabel set_aspect violinplot set_axis_off spines text hatch plt axis plt.bar() plt.axis import figure pyplot highlight_text pypalettes plt.subplots() xlabel ylabel title legend colorbar savefig tight_layout grid set_xlim set_ylim plot scatter hist boxplot imshow cmap alpha bins tick_params annotate quiver contour barh stackplot subplots_adjust axhline axvline semilogx semilogy loglog polar streamplot hexbin pcolor tricontour errorbar clabel set_aspect violinplot set_axis_off spines text hatch plt axis plt.bar() plt.axis import figure pyplot highlight_text pypalettes plt.subplots() xlabel ylabel title legend colorbar savefig tight_layout grid set_xlim set_ylim plot scatter hist boxplot imshow cmap alpha bins tick_params annotate quiver contour barh stackplot subplots_adjust axhline axvline semilogx semilogy loglog polar streamplot hexbin pcolor tricontour errorbar clabel set_aspect violinplot set_axis_off spines text hatch plt axis plt.bar() plt.axis import figure pyplot highlight_text pypalettes plt.subplots() xlabel ylabel title legend colorbar savefig tight_layout grid set_xlim set_ylim plot scatter hist boxplot imshow cmap alpha bins tick_params annotate quiver contour barh stackplot subplots_adjust axhline axvline semilogx semilogy loglog polar streamplot hexbin pcolor tricontour errorbar clabel set_aspect violinplot set_axis_off spines text hatch plt axis plt.bar() plt.axis import figure pyplot highlight_text pypalettes plt.subplots() xlabel ylabel title legend colorbar savefig tight_layout grid set_xlim set_ylim plot scatter hist boxplot imshow cmap alpha bins tick_params annotate quiver contour barh stackplot subplots_adjust axhline axvline semilogx semilogy loglog polar streamplot hexbin pcolor tricontour errorbar clabel set_aspect violinplot set_axis_off spines text hatch plt axis plt.bar() plt.axis import figure pyplot highlight_text pypalettes plt.subplots() xlabel ylabel title legend colorbar savefig tight_layout grid set_xlim set_ylim plot scatter hist boxplot imshow cmap alpha bins tick_params annotate quiver contour barh stackplot subplots_adjust axhline axvline semilogx semilogy loglog polar streamplot hexbin pcolor tricontour errorbar clabel set_aspect violinplot set_axis_off spines text hatch plt axis plt.bar() plt.axis import figure pyplot highlight_text pypalettes plt.subplots() xlabel ylabel title legend colorbar savefig tight_layout grid set_xlim set_ylim plot scatter hist boxplot imshow cmap alpha bins tick_params annotate quiver contour barh stackplot subplots_adjust axhline axvline semilogx semilogy loglog polar streamplot hexbin pcolor tricontour errorbar clabel set_aspect violinplot set_axis_off spines text hatch plt axis plt.bar() plt.axis import figure pyplot highlight_text pypalettes plt.subplots() xlabel ylabel title legend colorbar savefig tight_layout grid set_xlim set_ylim plot scatter hist boxplot imshow cmap alpha bins tick_params annotate quiver contour barh stackplot subplots_adjust axhline axvline semilogx semilogy loglog polar streamplot hexbin pcolor tricontour errorbar clabel set_aspect violinplot set_axis_off spines text hatch plt axis plt.bar() plt.axis import figure pyplot highlight_text pypalettes plt.subplots() xlabel ylabel title legend colorbar savefig tight_layout grid set_xlim set_ylim plot scatter hist boxplot imshow cmap alpha bins tick_params annotate quiver contour barh stackplot subplots_adjust axhline axvline semilogx semilogy loglog polar streamplot hexbin pcolor tricontour errorbar clabel set_aspect violinplot set_axis_off spines text hatch plt axis plt.bar() plt.axis import figure pyplot highlight_text pypalettes plt.subplots() xlabel ylabel title legend colorbar savefig tight_layout grid set_xlim set_ylim plot scatter hist boxplot imshow cmap alpha bins tick_params annotate quiver contour barh stackplot subplots_adjust axhline axvline semilogx semilogy loglog polar streamplot hexbin pcolor tricontour errorbar clabel set_aspect violinplot set_axis_off spines text hatch plt axis plt.bar() plt.axis import figure pyplot highlight_text pypalettes plt.subplots() xlabel ylabel title legend colorbar savefig tight_layout grid set_xlim set_ylim plot scatter hist boxplot imshow cmap alpha bins tick_params annotate quiver contour barh stackplot subplots_adjust axhline axvline semilogx semilogy loglog polar streamplot hexbin pcolor tricontour errorbar clabel set_aspect violinplot set_axis_off spines text hatch plt axis plt.bar() plt.axis import figure pyplot highlight_text pypalettes plt.subplots() xlabel ylabel title legend colorbar savefig tight_layout grid set_xlim set_ylim plot scatter hist boxplot imshow cmap alpha bins tick_params annotate quiver contour barh stackplot subplots_adjust axhline axvline semilogx semilogy loglog polar streamplot hexbin pcolor tricontour errorbar clabel set_aspect violinplot set_axis_off spines text hatch plt axis plt.bar() plt.axis import figure pyplot highlight_text pypalettes plt.subplots() xlabel ylabel title legend colorbar savefig tight_layout grid set_xlim set_ylim plot scatter hist boxplot imshow cmap alpha bins tick_params annotate quiver contour barh stackplot subplots_adjust axhline axvline semilogx semilogy loglog polar streamplot hexbin pcolor tricontour errorbar clabel set_aspect violinplot set_axis_off spines text hatch plt axis plt.bar() plt.axis import figure pyplot highlight_text pypalettes plt.subplots() xlabel ylabel title legend colorbar savefig tight_layout grid set_xlim set_ylim plot scatter hist boxplot imshow cmap alpha bins tick_params annotate quiver contour barh stackplot subplots_adjust axhline axvline semilogx semilogy loglog polar streamplot hexbin pcolor tricontour errorbar clabel set_aspect violinplot set_axis_off spines text hatch plt axis plt.bar() plt.axis import figure pyplot highlight_text pypalettes plt.subplots() xlabel ylabel title legend colorbar savefig tight_layout grid set_xlim set_ylim plot scatter hist boxplot imshow cmap alpha bins tick_params annotate quiver contour barh stackplot subplots_adjust axhline axvline semilogx semilogy loglog polar streamplot hexbin pcolor tricontour errorbar clabel set_aspect violinplot set_axis_off spines text hatch plt axis plt.bar() plt.axis import figure pyplot highlight_text pypalettes plt.subplots() xlabel ylabel title legend colorbar savefig tight_layout grid set_xlim set_ylim plot scatter hist boxplot imshow cmap alpha bins tick_params annotate quiver contour barh stackplot subplots_adjust axhline axvline semilogx semilogy loglog polar streamplot hexbin pcolor tricontour errorbar clabel set_aspect violinplot set_axis_off spines text hatch plt axis plt.bar() plt.axis import figure pyplot highlight_text pypalettes plt.subplots() xlabel ylabel title legend colorbar savefig tight_layout grid set_xlim set_ylim plot scatter hist boxplot imshow cmap alpha bins tick_params annotate quiver contour barh stackplot subplots_adjust axhline axvline semilogx semilogy loglog polar streamplot hexbin pcolor tricontour errorbar clabel set_aspect violinplot set_axis_off spines text hatch plt axis plt.bar() plt.axis import figure pyplot highlight_text pypalettes plt.subplots() xlabel ylabel title legend colorbar savefig tight_layout grid set_xlim set_ylim plot scatter hist boxplot imshow cmap alpha bins tick_params annotate quiver contour barh stackplot subplots_adjust axhline axvline semilogx semilogy loglog polar streamplot hexbin pcolor tricontour errorbar clabel set_aspect violinplot set_axis_off spines text hatch plt axis plt.bar() plt.axis import figure pyplot highlight_text pypalettes plt.subplots() xlabel ylabel title legend colorbar savefig tight_layout grid set_xlim set_ylim plot scatter hist boxplot imshow cmap alpha bins tick_params annotate quiver contour barh stackplot subplots_adjust axhline axvline semilogx semilogy loglog polar streamplot hexbin pcolor tricontour errorbar clabel set_aspect violinplot set_axis_off spines text hatch plt axis plt.bar() plt.axis import figure pyplot highlight_text pypalettes plt.subplots() xlabel ylabel title legend colorbar savefig tight_layout grid set_xlim set_ylim plot scatter hist boxplot imshow cmap alpha bins tick_params annotate quiver contour barh stackplot subplots_adjust axhline axvline semilogx semilogy loglog polar streamplot hexbin pcolor tricontour errorbar clabel set_aspect violinplot set_axis_off spines text hatch plt axis plt.bar() plt.axis import figure pyplot highlight_text pypalettes plt.subplots() xlabel ylabel title legend colorbar savefig tight_layout grid set_xlim set_ylim plot scatter hist boxplot imshow cmap alpha bins tick_params annotate quiver contour barh stackplot subplots_adjust axhline axvline semilogx semilogy loglog polar streamplot hexbin pcolor tricontour errorbar clabel set_aspect violinplot set_axis_off spines text hatch plt axis plt.bar() plt.axis import figure pyplot highlight_text pypalettes plt.subplots() xlabel ylabel title legend colorbar savefig tight_layout grid set_xlim set_ylim plot scatter hist boxplot imshow cmap alpha bins tick_params annotate quiver contour barh stackplot subplots_adjust axhline axvline semilogx semilogy loglog polar streamplot hexbin pcolor tricontour errorbar clabel set_aspect violinplot set_axis_off spines text hatch plt axis plt.bar() plt.axis import figure pyplot highlight_text pypalettes plt.subplots() xlabel ylabel title legend colorbar savefig tight_layout grid set_xlim set_ylim plot scatter hist boxplot imshow cmap alpha bins tick_params annotate quiver contour barh stackplot subplots_adjust axhline axvline semilogx semilogy loglog polar streamplot hexbin pcolor tricontour errorbar clabel set_aspect violinplot set_axis_off spines text hatch plt axis plt.bar() plt.axis import figure pyplot highlight_text pypalettes plt.subplots() xlabel ylabel title legend colorbar savefig tight_layout grid set_xlim set_ylim plot scatter hist boxplot imshow cmap alpha bins tick_params annotate quiver contour barh stackplot subplots_adjust axhline axvline semilogx semilogy loglog polar streamplot hexbin pcolor tricontour errorbar clabel set_aspect violinplot set_axis_off spines text hatch plt axis plt.bar() plt.axis import figure pyplot highlight_text pypalettes plt.subplots() xlabel ylabel title legend colorbar savefig tight_layout grid set_xlim set_ylim plot scatter hist boxplot imshow cmap alpha bins tick_params annotate quiver contour barh stackplot subplots_adjust axhline axvline semilogx semilogy loglog polar streamplot hexbin pcolor tricontour errorbar clabel set_aspect violinplot set_axis_off spines text hatch plt axis plt.bar() plt.axis import figure pyplot highlight_text pypalettes plt.subplots() xlabel ylabel title legend colorbar savefig tight_layout grid set_xlim set_ylim plot scatter hist boxplot imshow cmap alpha bins tick_params annotate quiver contour barh stackplot subplots_adjust axhline axvline semilogx semilogy loglog polar streamplot hexbin pcolor tricontour errorbar clabel set_aspect violinplot set_axis_off spines text hatch plt axis plt.bar() plt.axis import figure pyplot highlight_text pypalettes plt.subplots() xlabel ylabel title legend colorbar savefig tight_layout grid set_xlim set_ylim plot scatter hist boxplot imshow cmap alpha bins tick_params annotate quiver contour barh stackplot subplots_adjust axhline axvline semilogx semilogy loglog polar streamplot hexbin pcolor tricontour errorbar clabel set_aspect violinplot set_axis_off spines text hatch plt axis plt.bar() plt.axis import figure pyplot highlight_text pypalettes plt.subplots() xlabel ylabel title legend colorbar savefig tight_layout grid set_xlim set_ylim plot scatter hist boxplot imshow cmap alpha bins tick_params annotate quiver contour barh stackplot subplots_adjust axhline axvline semilogx semilogy loglog polar streamplot hexbin pcolor tricontour errorbar clabel set_aspect violinplot set_axis_off spines text hatch plt axis plt.bar() plt.axis import figure pyplot highlight_text pypalettes plt.subplots() xlabel ylabel title legend colorbar savefig tight_layout grid set_xlim set_ylim plot scatter hist boxplot imshow cmap alpha bins tick_params annotate quiver contour barh stackplot subplots_adjust axhline axvline semilogx semilogy loglog polar streamplot hexbin pcolor tricontour errorbar clabel set_aspect violinplot set_axis_off spines text hatch plt axis plt.bar() plt.axis import figure pyplot highlight_text pypalettes plt.subplots() xlabel ylabel title legend colorbar savefig tight_layout grid set_xlim set_ylim plot scatter hist boxplot imshow cmap alpha bins tick_params annotate quiver contour barh stackplot subplots_adjust axhline axvline semilogx semilogy loglog polar streamplot hexbin pcolor tricontour errorbar clabel set_aspect violinplot set_axis_off spines text hatch plt axis plt.bar() plt.axis import figure pyplot highlight_text pypalettes plt.subplots() xlabel ylabel title legend colorbar savefig tight_layout grid set_xlim set_ylim plot scatter hist boxplot imshow cmap alpha bins tick_params annotate quiver contour barh stackplot subplots_adjust axhline axvline semilogx semilogy loglog polar streamplot hexbin pcolor tricontour errorbar clabel set_aspect violinplot set_axis_off spines text hatch
plt axis plt.bar() plt.axis import figure pyplot highlight_text pypalettes plt.subplots() xlabel ylabel title legend colorbar savefig tight_layout grid set_xlim set_ylim plot scatter hist boxplot imshow cmap alpha bins tick_params annotate quiver contour barh stackplot subplots_adjust axhline axvline semilogx semilogy loglog polar streamplot hexbin pcolor tricontour errorbar clabel set_aspect violinplot set_axis_off spines text hatch plt axis plt.bar() plt.axis import figure pyplot highlight_text pypalettes plt.subplots() xlabel ylabel title legend colorbar savefig tight_layout grid set_xlim set_ylim plot scatter hist boxplot imshow cmap alpha bins tick_params annotate quiver contour barh stackplot subplots_adjust axhline axvline semilogx semilogy loglog polar streamplot hexbin pcolor tricontour errorbar clabel set_aspect violinplot set_axis_off spines text hatch plt axis plt.bar() plt.axis import figure pyplot highlight_text pypalettes plt.subplots() xlabel ylabel title legend colorbar savefig tight_layout grid set_xlim set_ylim plot scatter hist boxplot imshow cmap alpha bins tick_params annotate quiver contour barh stackplot subplots_adjust axhline axvline semilogx semilogy loglog polar streamplot hexbin pcolor tricontour errorbar clabel set_aspect violinplot set_axis_off spines text hatch plt axis plt.bar() plt.axis import figure pyplot highlight_text pypalettes plt.subplots() xlabel ylabel title legend colorbar savefig tight_layout grid set_xlim set_ylim plot scatter hist boxplot imshow cmap alpha bins tick_params annotate quiver contour barh stackplot subplots_adjust axhline axvline semilogx semilogy loglog polar streamplot hexbin pcolor tricontour errorbar clabel set_aspect violinplot set_axis_off spines text hatch plt axis plt.bar() plt.axis import figure pyplot highlight_text pypalettes plt.subplots() xlabel ylabel title legend colorbar savefig tight_layout grid set_xlim set_ylim plot scatter hist boxplot imshow cmap alpha bins tick_params annotate quiver contour barh stackplot subplots_adjust axhline axvline semilogx semilogy loglog polar streamplot hexbin pcolor tricontour errorbar clabel set_aspect violinplot set_axis_off spines text hatch plt axis plt.bar() plt.axis import figure pyplot highlight_text pypalettes plt.subplots() xlabel ylabel title legend colorbar savefig tight_layout grid set_xlim set_ylim plot scatter hist boxplot imshow cmap alpha bins tick_params annotate quiver contour barh stackplot subplots_adjust axhline axvline semilogx semilogy loglog polar streamplot hexbin pcolor tricontour errorbar clabel set_aspect violinplot set_axis_off spines text hatch plt axis plt.bar() plt.axis import figure pyplot highlight_text pypalettes plt.subplots() xlabel ylabel title legend colorbar savefig tight_layout grid set_xlim set_ylim plot scatter hist boxplot imshow cmap alpha bins tick_params annotate quiver contour barh stackplot subplots_adjust axhline axvline semilogx semilogy loglog polar streamplot hexbin pcolor tricontour errorbar clabel set_aspect violinplot set_axis_off spines text hatch plt axis plt.bar() plt.axis import figure pyplot highlight_text pypalettes plt.subplots() xlabel ylabel title legend colorbar savefig tight_layout grid set_xlim set_ylim plot scatter hist boxplot imshow cmap alpha bins tick_params annotate quiver contour barh stackplot subplots_adjust axhline axvline semilogx semilogy loglog polar streamplot hexbin pcolor tricontour errorbar clabel set_aspect violinplot set_axis_off spines text hatch plt axis plt.bar() plt.axis import figure pyplot highlight_text pypalettes plt.subplots() xlabel ylabel title legend colorbar savefig tight_layout grid set_xlim set_ylim plot scatter hist boxplot imshow cmap alpha bins tick_params annotate quiver contour barh stackplot subplots_adjust axhline axvline semilogx semilogy loglog polar streamplot hexbin pcolor tricontour errorbar clabel set_aspect violinplot set_axis_off spines text hatch plt axis plt.bar() plt.axis import figure pyplot highlight_text pypalettes plt.subplots() xlabel ylabel title legend colorbar savefig tight_layout grid set_xlim set_ylim plot scatter hist boxplot imshow cmap alpha bins tick_params annotate quiver contour barh stackplot subplots_adjust axhline axvline semilogx semilogy loglog polar streamplot hexbin pcolor tricontour errorbar clabel set_aspect violinplot set_axis_off spines text hatch plt axis plt.bar() plt.axis import figure pyplot highlight_text pypalettes plt.subplots() xlabel ylabel title legend colorbar savefig tight_layout grid set_xlim set_ylim plot scatter hist boxplot imshow cmap alpha bins tick_params annotate quiver contour barh stackplot subplots_adjust axhline axvline semilogx semilogy loglog polar streamplot hexbin pcolor tricontour errorbar clabel set_aspect violinplot set_axis_off spines text hatch plt axis plt.bar() plt.axis import figure pyplot highlight_text pypalettes plt.subplots() xlabel ylabel title legend colorbar savefig tight_layout grid set_xlim set_ylim plot scatter hist boxplot imshow cmap alpha bins tick_params annotate quiver contour barh stackplot subplots_adjust axhline axvline semilogx semilogy loglog polar streamplot hexbin pcolor tricontour errorbar clabel set_aspect violinplot set_axis_off spines text hatch plt axis plt.bar() plt.axis import figure pyplot highlight_text pypalettes plt.subplots() xlabel ylabel title legend colorbar savefig tight_layout grid set_xlim set_ylim plot scatter hist boxplot imshow cmap alpha bins tick_params annotate quiver contour barh stackplot subplots_adjust axhline axvline semilogx semilogy loglog polar streamplot hexbin pcolor tricontour errorbar clabel set_aspect violinplot set_axis_off spines text hatch plt axis plt.bar() plt.axis import figure pyplot highlight_text pypalettes plt.subplots() xlabel ylabel title legend colorbar savefig tight_layout grid set_xlim set_ylim plot scatter hist boxplot imshow cmap alpha bins tick_params annotate quiver contour barh stackplot subplots_adjust axhline axvline semilogx semilogy loglog polar streamplot hexbin pcolor tricontour errorbar clabel set_aspect violinplot set_axis_off spines text hatch plt axis plt.bar() plt.axis import figure pyplot highlight_text pypalettes plt.subplots() xlabel ylabel title legend colorbar savefig tight_layout grid set_xlim set_ylim plot scatter hist boxplot imshow cmap alpha bins tick_params annotate quiver contour barh stackplot subplots_adjust axhline axvline semilogx semilogy loglog polar streamplot hexbin pcolor tricontour errorbar clabel set_aspect violinplot set_axis_off spines text hatch plt axis plt.bar() plt.axis import figure pyplot highlight_text pypalettes plt.subplots() xlabel ylabel title legend colorbar savefig tight_layout grid set_xlim set_ylim plot scatter hist boxplot imshow cmap alpha bins tick_params annotate quiver contour barh stackplot subplots_adjust axhline axvline semilogx semilogy loglog polar streamplot hexbin pcolor tricontour errorbar clabel set_aspect violinplot set_axis_off spines text hatch plt axis plt.bar() plt.axis import figure pyplot highlight_text pypalettes plt.subplots() xlabel ylabel title legend colorbar savefig tight_layout grid set_xlim set_ylim plot scatter hist boxplot imshow cmap alpha bins tick_params annotate quiver contour barh stackplot subplots_adjust axhline axvline semilogx semilogy loglog polar streamplot hexbin pcolor tricontour errorbar clabel set_aspect violinplot set_axis_off spines text hatch plt axis plt.bar() plt.axis import figure pyplot highlight_text pypalettes plt.subplots() xlabel ylabel title legend colorbar savefig tight_layout grid set_xlim set_ylim plot scatter hist boxplot imshow cmap alpha bins tick_params annotate quiver contour barh stackplot subplots_adjust axhline axvline semilogx semilogy loglog polar streamplot hexbin pcolor tricontour errorbar clabel set_aspect violinplot set_axis_off spines text hatch plt axis plt.bar() plt.axis import figure pyplot highlight_text pypalettes plt.subplots() xlabel ylabel title legend colorbar savefig tight_layout grid set_xlim set_ylim plot scatter hist boxplot imshow cmap alpha bins tick_params annotate quiver contour barh stackplot subplots_adjust axhline axvline semilogx semilogy loglog polar streamplot hexbin pcolor tricontour errorbar clabel set_aspect violinplot set_axis_off spines text hatch plt axis plt.bar() plt.axis import figure pyplot highlight_text pypalettes plt.subplots() xlabel ylabel title legend colorbar savefig tight_layout grid set_xlim set_ylim plot scatter hist boxplot imshow cmap alpha bins tick_params annotate quiver contour barh stackplot subplots_adjust axhline axvline semilogx semilogy loglog polar streamplot hexbin pcolor tricontour errorbar clabel set_aspect violinplot set_axis_off spines text hatch plt axis plt.bar() plt.axis import figure pyplot highlight_text pypalettes plt.subplots() xlabel ylabel title legend colorbar savefig tight_layout grid set_xlim set_ylim plot scatter hist boxplot imshow cmap alpha bins tick_params annotate quiver contour barh stackplot subplots_adjust axhline axvline semilogx semilogy loglog polar streamplot hexbin pcolor tricontour errorbar clabel set_aspect violinplot set_axis_off spines text hatch plt axis plt.bar() plt.axis import figure pyplot highlight_text pypalettes plt.subplots() xlabel ylabel title legend colorbar savefig tight_layout grid set_xlim set_ylim plot scatter hist boxplot imshow cmap alpha bins tick_params annotate quiver contour barh stackplot subplots_adjust axhline axvline semilogx semilogy loglog polar streamplot hexbin pcolor tricontour errorbar clabel set_aspect violinplot set_axis_off spines text hatch plt axis plt.bar() plt.axis import figure pyplot highlight_text pypalettes plt.subplots() xlabel ylabel title legend colorbar savefig tight_layout grid set_xlim set_ylim plot scatter hist boxplot imshow cmap alpha bins tick_params annotate quiver contour barh stackplot subplots_adjust axhline axvline semilogx semilogy loglog polar streamplot hexbin pcolor tricontour errorbar clabel set_aspect violinplot set_axis_off spines text hatch plt axis plt.bar() plt.axis import figure pyplot highlight_text pypalettes plt.subplots() xlabel ylabel title legend colorbar savefig tight_layout grid set_xlim set_ylim plot scatter hist boxplot imshow cmap alpha bins tick_params annotate quiver contour barh stackplot subplots_adjust axhline axvline semilogx semilogy loglog polar streamplot hexbin pcolor tricontour errorbar clabel set_aspect violinplot set_axis_off spines text hatch plt axis plt.bar() plt.axis import figure pyplot highlight_text pypalettes plt.subplots() xlabel ylabel title legend colorbar savefig tight_layout grid set_xlim set_ylim plot scatter hist boxplot imshow cmap alpha bins tick_params annotate quiver contour barh stackplot subplots_adjust axhline axvline semilogx semilogy loglog polar streamplot hexbin pcolor tricontour errorbar clabel set_aspect violinplot set_axis_off spines text hatch plt axis plt.bar() plt.axis import figure pyplot highlight_text pypalettes plt.subplots() xlabel ylabel title legend colorbar savefig tight_layout grid set_xlim set_ylim plot scatter hist boxplot imshow cmap alpha bins tick_params annotate quiver contour barh stackplot subplots_adjust axhline axvline semilogx semilogy loglog polar streamplot hexbin pcolor tricontour errorbar clabel set_aspect violinplot set_axis_off spines text hatch plt axis plt.bar() plt.axis import figure pyplot highlight_text pypalettes plt.subplots() xlabel ylabel title legend colorbar savefig tight_layout grid set_xlim set_ylim plot scatter hist boxplot imshow cmap alpha bins tick_params annotate quiver contour barh stackplot subplots_adjust axhline axvline semilogx semilogy loglog polar streamplot hexbin pcolor tricontour errorbar clabel set_aspect violinplot set_axis_off spines text hatch plt axis plt.bar() plt.axis import figure pyplot highlight_text pypalettes plt.subplots() xlabel ylabel title legend colorbar savefig tight_layout grid set_xlim set_ylim plot scatter hist boxplot imshow cmap alpha bins tick_params annotate quiver contour barh stackplot subplots_adjust axhline axvline semilogx semilogy loglog polar streamplot hexbin pcolor tricontour errorbar clabel set_aspect violinplot set_axis_off spines text hatch plt axis plt.bar() plt.axis import figure pyplot highlight_text pypalettes plt.subplots() xlabel ylabel title legend colorbar savefig tight_layout grid set_xlim set_ylim plot scatter hist boxplot imshow cmap alpha bins tick_params annotate quiver contour barh stackplot subplots_adjust axhline axvline semilogx semilogy loglog polar streamplot hexbin pcolor tricontour errorbar clabel set_aspect violinplot set_axis_off spines text hatch plt axis plt.bar() plt.axis import figure pyplot highlight_text pypalettes plt.subplots() xlabel ylabel title legend colorbar savefig tight_layout grid set_xlim set_ylim plot scatter hist boxplot imshow cmap alpha bins tick_params annotate quiver contour barh stackplot subplots_adjust axhline axvline semilogx semilogy loglog polar streamplot hexbin pcolor tricontour errorbar clabel set_aspect violinplot set_axis_off spines text hatch plt axis plt.bar() plt.axis import figure pyplot highlight_text pypalettes plt.subplots() xlabel ylabel title legend colorbar savefig tight_layout grid set_xlim set_ylim plot scatter hist boxplot imshow cmap alpha bins tick_params annotate quiver contour barh stackplot subplots_adjust axhline axvline semilogx semilogy loglog polar streamplot hexbin pcolor tricontour errorbar clabel set_aspect violinplot set_axis_off spines text hatch plt axis plt.bar() plt.axis import figure pyplot highlight_text pypalettes plt.subplots() xlabel ylabel title legend colorbar savefig tight_layout grid set_xlim set_ylim plot scatter hist boxplot imshow cmap alpha bins tick_params annotate quiver contour barh stackplot subplots_adjust axhline axvline semilogx semilogy loglog polar streamplot hexbin pcolor tricontour errorbar clabel set_aspect violinplot set_axis_off spines text hatch plt axis plt.bar() plt.axis import figure pyplot highlight_text pypalettes plt.subplots() xlabel ylabel title legend colorbar savefig tight_layout grid set_xlim set_ylim plot scatter hist boxplot imshow cmap alpha bins tick_params annotate quiver contour barh stackplot subplots_adjust axhline axvline semilogx semilogy loglog polar streamplot hexbin pcolor tricontour errorbar clabel set_aspect violinplot set_axis_off spines text hatch plt axis plt.bar() plt.axis import figure pyplot highlight_text pypalettes plt.subplots() xlabel ylabel title legend colorbar savefig tight_layout grid set_xlim set_ylim plot scatter hist boxplot imshow cmap alpha bins tick_params annotate quiver contour barh stackplot subplots_adjust axhline axvline semilogx semilogy loglog polar streamplot hexbin pcolor tricontour errorbar clabel set_aspect violinplot set_axis_off spines text hatch plt axis plt.bar() plt.axis import figure pyplot highlight_text pypalettes plt.subplots() xlabel ylabel title legend colorbar savefig tight_layout grid set_xlim set_ylim plot scatter hist boxplot imshow cmap alpha bins tick_params annotate quiver contour barh stackplot subplots_adjust axhline axvline semilogx semilogy loglog polar streamplot hexbin pcolor tricontour errorbar clabel set_aspect violinplot set_axis_off spines text hatch plt axis plt.bar() plt.axis import figure pyplot highlight_text pypalettes plt.subplots() xlabel ylabel title legend colorbar savefig tight_layout grid set_xlim set_ylim plot scatter hist boxplot imshow cmap alpha bins tick_params annotate quiver contour barh stackplot subplots_adjust axhline axvline semilogx semilogy loglog polar streamplot hexbin pcolor tricontour errorbar clabel set_aspect violinplot set_axis_off spines text hatch plt axis plt.bar() plt.axis import figure pyplot highlight_text pypalettes plt.subplots() xlabel ylabel title legend colorbar savefig tight_layout grid set_xlim set_ylim plot scatter hist boxplot imshow cmap alpha bins tick_params annotate quiver contour barh stackplot subplots_adjust axhline axvline semilogx semilogy loglog polar streamplot hexbin pcolor tricontour errorbar clabel set_aspect violinplot set_axis_off spines text hatch plt axis plt.bar() plt.axis import figure pyplot highlight_text pypalettes plt.subplots() xlabel ylabel title legend colorbar savefig tight_layout grid set_xlim set_ylim plot scatter hist boxplot imshow cmap alpha bins tick_params annotate quiver contour barh stackplot subplots_adjust axhline axvline semilogx semilogy loglog polar streamplot hexbin pcolor tricontour errorbar clabel set_aspect violinplot set_axis_off spines text hatch plt axis plt.bar() plt.axis import figure pyplot highlight_text pypalettes plt.subplots() xlabel ylabel title legend colorbar savefig tight_layout grid set_xlim set_ylim plot scatter hist boxplot imshow cmap alpha bins tick_params annotate quiver contour barh stackplot subplots_adjust axhline axvline semilogx semilogy loglog polar streamplot hexbin pcolor tricontour errorbar clabel set_aspect violinplot set_axis_off spines text hatch plt axis plt.bar() plt.axis import figure pyplot highlight_text pypalettes plt.subplots() xlabel ylabel title legend colorbar savefig tight_layout grid set_xlim set_ylim plot scatter hist boxplot imshow cmap alpha bins tick_params annotate quiver contour barh stackplot subplots_adjust axhline axvline semilogx semilogy loglog polar streamplot hexbin pcolor tricontour errorbar clabel set_aspect violinplot set_axis_off spines text hatch plt axis plt.bar() plt.axis import figure pyplot highlight_text pypalettes plt.subplots() xlabel ylabel title legend colorbar savefig tight_layout grid set_xlim set_ylim plot scatter hist boxplot imshow cmap alpha bins tick_params annotate quiver contour barh stackplot subplots_adjust axhline axvline semilogx semilogy loglog polar streamplot hexbin pcolor tricontour errorbar clabel set_aspect violinplot set_axis_off spines text hatch plt axis plt.bar() plt.axis import figure pyplot highlight_text pypalettes plt.subplots() xlabel ylabel title legend colorbar savefig tight_layout grid set_xlim set_ylim plot scatter hist boxplot imshow cmap alpha bins tick_params annotate quiver contour barh stackplot subplots_adjust axhline axvline semilogx semilogy loglog polar streamplot hexbin pcolor tricontour errorbar clabel set_aspect violinplot set_axis_off spines text hatch plt axis plt.bar() plt.axis import figure pyplot highlight_text pypalettes plt.subplots() xlabel ylabel title legend colorbar savefig tight_layout grid set_xlim set_ylim plot scatter hist boxplot imshow cmap alpha bins tick_params annotate quiver contour barh stackplot subplots_adjust axhline axvline semilogx semilogy loglog polar streamplot hexbin pcolor tricontour errorbar clabel set_aspect violinplot set_axis_off spines text hatch plt axis plt.bar() plt.axis import figure pyplot highlight_text pypalettes plt.subplots() xlabel ylabel title legend colorbar savefig tight_layout grid set_xlim set_ylim plot scatter hist boxplot imshow cmap alpha bins tick_params annotate quiver contour barh stackplot subplots_adjust axhline axvline semilogx semilogy loglog polar streamplot hexbin pcolor tricontour errorbar clabel set_aspect violinplot set_axis_off spines text hatch plt axis plt.bar() plt.axis import figure pyplot highlight_text pypalettes plt.subplots() xlabel ylabel title legend colorbar savefig tight_layout grid set_xlim set_ylim plot scatter hist boxplot imshow cmap alpha bins tick_params annotate quiver contour barh stackplot subplots_adjust axhline axvline semilogx semilogy loglog polar streamplot hexbin pcolor tricontour errorbar clabel set_aspect violinplot set_axis_off spines text hatch plt axis plt.bar() plt.axis import figure pyplot highlight_text pypalettes plt.subplots() xlabel ylabel title legend colorbar savefig tight_layout grid set_xlim set_ylim plot scatter hist boxplot imshow cmap alpha bins tick_params annotate quiver contour barh stackplot subplots_adjust axhline axvline semilogx semilogy loglog polar streamplot hexbin pcolor tricontour errorbar clabel set_aspect violinplot set_axis_off spines text hatch plt axis plt.bar() plt.axis import figure pyplot highlight_text pypalettes plt.subplots() xlabel ylabel title legend colorbar savefig tight_layout grid set_xlim set_ylim plot scatter hist boxplot imshow cmap alpha bins tick_params annotate quiver contour barh stackplot subplots_adjust axhline axvline semilogx semilogy loglog polar streamplot hexbin pcolor tricontour errorbar clabel set_aspect violinplot set_axis_off spines text hatch plt axis plt.bar() plt.axis import figure pyplot highlight_text pypalettes plt.subplots() xlabel ylabel title legend colorbar savefig tight_layout grid set_xlim set_ylim plot scatter hist boxplot imshow cmap alpha bins tick_params annotate quiver contour barh stackplot subplots_adjust axhline axvline semilogx semilogy loglog polar streamplot hexbin pcolor tricontour errorbar clabel set_aspect violinplot set_axis_off spines text hatch plt axis plt.bar() plt.axis import figure pyplot highlight_text pypalettes plt.subplots() xlabel ylabel title legend colorbar savefig tight_layout grid set_xlim set_ylim plot scatter hist boxplot imshow cmap alpha bins tick_params annotate quiver contour barh stackplot subplots_adjust axhline axvline semilogx semilogy loglog polar streamplot hexbin pcolor tricontour errorbar clabel set_aspect violinplot set_axis_off spines text hatch plt axis plt.bar() plt.axis import figure pyplot highlight_text pypalettes plt.subplots() xlabel ylabel title legend colorbar savefig tight_layout grid set_xlim set_ylim plot scatter hist boxplot imshow cmap alpha bins tick_params annotate quiver contour barh stackplot subplots_adjust axhline axvline semilogx semilogy loglog polar streamplot hexbin pcolor tricontour errorbar clabel set_aspect violinplot set_axis_off spines text hatch plt axis plt.bar() plt.axis import figure pyplot highlight_text pypalettes plt.subplots() xlabel ylabel title legend colorbar savefig tight_layout grid set_xlim set_ylim plot scatter hist boxplot imshow cmap alpha bins tick_params annotate quiver contour barh stackplot subplots_adjust axhline axvline semilogx semilogy loglog polar streamplot hexbin pcolor tricontour errorbar clabel set_aspect violinplot set_axis_off spines text hatch plt axis plt.bar() plt.axis import figure pyplot highlight_text pypalettes plt.subplots() xlabel ylabel title legend colorbar savefig tight_layout grid set_xlim set_ylim plot scatter hist boxplot imshow cmap alpha bins tick_params annotate quiver contour barh stackplot subplots_adjust axhline axvline semilogx semilogy loglog polar streamplot hexbin pcolor tricontour errorbar clabel set_aspect violinplot set_axis_off spines text hatch plt axis plt.bar() plt.axis import figure pyplot highlight_text pypalettes plt.subplots() xlabel ylabel title legend colorbar savefig tight_layout grid set_xlim set_ylim plot scatter hist boxplot imshow cmap alpha bins tick_params annotate quiver contour barh stackplot subplots_adjust axhline axvline semilogx semilogy loglog polar streamplot hexbin pcolor tricontour errorbar clabel set_aspect violinplot set_axis_off spines text hatch plt axis plt.bar() plt.axis import figure pyplot highlight_text pypalettes plt.subplots() xlabel ylabel title legend colorbar savefig tight_layout grid set_xlim set_ylim plot scatter hist boxplot imshow cmap alpha bins tick_params annotate quiver contour barh stackplot subplots_adjust axhline axvline semilogx semilogy loglog polar streamplot hexbin pcolor tricontour errorbar clabel set_aspect violinplot set_axis_off spines text hatch plt axis plt.bar() plt.axis import figure pyplot highlight_text pypalettes plt.subplots() xlabel ylabel title legend colorbar savefig tight_layout grid set_xlim set_ylim plot scatter hist boxplot imshow cmap alpha bins tick_params annotate quiver contour barh stackplot subplots_adjust axhline axvline semilogx semilogy loglog polar streamplot hexbin pcolor tricontour errorbar clabel set_aspect violinplot set_axis_off spines text hatch plt axis plt.bar() plt.axis import figure pyplot highlight_text pypalettes plt.subplots() xlabel ylabel title legend colorbar savefig tight_layout grid set_xlim set_ylim plot scatter hist boxplot imshow cmap alpha bins tick_params annotate quiver contour barh stackplot subplots_adjust axhline axvline semilogx semilogy loglog polar streamplot hexbin pcolor tricontour errorbar clabel set_aspect violinplot set_axis_off spines text hatch plt axis plt.bar() plt.axis import figure pyplot highlight_text pypalettes plt.subplots() xlabel ylabel title legend colorbar savefig tight_layout grid set_xlim set_ylim plot scatter hist boxplot imshow cmap alpha bins tick_params annotate quiver contour barh stackplot subplots_adjust axhline axvline semilogx semilogy loglog polar streamplot hexbin pcolor tricontour errorbar clabel set_aspect violinplot set_axis_off spines text hatch plt axis plt.bar() plt.axis import figure pyplot highlight_text pypalettes plt.subplots() xlabel ylabel title legend colorbar savefig tight_layout grid set_xlim set_ylim plot scatter hist boxplot imshow cmap alpha bins tick_params annotate quiver contour barh stackplot subplots_adjust axhline axvline semilogx semilogy loglog polar streamplot hexbin pcolor tricontour errorbar clabel set_aspect violinplot set_axis_off spines text hatch plt axis plt.bar() plt.axis import figure pyplot highlight_text pypalettes plt.subplots() xlabel ylabel title legend colorbar savefig tight_layout grid set_xlim set_ylim plot scatter hist boxplot imshow cmap alpha bins tick_params annotate quiver contour barh stackplot subplots_adjust axhline axvline semilogx semilogy loglog polar streamplot hexbin pcolor tricontour errorbar clabel set_aspect violinplot set_axis_off spines text hatch plt axis plt.bar() plt.axis import figure pyplot highlight_text pypalettes plt.subplots() xlabel ylabel title legend colorbar savefig tight_layout grid set_xlim set_ylim plot scatter hist boxplot imshow cmap alpha bins tick_params annotate quiver contour barh stackplot subplots_adjust axhline axvline semilogx semilogy loglog polar streamplot hexbin pcolor tricontour errorbar clabel set_aspect violinplot set_axis_off spines text hatch plt axis plt.bar() plt.axis import figure pyplot highlight_text pypalettes plt.subplots() xlabel ylabel title legend colorbar savefig tight_layout grid set_xlim set_ylim plot scatter hist boxplot imshow cmap alpha bins tick_params annotate quiver contour barh stackplot subplots_adjust axhline axvline semilogx semilogy loglog polar streamplot hexbin pcolor tricontour errorbar clabel set_aspect violinplot set_axis_off spines text hatch plt axis plt.bar() plt.axis import figure pyplot highlight_text pypalettes plt.subplots() xlabel ylabel title legend colorbar savefig tight_layout grid set_xlim set_ylim plot scatter hist boxplot imshow cmap alpha bins tick_params annotate quiver contour barh stackplot subplots_adjust axhline axvline semilogx semilogy loglog polar streamplot hexbin pcolor tricontour errorbar clabel set_aspect violinplot set_axis_off spines text hatch plt axis plt.bar() plt.axis import figure pyplot highlight_text pypalettes plt.subplots() xlabel ylabel title legend colorbar savefig tight_layout grid set_xlim set_ylim plot scatter hist boxplot imshow cmap alpha bins tick_params annotate quiver contour barh stackplot subplots_adjust axhline axvline semilogx semilogy loglog polar streamplot hexbin pcolor tricontour errorbar clabel set_aspect violinplot set_axis_off spines text hatch plt axis plt.bar() plt.axis import figure pyplot highlight_text pypalettes plt.subplots() xlabel ylabel title legend colorbar savefig tight_layout grid set_xlim set_ylim plot scatter hist boxplot imshow cmap alpha bins tick_params annotate quiver contour barh stackplot subplots_adjust axhline axvline semilogx semilogy loglog polar streamplot hexbin pcolor tricontour errorbar clabel set_aspect violinplot set_axis_off spines text hatch plt axis plt.bar() plt.axis import figure pyplot highlight_text pypalettes plt.subplots() xlabel ylabel title legend colorbar savefig tight_layout grid set_xlim set_ylim plot scatter hist boxplot imshow cmap alpha bins tick_params annotate quiver contour barh stackplot subplots_adjust axhline axvline semilogx semilogy loglog polar streamplot hexbin pcolor tricontour errorbar clabel set_aspect violinplot set_axis_off spines text hatch plt axis plt.bar() plt.axis import figure pyplot highlight_text pypalettes plt.subplots() xlabel ylabel title legend colorbar savefig tight_layout grid set_xlim set_ylim plot scatter hist boxplot imshow cmap alpha bins tick_params annotate quiver contour barh stackplot subplots_adjust axhline axvline semilogx semilogy loglog polar streamplot hexbin pcolor tricontour errorbar clabel set_aspect violinplot set_axis_off spines text hatch plt axis plt.bar() plt.axis import figure pyplot highlight_text pypalettes plt.subplots() xlabel ylabel title legend colorbar savefig tight_layout grid set_xlim set_ylim plot scatter hist boxplot imshow cmap alpha bins tick_params annotate quiver contour barh stackplot subplots_adjust axhline axvline semilogx semilogy loglog polar streamplot hexbin pcolor tricontour errorbar clabel set_aspect violinplot set_axis_off spines text hatch plt axis plt.bar() plt.axis import figure pyplot highlight_text pypalettes plt.subplots() xlabel ylabel title legend colorbar savefig tight_layout grid set_xlim set_ylim plot scatter hist boxplot imshow cmap alpha bins tick_params annotate quiver contour barh stackplot subplots_adjust axhline axvline semilogx semilogy loglog polar streamplot hexbin pcolor tricontour errorbar clabel set_aspect violinplot set_axis_off spines text hatch plt axis plt.bar() plt.axis import figure pyplot highlight_text pypalettes plt.subplots() xlabel ylabel title legend colorbar savefig tight_layout grid set_xlim set_ylim plot scatter hist boxplot imshow cmap alpha bins tick_params annotate quiver contour barh stackplot subplots_adjust axhline axvline semilogx semilogy loglog polar streamplot hexbin pcolor tricontour errorbar clabel set_aspect violinplot set_axis_off spines text hatch plt axis plt.bar() plt.axis import figure pyplot highlight_text pypalettes plt.subplots() xlabel ylabel title legend colorbar savefig tight_layout grid set_xlim set_ylim plot scatter hist boxplot imshow cmap alpha bins tick_params annotate quiver contour barh stackplot subplots_adjust axhline axvline semilogx semilogy loglog polar streamplot hexbin pcolor tricontour errorbar clabel set_aspect violinplot set_axis_off spines text hatch plt axis plt.bar() plt.axis import figure pyplot highlight_text pypalettes plt.subplots() xlabel ylabel title legend colorbar savefig tight_layout grid set_xlim set_ylim plot scatter hist boxplot imshow cmap alpha bins tick_params annotate quiver contour barh stackplot subplots_adjust axhline axvline semilogx semilogy loglog polar streamplot hexbin pcolor tricontour errorbar clabel set_aspect violinplot set_axis_off spines text hatch plt axis plt.bar() plt.axis import figure pyplot highlight_text pypalettes plt.subplots() xlabel ylabel title legend colorbar savefig tight_layout grid set_xlim set_ylim plot scatter hist boxplot imshow cmap alpha bins tick_params annotate quiver contour barh stackplot subplots_adjust axhline axvline semilogx semilogy loglog polar streamplot hexbin pcolor tricontour errorbar clabel set_aspect violinplot set_axis_off spines text hatch plt axis plt.bar() plt.axis import figure pyplot highlight_text pypalettes plt.subplots() xlabel ylabel title legend colorbar savefig tight_layout grid set_xlim set_ylim plot scatter hist boxplot imshow cmap alpha bins tick_params annotate quiver contour barh stackplot subplots_adjust axhline axvline semilogx semilogy loglog polar streamplot hexbin pcolor tricontour errorbar clabel set_aspect violinplot set_axis_off spines text hatch plt axis plt.bar() plt.axis import figure pyplot highlight_text pypalettes plt.subplots() xlabel ylabel title legend colorbar savefig tight_layout grid set_xlim set_ylim plot scatter hist boxplot imshow cmap alpha bins tick_params annotate quiver contour barh stackplot subplots_adjust axhline axvline semilogx semilogy loglog polar streamplot hexbin pcolor tricontour errorbar clabel set_aspect violinplot set_axis_off spines text hatch plt axis plt.bar() plt.axis import figure pyplot highlight_text pypalettes plt.subplots() xlabel ylabel title legend colorbar savefig tight_layout grid set_xlim set_ylim plot scatter hist boxplot imshow cmap alpha bins tick_params annotate quiver contour barh stackplot subplots_adjust axhline axvline semilogx semilogy loglog polar streamplot hexbin pcolor tricontour errorbar clabel set_aspect violinplot set_axis_off spines text hatch plt axis plt.bar() plt.axis import figure pyplot highlight_text pypalettes plt.subplots() xlabel ylabel title legend colorbar savefig tight_layout grid set_xlim set_ylim plot scatter hist boxplot imshow cmap alpha bins tick_params annotate quiver contour barh stackplot subplots_adjust axhline axvline semilogx semilogy loglog polar streamplot hexbin pcolor tricontour errorbar clabel set_aspect violinplot set_axis_off spines text hatch plt axis plt.bar() plt.axis import figure pyplot highlight_text pypalettes plt.subplots() xlabel ylabel title legend colorbar savefig tight_layout grid set_xlim set_ylim plot scatter hist boxplot imshow cmap alpha bins tick_params annotate quiver contour barh stackplot subplots_adjust axhline axvline semilogx semilogy loglog polar streamplot hexbin pcolor tricontour errorbar clabel set_aspect violinplot set_axis_off spines text hatch plt axis plt.bar() plt.axis import figure pyplot highlight_text pypalettes plt.subplots() xlabel ylabel title legend colorbar savefig tight_layout grid set_xlim set_ylim plot scatter hist boxplot imshow cmap alpha bins tick_params annotate quiver contour barh stackplot subplots_adjust axhline axvline semilogx semilogy loglog polar streamplot hexbin pcolor tricontour errorbar clabel set_aspect violinplot set_axis_off spines text hatch plt axis plt.bar() plt.axis import figure pyplot highlight_text pypalettes plt.subplots() xlabel ylabel title legend colorbar savefig tight_layout grid set_xlim set_ylim plot scatter hist boxplot imshow cmap alpha bins tick_params annotate quiver contour barh stackplot subplots_adjust axhline axvline semilogx semilogy loglog polar streamplot hexbin pcolor tricontour errorbar clabel set_aspect violinplot set_axis_off spines text hatch plt axis plt.bar() plt.axis import figure pyplot highlight_text pypalettes plt.subplots() xlabel ylabel title legend colorbar savefig tight_layout grid set_xlim set_ylim plot scatter hist boxplot imshow cmap alpha bins tick_params annotate quiver contour barh stackplot subplots_adjust axhline axvline semilogx semilogy loglog polar streamplot hexbin pcolor tricontour errorbar clabel set_aspect violinplot set_axis_off spines text hatch plt axis plt.bar() plt.axis import figure pyplot highlight_text pypalettes plt.subplots() xlabel ylabel title legend colorbar savefig tight_layout grid set_xlim set_ylim plot scatter hist boxplot imshow cmap alpha bins tick_params annotate quiver contour barh stackplot subplots_adjust axhline axvline semilogx semilogy loglog polar streamplot hexbin pcolor tricontour errorbar clabel set_aspect violinplot set_axis_off spines text hatch plt axis plt.bar() plt.axis import figure pyplot highlight_text pypalettes plt.subplots() xlabel ylabel title legend colorbar savefig tight_layout grid set_xlim set_ylim plot scatter hist boxplot imshow cmap alpha bins tick_params annotate quiver contour barh stackplot subplots_adjust axhline axvline semilogx semilogy loglog polar streamplot hexbin pcolor tricontour errorbar clabel set_aspect violinplot set_axis_off spines text hatch plt axis plt.bar() plt.axis import figure pyplot highlight_text pypalettes plt.subplots() xlabel ylabel title legend colorbar savefig tight_layout grid set_xlim set_ylim plot scatter hist boxplot imshow cmap alpha bins tick_params annotate quiver contour barh stackplot subplots_adjust axhline axvline semilogx semilogy loglog polar streamplot hexbin pcolor tricontour errorbar clabel set_aspect violinplot set_axis_off spines text hatch plt axis plt.bar() plt.axis import figure pyplot highlight_text pypalettes plt.subplots() xlabel ylabel title legend colorbar savefig tight_layout grid set_xlim set_ylim plot scatter hist boxplot imshow cmap alpha bins tick_params annotate quiver contour barh stackplot subplots_adjust axhline axvline semilogx semilogy loglog polar streamplot hexbin pcolor tricontour errorbar clabel set_aspect violinplot set_axis_off spines text hatch plt axis plt.bar() plt.axis import figure pyplot highlight_text pypalettes plt.subplots() xlabel ylabel title legend colorbar savefig tight_layout grid set_xlim set_ylim plot scatter hist boxplot imshow cmap alpha bins tick_params annotate quiver contour barh stackplot subplots_adjust axhline axvline semilogx semilogy loglog polar streamplot hexbin pcolor tricontour errorbar clabel set_aspect violinplot set_axis_off spines text hatch plt axis plt.bar() plt.axis import figure pyplot highlight_text pypalettes plt.subplots() xlabel ylabel title legend colorbar savefig tight_layout grid set_xlim set_ylim plot scatter hist boxplot imshow cmap alpha bins tick_params annotate quiver contour barh stackplot subplots_adjust axhline axvline semilogx semilogy loglog polar streamplot hexbin pcolor tricontour errorbar clabel set_aspect violinplot set_axis_off spines text hatch plt axis plt.bar() plt.axis import figure pyplot highlight_text pypalettes plt.subplots() xlabel ylabel title legend colorbar savefig tight_layout grid set_xlim set_ylim plot scatter hist boxplot imshow cmap alpha bins tick_params annotate quiver contour barh stackplot subplots_adjust axhline axvline semilogx semilogy loglog polar streamplot hexbin pcolor tricontour errorbar clabel set_aspect violinplot set_axis_off spines text hatch plt axis plt.bar() plt.axis import figure pyplot highlight_text pypalettes plt.subplots() xlabel ylabel title legend colorbar savefig tight_layout grid set_xlim set_ylim plot scatter hist boxplot imshow cmap alpha bins tick_params annotate quiver contour barh stackplot subplots_adjust axhline axvline semilogx semilogy loglog polar streamplot hexbin pcolor tricontour errorbar clabel set_aspect violinplot set_axis_off spines text hatch plt axis plt.bar() plt.axis import figure pyplot highlight_text pypalettes plt.subplots() xlabel ylabel title legend colorbar savefig tight_layout grid set_xlim set_ylim plot scatter hist boxplot imshow cmap alpha bins tick_params annotate quiver contour barh stackplot subplots_adjust axhline axvline semilogx semilogy loglog polar streamplot hexbin pcolor tricontour errorbar clabel set_aspect violinplot set_axis_off spines text hatch plt axis plt.bar() plt.axis import figure pyplot highlight_text pypalettes plt.subplots() xlabel ylabel title legend colorbar savefig tight_layout grid set_xlim set_ylim plot scatter hist boxplot imshow cmap alpha bins tick_params annotate quiver contour barh stackplot subplots_adjust axhline axvline semilogx semilogy loglog polar streamplot hexbin pcolor tricontour errorbar clabel set_aspect violinplot set_axis_off spines text hatch plt axis plt.bar() plt.axis import figure pyplot highlight_text pypalettes plt.subplots() xlabel ylabel title legend colorbar savefig tight_layout grid set_xlim set_ylim plot scatter hist boxplot imshow cmap alpha bins tick_params annotate quiver contour barh stackplot subplots_adjust axhline axvline semilogx semilogy loglog polar streamplot hexbin pcolor tricontour errorbar clabel set_aspect violinplot set_axis_off spines text hatch plt axis plt.bar() plt.axis import figure pyplot highlight_text pypalettes plt.subplots() xlabel ylabel title legend colorbar savefig tight_layout grid set_xlim set_ylim plot scatter hist boxplot imshow cmap alpha bins tick_params annotate quiver contour barh stackplot subplots_adjust axhline axvline semilogx semilogy loglog polar streamplot hexbin pcolor tricontour errorbar clabel set_aspect violinplot set_axis_off spines text hatch plt axis plt.bar() plt.axis import figure pyplot highlight_text pypalettes plt.subplots() xlabel ylabel title legend colorbar savefig tight_layout grid set_xlim set_ylim plot scatter hist boxplot imshow cmap alpha bins tick_params annotate quiver contour barh stackplot subplots_adjust axhline axvline semilogx semilogy loglog polar streamplot hexbin pcolor tricontour errorbar clabel set_aspect violinplot set_axis_off spines text hatch plt axis plt.bar() plt.axis import figure pyplot highlight_text pypalettes plt.subplots() xlabel ylabel title legend colorbar savefig tight_layout grid set_xlim set_ylim plot scatter hist boxplot imshow cmap alpha bins tick_params annotate quiver contour barh stackplot subplots_adjust axhline axvline semilogx semilogy loglog polar streamplot hexbin pcolor tricontour errorbar clabel set_aspect violinplot set_axis_off spines text hatch plt axis plt.bar() plt.axis import figure pyplot highlight_text pypalettes plt.subplots() xlabel ylabel title legend colorbar savefig tight_layout grid set_xlim set_ylim plot scatter hist boxplot imshow cmap alpha bins tick_params annotate quiver contour barh stackplot subplots_adjust axhline axvline semilogx semilogy loglog polar streamplot hexbin pcolor tricontour errorbar clabel set_aspect violinplot set_axis_off spines text hatch plt axis plt.bar() plt.axis import figure pyplot highlight_text pypalettes plt.subplots() xlabel ylabel title legend colorbar savefig tight_layout grid set_xlim set_ylim plot scatter hist boxplot imshow cmap alpha bins tick_params annotate quiver contour barh stackplot subplots_adjust axhline axvline semilogx semilogy loglog polar streamplot hexbin pcolor tricontour errorbar clabel set_aspect violinplot set_axis_off spines text hatch plt axis plt.bar() plt.axis import figure pyplot highlight_text pypalettes plt.subplots() xlabel ylabel title legend colorbar savefig tight_layout grid set_xlim set_ylim plot scatter hist boxplot imshow cmap alpha bins tick_params annotate quiver contour barh stackplot subplots_adjust axhline axvline semilogx semilogy loglog polar streamplot hexbin pcolor tricontour errorbar clabel set_aspect violinplot set_axis_off spines text hatch plt axis plt.bar() plt.axis import figure pyplot highlight_text pypalettes plt.subplots() xlabel ylabel title legend colorbar savefig tight_layout grid set_xlim set_ylim plot scatter hist boxplot imshow cmap alpha bins tick_params annotate quiver contour barh stackplot subplots_adjust axhline axvline semilogx semilogy loglog polar streamplot hexbin pcolor tricontour errorbar clabel set_aspect violinplot set_axis_off spines text hatch plt axis plt.bar() plt.axis import figure pyplot highlight_text pypalettes plt.subplots() xlabel ylabel title legend colorbar savefig tight_layout grid set_xlim set_ylim plot scatter hist boxplot imshow cmap alpha bins tick_params annotate quiver contour barh stackplot subplots_adjust axhline axvline semilogx semilogy loglog polar streamplot hexbin pcolor tricontour errorbar clabel set_aspect violinplot set_axis_off spines text hatch plt axis plt.bar() plt.axis import figure pyplot highlight_text pypalettes plt.subplots() xlabel ylabel title legend colorbar savefig tight_layout grid set_xlim set_ylim plot scatter hist boxplot imshow cmap alpha bins tick_params annotate quiver contour barh stackplot subplots_adjust axhline axvline semilogx semilogy loglog polar streamplot hexbin pcolor tricontour errorbar clabel set_aspect violinplot set_axis_off spines text hatch plt axis plt.bar() plt.axis import figure pyplot highlight_text pypalettes plt.subplots() xlabel ylabel title legend colorbar savefig tight_layout grid set_xlim set_ylim plot scatter hist boxplot imshow cmap alpha bins tick_params annotate quiver contour barh stackplot subplots_adjust axhline axvline semilogx semilogy loglog polar streamplot hexbin pcolor tricontour errorbar clabel set_aspect violinplot set_axis_off spines text hatch plt axis plt.bar() plt.axis import figure pyplot highlight_text pypalettes plt.subplots() xlabel ylabel title legend colorbar savefig tight_layout grid set_xlim set_ylim plot scatter hist boxplot imshow cmap alpha bins tick_params annotate quiver contour barh stackplot subplots_adjust axhline axvline semilogx semilogy loglog polar streamplot hexbin pcolor tricontour errorbar clabel set_aspect violinplot set_axis_off spines text hatch plt axis plt.bar() plt.axis import figure pyplot highlight_text pypalettes plt.subplots() xlabel ylabel title legend colorbar savefig tight_layout grid set_xlim set_ylim plot scatter hist boxplot imshow cmap alpha bins tick_params annotate quiver contour barh stackplot subplots_adjust axhline axvline semilogx semilogy loglog polar streamplot hexbin pcolor tricontour errorbar clabel set_aspect violinplot set_axis_off spines text hatch plt axis plt.bar() plt.axis import figure pyplot highlight_text pypalettes plt.subplots() xlabel ylabel title legend colorbar savefig tight_layout grid set_xlim set_ylim plot scatter hist boxplot imshow cmap alpha bins tick_params annotate quiver contour barh stackplot subplots_adjust axhline axvline semilogx semilogy loglog polar streamplot hexbin pcolor tricontour errorbar clabel set_aspect violinplot set_axis_off spines text hatch plt axis plt.bar() plt.axis import figure pyplot highlight_text pypalettes plt.subplots() xlabel ylabel title legend colorbar savefig tight_layout grid set_xlim set_ylim plot scatter hist boxplot imshow cmap alpha bins tick_params annotate quiver contour barh stackplot subplots_adjust axhline axvline semilogx semilogy loglog polar streamplot hexbin pcolor tricontour errorbar clabel set_aspect violinplot set_axis_off spines text hatch plt axis plt.bar() plt.axis import figure pyplot highlight_text pypalettes plt.subplots() xlabel ylabel title legend colorbar savefig tight_layout grid set_xlim set_ylim plot scatter hist boxplot imshow cmap alpha bins tick_params annotate quiver contour barh stackplot subplots_adjust axhline axvline semilogx semilogy loglog polar streamplot hexbin pcolor tricontour errorbar clabel set_aspect violinplot set_axis_off spines text hatch plt axis plt.bar() plt.axis import figure pyplot highlight_text pypalettes plt.subplots() xlabel ylabel title legend colorbar savefig tight_layout grid set_xlim set_ylim plot scatter hist boxplot imshow cmap alpha bins tick_params annotate quiver contour barh stackplot subplots_adjust axhline axvline semilogx semilogy loglog polar streamplot hexbin pcolor tricontour errorbar clabel set_aspect violinplot set_axis_off spines text hatch plt axis plt.bar() plt.axis import figure pyplot highlight_text pypalettes plt.subplots() xlabel ylabel title legend colorbar savefig tight_layout grid set_xlim set_ylim plot scatter hist boxplot imshow cmap alpha bins tick_params annotate quiver contour barh stackplot subplots_adjust axhline axvline semilogx semilogy loglog polar streamplot hexbin pcolor tricontour errorbar clabel set_aspect violinplot set_axis_off spines text hatch plt axis plt.bar() plt.axis import figure pyplot highlight_text pypalettes plt.subplots() xlabel ylabel title legend colorbar savefig tight_layout grid set_xlim set_ylim plot scatter hist boxplot imshow cmap alpha bins tick_params annotate quiver contour barh stackplot subplots_adjust axhline axvline semilogx semilogy loglog polar streamplot hexbin pcolor tricontour errorbar clabel set_aspect violinplot set_axis_off spines text hatch plt axis plt.bar() plt.axis import figure pyplot highlight_text pypalettes plt.subplots() xlabel ylabel title legend colorbar savefig tight_layout grid set_xlim set_ylim plot scatter hist boxplot imshow cmap alpha bins tick_params annotate quiver contour barh stackplot subplots_adjust axhline axvline semilogx semilogy loglog polar streamplot hexbin pcolor tricontour errorbar clabel set_aspect violinplot set_axis_off spines text hatch plt axis plt.bar() plt.axis import figure pyplot highlight_text pypalettes plt.subplots() xlabel ylabel title legend colorbar savefig tight_layout grid set_xlim set_ylim plot scatter hist boxplot imshow cmap alpha bins tick_params annotate quiver contour barh stackplot subplots_adjust axhline axvline semilogx semilogy loglog polar streamplot hexbin pcolor tricontour errorbar clabel set_aspect violinplot set_axis_off spines text hatch plt axis plt.bar() plt.axis import figure pyplot highlight_text pypalettes plt.subplots() xlabel ylabel title legend colorbar savefig tight_layout grid set_xlim set_ylim plot scatter hist boxplot imshow cmap alpha bins tick_params annotate quiver contour barh stackplot subplots_adjust axhline axvline semilogx semilogy loglog polar streamplot hexbin pcolor tricontour errorbar clabel set_aspect violinplot set_axis_off spines text hatch plt axis plt.bar() plt.axis import figure pyplot highlight_text pypalettes plt.subplots() xlabel ylabel title legend colorbar savefig tight_layout grid set_xlim set_ylim plot scatter hist boxplot imshow cmap alpha bins tick_params annotate quiver contour barh stackplot subplots_adjust axhline axvline semilogx semilogy loglog polar streamplot hexbin pcolor tricontour errorbar clabel set_aspect violinplot set_axis_off spines text hatch plt axis plt.bar() plt.axis import figure pyplot highlight_text pypalettes plt.subplots() xlabel ylabel title legend colorbar savefig tight_layout grid set_xlim set_ylim plot scatter hist boxplot imshow cmap alpha bins tick_params annotate quiver contour barh stackplot subplots_adjust axhline axvline semilogx semilogy loglog polar streamplot hexbin pcolor tricontour errorbar clabel set_aspect violinplot set_axis_off spines text hatch plt axis plt.bar() plt.axis import figure pyplot highlight_text pypalettes plt.subplots() xlabel ylabel title legend colorbar savefig tight_layout grid set_xlim set_ylim plot scatter hist boxplot imshow cmap alpha bins tick_params annotate quiver contour barh stackplot subplots_adjust axhline axvline semilogx semilogy loglog polar streamplot hexbin pcolor tricontour errorbar clabel set_aspect violinplot set_axis_off spines text hatch plt axis plt.bar() plt.axis import figure pyplot highlight_text pypalettes plt.subplots() xlabel ylabel title legend colorbar savefig tight_layout grid set_xlim set_ylim plot scatter hist boxplot imshow cmap alpha bins tick_params annotate quiver contour barh stackplot subplots_adjust axhline axvline semilogx semilogy loglog polar streamplot hexbin pcolor tricontour errorbar clabel set_aspect violinplot set_axis_off spines text hatch plt axis plt.bar() plt.axis import figure pyplot highlight_text pypalettes plt.subplots() xlabel ylabel title legend colorbar savefig tight_layout grid set_xlim set_ylim plot scatter hist boxplot imshow cmap alpha bins tick_params annotate quiver contour barh stackplot subplots_adjust axhline axvline semilogx semilogy loglog polar streamplot hexbin pcolor tricontour errorbar clabel set_aspect violinplot set_axis_off spines text hatch plt axis plt.bar() plt.axis import figure pyplot highlight_text pypalettes plt.subplots() xlabel ylabel title legend colorbar savefig tight_layout grid set_xlim set_ylim plot scatter hist boxplot imshow cmap alpha bins tick_params annotate quiver contour barh stackplot subplots_adjust axhline axvline semilogx semilogy loglog polar streamplot hexbin pcolor tricontour errorbar clabel set_aspect violinplot set_axis_off spines text hatch plt axis plt.bar() plt.axis import figure pyplot highlight_text pypalettes plt.subplots() xlabel ylabel title legend colorbar savefig tight_layout grid set_xlim set_ylim plot scatter hist boxplot imshow cmap alpha bins tick_params annotate quiver contour barh stackplot subplots_adjust axhline axvline semilogx semilogy loglog polar streamplot hexbin pcolor tricontour errorbar clabel set_aspect violinplot set_axis_off spines text hatch plt axis plt.bar() plt.axis import figure pyplot highlight_text pypalettes plt.subplots() xlabel ylabel title legend colorbar savefig tight_layout grid set_xlim set_ylim plot scatter hist boxplot imshow cmap alpha bins tick_params annotate quiver contour barh stackplot subplots_adjust axhline axvline semilogx semilogy loglog polar streamplot hexbin pcolor tricontour errorbar clabel set_aspect violinplot set_axis_off spines text hatch plt axis plt.bar() plt.axis import figure pyplot highlight_text pypalettes plt.subplots() xlabel ylabel title legend colorbar savefig tight_layout grid set_xlim set_ylim plot scatter hist boxplot imshow cmap alpha bins tick_params annotate quiver contour barh stackplot subplots_adjust axhline axvline semilogx semilogy loglog polar streamplot hexbin pcolor tricontour errorbar clabel set_aspect violinplot set_axis_off spines text hatch plt axis plt.bar() plt.axis import figure pyplot highlight_text pypalettes plt.subplots() xlabel ylabel title legend colorbar savefig tight_layout grid set_xlim set_ylim plot scatter hist boxplot imshow cmap alpha bins tick_params annotate quiver contour barh stackplot subplots_adjust axhline axvline semilogx semilogy loglog polar streamplot hexbin pcolor tricontour errorbar clabel set_aspect violinplot set_axis_off spines text hatch plt axis plt.bar() plt.axis import figure pyplot highlight_text pypalettes plt.subplots() xlabel ylabel title legend colorbar savefig tight_layout grid set_xlim set_ylim plot scatter hist boxplot imshow cmap alpha bins tick_params annotate quiver contour barh stackplot subplots_adjust axhline axvline semilogx semilogy loglog polar streamplot hexbin pcolor tricontour errorbar clabel set_aspect violinplot set_axis_off spines text hatch plt axis plt.bar() plt.axis import figure pyplot highlight_text pypalettes plt.subplots() xlabel ylabel title legend colorbar savefig tight_layout grid set_xlim set_ylim plot scatter hist boxplot imshow cmap alpha bins tick_params annotate quiver contour barh stackplot subplots_adjust axhline axvline semilogx semilogy loglog polar streamplot hexbin pcolor tricontour errorbar clabel set_aspect violinplot set_axis_off spines text hatch plt axis plt.bar() plt.axis import figure pyplot highlight_text pypalettes plt.subplots() xlabel ylabel title legend colorbar savefig tight_layout grid set_xlim set_ylim plot scatter hist boxplot imshow cmap alpha bins tick_params annotate quiver contour barh stackplot subplots_adjust axhline axvline semilogx semilogy loglog polar streamplot hexbin pcolor tricontour errorbar clabel set_aspect violinplot set_axis_off spines text hatch plt axis plt.bar() plt.axis import figure pyplot highlight_text pypalettes plt.subplots() xlabel ylabel title legend colorbar savefig tight_layout grid set_xlim set_ylim plot scatter hist boxplot imshow cmap alpha bins tick_params annotate quiver contour barh stackplot subplots_adjust axhline axvline semilogx semilogy loglog polar streamplot hexbin pcolor tricontour errorbar clabel set_aspect violinplot set_axis_off spines text hatch plt axis plt.bar() plt.axis import figure pyplot highlight_text pypalettes plt.subplots() xlabel ylabel title legend colorbar savefig tight_layout grid set_xlim set_ylim plot scatter hist boxplot imshow cmap alpha bins tick_params annotate quiver contour barh stackplot subplots_adjust axhline axvline semilogx semilogy loglog polar streamplot hexbin pcolor tricontour errorbar clabel set_aspect violinplot set_axis_off spines text hatch plt axis plt.bar() plt.axis import figure pyplot highlight_text pypalettes plt.subplots() xlabel ylabel title legend colorbar savefig tight_layout grid set_xlim set_ylim plot scatter hist boxplot imshow cmap alpha bins tick_params annotate quiver contour barh stackplot subplots_adjust axhline axvline semilogx semilogy loglog polar streamplot hexbin pcolor tricontour errorbar clabel set_aspect violinplot set_axis_off spines text hatch plt axis plt.bar() plt.axis import figure pyplot highlight_text pypalettes plt.subplots() xlabel ylabel title legend colorbar savefig tight_layout grid set_xlim set_ylim plot scatter hist boxplot imshow cmap alpha bins tick_params annotate quiver contour barh stackplot subplots_adjust axhline axvline semilogx semilogy loglog polar streamplot hexbin pcolor tricontour errorbar clabel set_aspect violinplot set_axis_off spines text hatch plt axis plt.bar() plt.axis import figure pyplot highlight_text pypalettes plt.subplots() xlabel ylabel title legend colorbar savefig tight_layout grid set_xlim set_ylim plot scatter hist boxplot imshow cmap alpha bins tick_params annotate quiver contour barh stackplot subplots_adjust axhline axvline semilogx semilogy loglog polar streamplot hexbin pcolor tricontour errorbar clabel set_aspect violinplot set_axis_off spines text hatch plt axis plt.bar() plt.axis import figure pyplot highlight_text pypalettes plt.subplots() xlabel ylabel title legend colorbar savefig tight_layout grid set_xlim set_ylim plot scatter hist boxplot imshow cmap alpha bins tick_params annotate quiver contour barh stackplot subplots_adjust axhline axvline semilogx semilogy loglog polar streamplot hexbin pcolor tricontour errorbar clabel set_aspect violinplot set_axis_off spines text hatch plt axis plt.bar() plt.axis import figure pyplot highlight_text pypalettes plt.subplots() xlabel ylabel title legend colorbar savefig tight_layout grid set_xlim set_ylim plot scatter hist boxplot imshow cmap alpha bins tick_params annotate quiver contour barh stackplot subplots_adjust axhline axvline semilogx semilogy loglog polar streamplot hexbin pcolor tricontour errorbar clabel set_aspect violinplot set_axis_off spines text hatch plt axis plt.bar() plt.axis import figure pyplot highlight_text pypalettes plt.subplots() xlabel ylabel title legend colorbar savefig tight_layout grid set_xlim set_ylim plot scatter hist boxplot imshow cmap alpha bins tick_params annotate quiver contour barh stackplot subplots_adjust axhline axvline semilogx semilogy loglog polar streamplot hexbin pcolor tricontour errorbar clabel set_aspect violinplot set_axis_off spines text hatch plt axis plt.bar() plt.axis import figure pyplot highlight_text pypalettes plt.subplots() xlabel ylabel title legend colorbar savefig tight_layout grid set_xlim set_ylim plot scatter hist boxplot imshow cmap alpha bins tick_params annotate quiver contour barh stackplot subplots_adjust axhline axvline semilogx semilogy loglog polar streamplot hexbin pcolor tricontour errorbar clabel set_aspect violinplot set_axis_off spines text hatch plt axis plt.bar() plt.axis import figure pyplot highlight_text pypalettes plt.subplots() xlabel ylabel title legend colorbar savefig tight_layout grid set_xlim set_ylim plot scatter hist boxplot imshow cmap alpha bins tick_params annotate quiver contour barh stackplot subplots_adjust axhline axvline semilogx semilogy loglog polar streamplot hexbin pcolor tricontour errorbar clabel set_aspect violinplot set_axis_off spines text hatch plt axis plt.bar() plt.axis import figure pyplot highlight_text pypalettes plt.subplots() xlabel ylabel title legend colorbar savefig tight_layout grid set_xlim set_ylim plot scatter hist boxplot imshow cmap alpha bins tick_params annotate quiver contour barh stackplot subplots_adjust axhline axvline semilogx semilogy loglog polar streamplot hexbin pcolor tricontour errorbar clabel set_aspect violinplot set_axis_off spines text hatch plt axis plt.bar() plt.axis import figure pyplot highlight_text pypalettes plt.subplots() xlabel ylabel title legend colorbar savefig tight_layout grid set_xlim set_ylim plot scatter hist boxplot imshow cmap alpha bins tick_params annotate quiver contour barh stackplot subplots_adjust axhline axvline semilogx semilogy loglog polar streamplot hexbin pcolor tricontour errorbar clabel set_aspect violinplot set_axis_off spines text hatch plt axis plt.bar() plt.axis import figure pyplot highlight_text pypalettes plt.subplots() xlabel ylabel title legend colorbar savefig tight_layout grid set_xlim set_ylim plot scatter hist boxplot imshow cmap alpha bins tick_params annotate quiver contour barh stackplot subplots_adjust axhline axvline semilogx semilogy loglog polar streamplot hexbin pcolor tricontour errorbar clabel set_aspect violinplot set_axis_off spines text hatch plt axis plt.bar() plt.axis import figure pyplot highlight_text pypalettes plt.subplots() xlabel ylabel title legend colorbar savefig tight_layout grid set_xlim set_ylim plot scatter hist boxplot imshow cmap alpha bins tick_params annotate quiver contour barh stackplot subplots_adjust axhline axvline semilogx semilogy loglog polar streamplot hexbin pcolor tricontour errorbar clabel set_aspect violinplot set_axis_off spines text hatch plt axis plt.bar() plt.axis import figure pyplot highlight_text pypalettes plt.subplots() xlabel ylabel title legend colorbar savefig tight_layout grid set_xlim set_ylim plot scatter hist boxplot imshow cmap alpha bins tick_params annotate quiver contour barh stackplot subplots_adjust axhline axvline semilogx semilogy loglog polar streamplot hexbin pcolor tricontour errorbar clabel set_aspect violinplot set_axis_off spines text hatch plt axis plt.bar() plt.axis import figure pyplot highlight_text pypalettes plt.subplots() xlabel ylabel title legend colorbar savefig tight_layout grid set_xlim set_ylim plot scatter hist boxplot imshow cmap alpha bins tick_params annotate quiver contour barh stackplot subplots_adjust axhline axvline semilogx semilogy loglog polar streamplot hexbin pcolor tricontour errorbar clabel set_aspect violinplot set_axis_off spines text hatch plt axis plt.bar() plt.axis import figure pyplot highlight_text pypalettes plt.subplots() xlabel ylabel title legend colorbar savefig tight_layout grid set_xlim set_ylim plot scatter hist boxplot imshow cmap alpha bins tick_params annotate quiver contour barh stackplot subplots_adjust axhline axvline semilogx semilogy loglog polar streamplot hexbin pcolor tricontour errorbar clabel set_aspect violinplot set_axis_off spines text hatch plt axis plt.bar() plt.axis import figure pyplot highlight_text pypalettes plt.subplots() xlabel ylabel title legend colorbar savefig tight_layout grid set_xlim set_ylim plot scatter hist boxplot imshow cmap alpha bins tick_params annotate quiver contour barh stackplot subplots_adjust axhline axvline semilogx semilogy loglog polar streamplot hexbin pcolor tricontour errorbar clabel set_aspect violinplot set_axis_off spines text hatch plt axis plt.bar() plt.axis import figure pyplot highlight_text pypalettes plt.subplots() xlabel ylabel title legend colorbar savefig tight_layout grid set_xlim set_ylim plot scatter hist boxplot imshow cmap alpha bins tick_params annotate quiver contour barh stackplot subplots_adjust axhline axvline semilogx semilogy loglog polar streamplot hexbin pcolor tricontour errorbar clabel set_aspect violinplot set_axis_off spines text hatch plt axis plt.bar() plt.axis import figure pyplot highlight_text pypalettes plt.subplots() xlabel ylabel title legend colorbar savefig tight_layout grid set_xlim set_ylim plot scatter hist boxplot imshow cmap alpha bins tick_params annotate quiver contour barh stackplot subplots_adjust axhline axvline semilogx semilogy loglog polar streamplot hexbin pcolor tricontour errorbar clabel set_aspect violinplot set_axis_off spines text hatch plt axis plt.bar() plt.axis import figure pyplot highlight_text pypalettes plt.subplots() xlabel ylabel title legend colorbar savefig tight_layout grid set_xlim set_ylim plot scatter hist boxplot imshow cmap alpha bins tick_params annotate quiver contour barh stackplot subplots_adjust axhline axvline semilogx semilogy loglog polar streamplot hexbin pcolor tricontour errorbar clabel set_aspect violinplot set_axis_off spines text hatch plt axis plt.bar() plt.axis import figure pyplot highlight_text pypalettes plt.subplots() xlabel ylabel title legend colorbar savefig tight_layout grid set_xlim set_ylim plot scatter hist boxplot imshow cmap alpha bins tick_params annotate quiver contour barh stackplot subplots_adjust axhline axvline semilogx semilogy loglog polar streamplot hexbin pcolor tricontour errorbar clabel set_aspect violinplot set_axis_off spines text hatch plt axis plt.bar() plt.axis import figure pyplot highlight_text pypalettes plt.subplots() xlabel ylabel title legend colorbar savefig tight_layout grid set_xlim set_ylim plot scatter hist boxplot imshow cmap alpha bins tick_params annotate quiver contour barh stackplot subplots_adjust axhline axvline semilogx semilogy loglog polar streamplot hexbin pcolor tricontour errorbar clabel set_aspect violinplot set_axis_off spines text hatch plt axis plt.bar() plt.axis import figure pyplot highlight_text pypalettes plt.subplots() xlabel ylabel title legend colorbar savefig tight_layout grid set_xlim set_ylim plot scatter hist boxplot imshow cmap alpha bins tick_params annotate quiver contour barh stackplot subplots_adjust axhline axvline semilogx semilogy loglog polar streamplot hexbin pcolor tricontour errorbar clabel set_aspect violinplot set_axis_off spines text hatch plt axis plt.bar() plt.axis import figure pyplot highlight_text pypalettes plt.subplots() xlabel ylabel title legend colorbar savefig tight_layout grid set_xlim set_ylim plot scatter hist boxplot imshow cmap alpha bins tick_params annotate quiver contour barh stackplot subplots_adjust axhline axvline semilogx semilogy loglog polar streamplot hexbin pcolor tricontour errorbar clabel set_aspect violinplot set_axis_off spines text hatch plt axis plt.bar() plt.axis import figure pyplot highlight_text pypalettes plt.subplots() xlabel ylabel title legend colorbar savefig tight_layout grid set_xlim set_ylim plot scatter hist boxplot imshow cmap alpha bins tick_params annotate quiver contour barh stackplot subplots_adjust axhline axvline semilogx semilogy loglog polar streamplot hexbin pcolor tricontour errorbar clabel set_aspect violinplot set_axis_off spines text hatch plt axis plt.bar() plt.axis import figure pyplot highlight_text pypalettes plt.subplots() xlabel ylabel title legend colorbar savefig tight_layout grid set_xlim set_ylim plot scatter hist boxplot imshow cmap alpha bins tick_params annotate quiver contour barh stackplot subplots_adjust axhline axvline semilogx semilogy loglog polar streamplot hexbin pcolor tricontour errorbar clabel set_aspect violinplot set_axis_off spines text hatch plt axis plt.bar() plt.axis import figure pyplot highlight_text pypalettes plt.subplots() xlabel ylabel title legend colorbar savefig tight_layout grid set_xlim set_ylim plot scatter hist boxplot imshow cmap alpha bins tick_params annotate quiver contour barh stackplot subplots_adjust axhline axvline semilogx semilogy loglog polar streamplot hexbin pcolor tricontour errorbar clabel set_aspect violinplot set_axis_off spines text hatch plt axis plt.bar() plt.axis import figure pyplot highlight_text pypalettes plt.subplots() xlabel ylabel title legend colorbar savefig tight_layout grid set_xlim set_ylim plot scatter hist boxplot imshow cmap alpha bins tick_params annotate quiver contour barh stackplot subplots_adjust axhline axvline semilogx semilogy loglog polar streamplot hexbin pcolor tricontour errorbar clabel set_aspect violinplot set_axis_off spines text hatch plt axis plt.bar() plt.axis import figure pyplot highlight_text pypalettes plt.subplots() xlabel ylabel title legend colorbar savefig tight_layout grid set_xlim set_ylim plot scatter hist boxplot imshow cmap alpha bins tick_params annotate quiver contour barh stackplot subplots_adjust axhline axvline semilogx semilogy loglog polar streamplot hexbin pcolor tricontour errorbar clabel set_aspect violinplot set_axis_off spines text hatch plt axis plt.bar() plt.axis import figure pyplot highlight_text pypalettes plt.subplots() xlabel ylabel title legend colorbar savefig tight_layout grid set_xlim set_ylim plot scatter hist boxplot imshow cmap alpha bins tick_params annotate quiver contour barh stackplot subplots_adjust axhline axvline semilogx semilogy loglog polar streamplot hexbin pcolor tricontour errorbar clabel set_aspect violinplot set_axis_off spines text hatch plt axis plt.bar() plt.axis import figure pyplot highlight_text pypalettes plt.subplots() xlabel ylabel title legend colorbar savefig tight_layout grid set_xlim set_ylim plot scatter hist boxplot imshow cmap alpha bins tick_params annotate quiver contour barh stackplot subplots_adjust axhline axvline semilogx semilogy loglog polar streamplot hexbin pcolor tricontour errorbar clabel set_aspect violinplot set_axis_off spines text hatch plt axis plt.bar() plt.axis import figure pyplot highlight_text pypalettes plt.subplots() xlabel ylabel title legend colorbar savefig tight_layout grid set_xlim set_ylim plot scatter hist boxplot imshow cmap alpha bins tick_params annotate quiver contour barh stackplot subplots_adjust axhline axvline semilogx semilogy loglog polar streamplot hexbin pcolor tricontour errorbar clabel set_aspect violinplot set_axis_off spines text hatch plt axis plt.bar() plt.axis import figure pyplot highlight_text pypalettes plt.subplots() xlabel ylabel title legend colorbar savefig tight_layout grid set_xlim set_ylim plot scatter hist boxplot imshow cmap alpha bins tick_params annotate quiver contour barh stackplot subplots_adjust axhline axvline semilogx semilogy loglog polar streamplot hexbin pcolor tricontour errorbar clabel set_aspect violinplot set_axis_off spines text hatch plt axis plt.bar() plt.axis import figure pyplot highlight_text pypalettes plt.subplots() xlabel ylabel title legend colorbar savefig tight_layout grid set_xlim set_ylim plot scatter hist boxplot imshow cmap alpha bins tick_params annotate quiver contour barh stackplot subplots_adjust axhline axvline semilogx semilogy loglog polar streamplot hexbin pcolor tricontour errorbar clabel set_aspect violinplot set_axis_off spines text hatch plt axis plt.bar() plt.axis import figure pyplot highlight_text pypalettes plt.subplots() xlabel ylabel title legend colorbar savefig tight_layout grid set_xlim set_ylim plot scatter hist boxplot imshow cmap alpha bins tick_params annotate quiver contour barh stackplot subplots_adjust axhline axvline semilogx semilogy loglog polar streamplot hexbin pcolor tricontour errorbar clabel set_aspect violinplot set_axis_off spines text hatch plt axis plt.bar() plt.axis import figure pyplot highlight_text pypalettes plt.subplots() xlabel ylabel title legend colorbar savefig tight_layout grid set_xlim set_ylim plot scatter hist boxplot imshow cmap alpha bins tick_params annotate quiver contour barh stackplot subplots_adjust axhline axvline semilogx semilogy loglog polar streamplot hexbin pcolor tricontour errorbar clabel set_aspect violinplot set_axis_off spines text hatch plt axis plt.bar() plt.axis import figure pyplot highlight_text pypalettes plt.subplots() xlabel ylabel title legend colorbar savefig tight_layout grid set_xlim set_ylim plot scatter hist boxplot imshow cmap alpha bins tick_params annotate quiver contour barh stackplot subplots_adjust axhline axvline semilogx semilogy loglog polar streamplot hexbin pcolor tricontour errorbar clabel set_aspect violinplot set_axis_off spines text hatch plt axis plt.bar() plt.axis import figure pyplot highlight_text pypalettes plt.subplots() xlabel ylabel title legend colorbar savefig tight_layout grid set_xlim set_ylim plot scatter hist boxplot imshow cmap alpha bins tick_params annotate quiver contour barh stackplot subplots_adjust axhline axvline semilogx semilogy loglog polar streamplot hexbin pcolor tricontour errorbar clabel set_aspect violinplot set_axis_off spines text hatch plt axis plt.bar() plt.axis import figure pyplot highlight_text pypalettes plt.subplots() xlabel ylabel title legend colorbar savefig tight_layout grid set_xlim set_ylim plot scatter hist boxplot imshow cmap alpha bins tick_params annotate quiver contour barh stackplot subplots_adjust axhline axvline semilogx semilogy loglog polar streamplot hexbin pcolor tricontour errorbar clabel set_aspect violinplot set_axis_off spines text hatch plt axis plt.bar() plt.axis import figure pyplot highlight_text pypalettes plt.subplots() xlabel ylabel title legend colorbar savefig tight_layout grid set_xlim set_ylim plot scatter hist boxplot imshow cmap alpha bins tick_params annotate quiver contour barh stackplot subplots_adjust axhline axvline semilogx semilogy loglog polar streamplot hexbin pcolor tricontour errorbar clabel set_aspect violinplot set_axis_off spines text hatch plt axis plt.bar() plt.axis import figure pyplot highlight_text pypalettes plt.subplots() xlabel ylabel title legend colorbar savefig tight_layout grid set_xlim set_ylim plot scatter hist boxplot imshow cmap alpha bins tick_params annotate quiver contour barh stackplot subplots_adjust axhline axvline semilogx semilogy loglog polar streamplot hexbin pcolor tricontour errorbar clabel set_aspect violinplot set_axis_off spines text hatch plt axis plt.bar() plt.axis import figure pyplot highlight_text pypalettes plt.subplots() xlabel ylabel title legend colorbar savefig tight_layout grid set_xlim set_ylim plot scatter hist boxplot imshow cmap alpha bins tick_params annotate quiver contour barh stackplot subplots_adjust axhline axvline semilogx semilogy loglog polar streamplot hexbin pcolor tricontour errorbar clabel set_aspect violinplot set_axis_off spines text hatch plt axis plt.bar() plt.axis import figure pyplot highlight_text pypalettes plt.subplots() xlabel ylabel title legend colorbar savefig tight_layout grid set_xlim set_ylim plot scatter hist boxplot imshow cmap alpha bins tick_params annotate quiver contour barh stackplot subplots_adjust axhline axvline semilogx semilogy loglog polar streamplot hexbin pcolor tricontour errorbar clabel set_aspect violinplot set_axis_off spines text hatch plt axis plt.bar() plt.axis import figure pyplot highlight_text pypalettes plt.subplots() xlabel ylabel title legend colorbar savefig tight_layout grid set_xlim set_ylim plot scatter hist boxplot imshow cmap alpha bins tick_params annotate quiver contour barh stackplot subplots_adjust axhline axvline semilogx semilogy loglog polar streamplot hexbin pcolor tricontour errorbar clabel set_aspect violinplot set_axis_off spines text hatch plt axis plt.bar() plt.axis import figure pyplot highlight_text pypalettes plt.subplots() xlabel ylabel title legend colorbar savefig tight_layout grid set_xlim set_ylim plot scatter hist boxplot imshow cmap alpha bins tick_params annotate quiver contour barh stackplot subplots_adjust axhline axvline semilogx semilogy loglog polar streamplot hexbin pcolor tricontour errorbar clabel set_aspect violinplot set_axis_off spines text hatch plt axis plt.bar() plt.axis import figure pyplot highlight_text pypalettes plt.subplots() xlabel ylabel title legend colorbar savefig tight_layout grid set_xlim set_ylim plot scatter hist boxplot imshow cmap alpha bins tick_params annotate quiver contour barh stackplot subplots_adjust axhline axvline semilogx semilogy loglog polar streamplot hexbin pcolor tricontour errorbar clabel set_aspect violinplot set_axis_off spines text hatch plt axis plt.bar() plt.axis import figure pyplot highlight_text pypalettes plt.subplots() xlabel ylabel title legend colorbar savefig tight_layout grid set_xlim set_ylim plot scatter hist boxplot imshow cmap alpha bins tick_params annotate quiver contour barh stackplot subplots_adjust axhline axvline semilogx semilogy loglog polar streamplot hexbin pcolor tricontour errorbar clabel set_aspect violinplot set_axis_off spines text hatch plt axis plt.bar() plt.axis import figure pyplot highlight_text pypalettes plt.subplots() xlabel ylabel title legend colorbar savefig tight_layout grid set_xlim set_ylim plot scatter hist boxplot imshow cmap alpha bins tick_params annotate quiver contour barh stackplot subplots_adjust axhline axvline semilogx semilogy loglog polar streamplot hexbin pcolor tricontour errorbar clabel set_aspect violinplot set_axis_off spines text hatch plt axis plt.bar() plt.axis import figure pyplot highlight_text pypalettes plt.subplots() xlabel ylabel title legend colorbar savefig tight_layout grid set_xlim set_ylim plot scatter hist boxplot imshow cmap alpha bins tick_params annotate quiver contour barh stackplot subplots_adjust axhline axvline semilogx semilogy loglog polar streamplot hexbin pcolor tricontour errorbar clabel set_aspect violinplot set_axis_off spines text hatch plt axis plt.bar() plt.axis import figure pyplot highlight_text pypalettes plt.subplots() xlabel ylabel title legend colorbar savefig tight_layout grid set_xlim set_ylim plot scatter hist boxplot imshow cmap alpha bins tick_params annotate quiver contour barh stackplot subplots_adjust axhline axvline semilogx semilogy loglog polar streamplot hexbin pcolor tricontour errorbar clabel set_aspect violinplot set_axis_off spines text hatch plt axis plt.bar() plt.axis import figure pyplot highlight_text pypalettes plt.subplots() xlabel ylabel title legend colorbar savefig tight_layout grid set_xlim set_ylim plot scatter hist boxplot imshow cmap alpha bins tick_params annotate quiver contour barh stackplot subplots_adjust axhline axvline semilogx semilogy loglog polar streamplot hexbin pcolor tricontour errorbar clabel set_aspect violinplot set_axis_off spines text hatch plt axis plt.bar() plt.axis import figure pyplot highlight_text pypalettes plt.subplots() xlabel ylabel title legend colorbar savefig tight_layout grid set_xlim set_ylim plot scatter hist boxplot imshow cmap alpha bins tick_params annotate quiver contour barh stackplot subplots_adjust axhline axvline semilogx semilogy loglog polar streamplot hexbin pcolor tricontour errorbar clabel set_aspect violinplot set_axis_off spines text hatch plt axis plt.bar() plt.axis import figure pyplot highlight_text pypalettes plt.subplots() xlabel ylabel title legend colorbar savefig tight_layout grid set_xlim set_ylim plot scatter hist boxplot imshow cmap alpha bins tick_params annotate quiver contour barh stackplot subplots_adjust axhline axvline semilogx semilogy loglog polar streamplot hexbin pcolor tricontour errorbar clabel set_aspect violinplot set_axis_off spines text hatch plt axis plt.bar() plt.axis import figure pyplot highlight_text pypalettes plt.subplots() xlabel ylabel title legend colorbar savefig tight_layout grid set_xlim set_ylim plot scatter hist boxplot imshow cmap alpha bins tick_params annotate quiver contour barh stackplot subplots_adjust axhline axvline semilogx semilogy loglog polar streamplot hexbin pcolor tricontour errorbar clabel set_aspect violinplot set_axis_off spines text hatch plt axis plt.bar() plt.axis import figure pyplot highlight_text pypalettes plt.subplots() xlabel ylabel title legend colorbar savefig tight_layout grid set_xlim set_ylim plot scatter hist boxplot imshow cmap alpha bins tick_params annotate quiver contour barh stackplot subplots_adjust axhline axvline semilogx semilogy loglog polar streamplot hexbin pcolor tricontour errorbar clabel set_aspect violinplot set_axis_off spines text hatch plt axis plt.bar() plt.axis import figure pyplot highlight_text pypalettes plt.subplots() xlabel ylabel title legend colorbar savefig tight_layout grid set_xlim set_ylim plot scatter hist boxplot imshow cmap alpha bins tick_params annotate quiver contour barh stackplot subplots_adjust axhline axvline semilogx semilogy loglog polar streamplot hexbin pcolor tricontour errorbar clabel set_aspect violinplot set_axis_off spines text hatch plt axis plt.bar() plt.axis import figure pyplot highlight_text pypalettes plt.subplots() xlabel ylabel title legend colorbar savefig tight_layout grid set_xlim set_ylim plot scatter hist boxplot imshow cmap alpha bins tick_params annotate quiver contour barh stackplot subplots_adjust axhline axvline semilogx semilogy loglog polar streamplot hexbin pcolor tricontour errorbar clabel set_aspect violinplot set_axis_off spines text hatch plt axis plt.bar() plt.axis import figure pyplot highlight_text pypalettes plt.subplots() xlabel ylabel title legend colorbar savefig tight_layout grid set_xlim set_ylim plot scatter hist boxplot imshow cmap alpha bins tick_params annotate quiver contour barh stackplot subplots_adjust axhline axvline semilogx semilogy loglog polar streamplot hexbin pcolor tricontour errorbar clabel set_aspect violinplot set_axis_off spines text hatch plt axis plt.bar() plt.axis import figure pyplot highlight_text pypalettes plt.subplots() xlabel ylabel title legend colorbar savefig tight_layout grid set_xlim set_ylim plot scatter hist boxplot imshow cmap alpha bins tick_params annotate quiver contour barh stackplot subplots_adjust axhline axvline semilogx semilogy loglog polar streamplot hexbin pcolor tricontour errorbar clabel set_aspect violinplot set_axis_off spines text hatch plt axis plt.bar() plt.axis import figure pyplot highlight_text pypalettes plt.subplots() xlabel ylabel title legend colorbar savefig tight_layout grid set_xlim set_ylim plot scatter hist boxplot imshow cmap alpha bins tick_params annotate quiver contour barh stackplot subplots_adjust axhline axvline semilogx semilogy loglog polar streamplot hexbin pcolor tricontour errorbar clabel set_aspect violinplot set_axis_off spines text hatch plt axis plt.bar() plt.axis import figure pyplot highlight_text pypalettes plt.subplots() xlabel ylabel title legend colorbar savefig tight_layout grid set_xlim set_ylim plot scatter hist boxplot imshow cmap alpha bins tick_params annotate quiver contour barh stackplot subplots_adjust axhline axvline semilogx semilogy loglog polar streamplot hexbin pcolor tricontour errorbar clabel set_aspect violinplot set_axis_off spines text hatch plt axis plt.bar() plt.axis import figure pyplot highlight_text pypalettes plt.subplots() xlabel ylabel title legend colorbar savefig tight_layout grid set_xlim set_ylim plot scatter hist boxplot imshow cmap alpha bins tick_params annotate quiver contour barh stackplot subplots_adjust axhline axvline semilogx semilogy loglog polar streamplot hexbin pcolor tricontour errorbar clabel set_aspect violinplot set_axis_off spines text hatch plt axis plt.bar() plt.axis import figure pyplot highlight_text pypalettes plt.subplots() xlabel ylabel title legend colorbar savefig tight_layout grid set_xlim set_ylim plot scatter hist boxplot imshow cmap alpha bins tick_params annotate quiver contour barh stackplot subplots_adjust axhline axvline semilogx semilogy loglog polar streamplot hexbin pcolor tricontour errorbar clabel set_aspect violinplot set_axis_off spines text hatch plt axis plt.bar() plt.axis import figure pyplot highlight_text pypalettes plt.subplots() xlabel ylabel title legend colorbar savefig tight_layout grid set_xlim set_ylim plot scatter hist boxplot imshow cmap alpha bins tick_params annotate quiver contour barh stackplot subplots_adjust axhline axvline semilogx semilogy loglog polar streamplot hexbin pcolor tricontour errorbar clabel set_aspect violinplot set_axis_off spines text hatch plt axis plt.bar() plt.axis import figure pyplot highlight_text pypalettes plt.subplots() xlabel ylabel title legend colorbar savefig tight_layout grid set_xlim set_ylim plot scatter hist boxplot imshow cmap alpha bins tick_params annotate quiver contour barh stackplot subplots_adjust axhline axvline semilogx semilogy loglog polar streamplot hexbin pcolor tricontour errorbar clabel set_aspect violinplot set_axis_off spines text hatch plt axis plt.bar() plt.axis import figure pyplot highlight_text pypalettes plt.subplots() xlabel ylabel title legend colorbar savefig tight_layout grid set_xlim set_ylim plot scatter hist boxplot imshow cmap alpha bins tick_params annotate quiver contour barh stackplot subplots_adjust axhline axvline semilogx semilogy loglog polar streamplot hexbin pcolor tricontour errorbar clabel set_aspect violinplot set_axis_off spines text hatch plt axis plt.bar() plt.axis import figure pyplot highlight_text pypalettes plt.subplots() xlabel ylabel title legend colorbar savefig tight_layout grid set_xlim set_ylim plot scatter hist boxplot imshow cmap alpha bins tick_params annotate quiver contour barh stackplot subplots_adjust axhline axvline semilogx semilogy loglog polar streamplot hexbin pcolor tricontour errorbar clabel set_aspect violinplot set_axis_off spines text hatch plt axis plt.bar() plt.axis import figure pyplot highlight_text pypalettes plt.subplots() xlabel ylabel title legend colorbar savefig tight_layout grid set_xlim set_ylim plot scatter hist boxplot imshow cmap alpha bins tick_params annotate quiver contour barh stackplot subplots_adjust axhline axvline semilogx semilogy loglog polar streamplot hexbin pcolor tricontour errorbar clabel set_aspect violinplot set_axis_off spines text hatch plt axis plt.bar() plt.axis import figure pyplot highlight_text pypalettes plt.subplots() xlabel ylabel title legend colorbar savefig tight_layout grid set_xlim set_ylim plot scatter hist boxplot imshow cmap alpha bins tick_params annotate quiver contour barh stackplot subplots_adjust axhline axvline semilogx semilogy loglog polar streamplot hexbin pcolor tricontour errorbar clabel set_aspect violinplot set_axis_off spines text hatch plt axis plt.bar() plt.axis import figure pyplot highlight_text pypalettes plt.subplots() xlabel ylabel title legend colorbar savefig tight_layout grid set_xlim set_ylim plot scatter hist boxplot imshow cmap alpha bins tick_params annotate quiver contour barh stackplot subplots_adjust axhline axvline semilogx semilogy loglog polar streamplot hexbin pcolor tricontour errorbar clabel set_aspect violinplot set_axis_off spines text hatch plt axis plt.bar() plt.axis import figure pyplot highlight_text pypalettes plt.subplots() xlabel ylabel title legend colorbar savefig tight_layout grid set_xlim set_ylim plot scatter hist boxplot imshow cmap alpha bins tick_params annotate quiver contour barh stackplot subplots_adjust axhline axvline semilogx semilogy loglog polar streamplot hexbin pcolor tricontour errorbar clabel set_aspect violinplot set_axis_off spines text hatch plt axis plt.bar() plt.axis import figure pyplot highlight_text pypalettes plt.subplots() xlabel ylabel title legend colorbar savefig tight_layout grid set_xlim set_ylim plot scatter hist boxplot imshow cmap alpha bins tick_params annotate quiver contour barh stackplot subplots_adjust axhline axvline semilogx semilogy loglog polar streamplot hexbin pcolor tricontour errorbar clabel set_aspect violinplot set_axis_off spines text hatch plt axis plt.bar() plt.axis import figure pyplot highlight_text pypalettes plt.subplots() xlabel ylabel title legend colorbar savefig tight_layout grid set_xlim set_ylim plot scatter hist boxplot imshow cmap alpha bins tick_params annotate quiver contour barh stackplot subplots_adjust axhline axvline semilogx semilogy loglog polar streamplot hexbin pcolor tricontour errorbar clabel set_aspect violinplot set_axis_off spines text hatch plt axis plt.bar() plt.axis import figure pyplot highlight_text pypalettes plt.subplots() xlabel ylabel title legend colorbar savefig tight_layout grid set_xlim set_ylim plot scatter hist boxplot imshow cmap alpha bins tick_params annotate quiver contour barh stackplot subplots_adjust axhline axvline semilogx semilogy loglog polar streamplot hexbin pcolor tricontour errorbar clabel set_aspect violinplot set_axis_off spines text hatch plt axis plt.bar() plt.axis import figure pyplot highlight_text pypalettes plt.subplots() xlabel ylabel title legend colorbar savefig tight_layout grid set_xlim set_ylim plot scatter hist boxplot imshow cmap alpha bins tick_params annotate quiver contour barh stackplot subplots_adjust axhline axvline semilogx semilogy loglog polar streamplot hexbin pcolor tricontour errorbar clabel set_aspect violinplot set_axis_off spines text hatch plt axis plt.bar() plt.axis import figure pyplot highlight_text pypalettes plt.subplots() xlabel ylabel title legend colorbar savefig tight_layout grid set_xlim set_ylim plot scatter hist boxplot imshow cmap alpha bins tick_params annotate quiver contour barh stackplot subplots_adjust axhline axvline semilogx semilogy loglog polar streamplot hexbin pcolor tricontour errorbar clabel set_aspect violinplot set_axis_off spines text hatch plt axis plt.bar() plt.axis import figure pyplot highlight_text pypalettes plt.subplots() xlabel ylabel title legend colorbar savefig tight_layout grid set_xlim set_ylim plot scatter hist boxplot imshow cmap alpha bins tick_params annotate quiver contour barh stackplot subplots_adjust axhline axvline semilogx semilogy loglog polar streamplot hexbin pcolor tricontour errorbar clabel set_aspect violinplot set_axis_off spines text hatch plt axis plt.bar() plt.axis import figure pyplot highlight_text pypalettes plt.subplots() xlabel ylabel title legend colorbar savefig tight_layout grid set_xlim set_ylim plot scatter hist boxplot imshow cmap alpha bins tick_params annotate quiver contour barh stackplot subplots_adjust axhline axvline semilogx semilogy loglog polar streamplot hexbin pcolor tricontour errorbar clabel set_aspect violinplot set_axis_off spines text hatch plt axis plt.bar() plt.axis import figure pyplot highlight_text pypalettes plt.subplots() xlabel ylabel title legend colorbar savefig tight_layout grid set_xlim set_ylim plot scatter hist boxplot imshow cmap alpha bins tick_params annotate quiver contour barh stackplot subplots_adjust axhline axvline semilogx semilogy loglog polar streamplot hexbin pcolor tricontour errorbar clabel set_aspect violinplot set_axis_off spines text hatch plt axis plt.bar() plt.axis import figure pyplot highlight_text pypalettes plt.subplots() xlabel ylabel title legend colorbar savefig tight_layout grid set_xlim set_ylim plot scatter hist boxplot imshow cmap alpha bins tick_params annotate quiver contour barh stackplot subplots_adjust axhline axvline semilogx semilogy loglog polar streamplot hexbin pcolor tricontour errorbar clabel set_aspect violinplot set_axis_off spines text hatch plt axis plt.bar() plt.axis import figure pyplot highlight_text pypalettes plt.subplots() xlabel ylabel title legend colorbar savefig tight_layout grid set_xlim set_ylim plot scatter hist boxplot imshow cmap alpha bins tick_params annotate quiver contour barh stackplot subplots_adjust axhline axvline semilogx semilogy loglog polar streamplot hexbin pcolor tricontour errorbar clabel set_aspect violinplot set_axis_off spines text hatch plt axis plt.bar() plt.axis import figure pyplot highlight_text pypalettes plt.subplots() xlabel ylabel title legend colorbar savefig tight_layout grid set_xlim set_ylim plot scatter hist boxplot imshow cmap alpha bins tick_params annotate quiver contour barh stackplot subplots_adjust axhline axvline semilogx semilogy loglog polar streamplot hexbin pcolor tricontour errorbar clabel set_aspect violinplot set_axis_off spines text hatch plt axis plt.bar() plt.axis import figure pyplot highlight_text pypalettes plt.subplots() xlabel ylabel title legend colorbar savefig tight_layout grid set_xlim set_ylim plot scatter hist boxplot imshow cmap alpha bins tick_params annotate quiver contour barh stackplot subplots_adjust axhline axvline semilogx semilogy loglog polar streamplot hexbin pcolor tricontour errorbar clabel set_aspect violinplot set_axis_off spines text hatch plt axis plt.bar() plt.axis import figure pyplot highlight_text pypalettes plt.subplots() xlabel ylabel title legend colorbar savefig tight_layout grid set_xlim set_ylim plot scatter hist boxplot imshow cmap alpha bins tick_params annotate quiver contour barh stackplot subplots_adjust axhline axvline semilogx semilogy loglog polar streamplot hexbin pcolor tricontour errorbar clabel set_aspect violinplot set_axis_off spines text hatch plt axis plt.bar() plt.axis import figure pyplot highlight_text pypalettes plt.subplots() xlabel ylabel title legend colorbar savefig tight_layout grid set_xlim set_ylim plot scatter hist boxplot imshow cmap alpha bins tick_params annotate quiver contour barh stackplot subplots_adjust axhline axvline semilogx semilogy loglog polar streamplot hexbin pcolor tricontour errorbar clabel set_aspect violinplot set_axis_off spines text hatch plt axis plt.bar() plt.axis import figure pyplot highlight_text pypalettes plt.subplots() xlabel ylabel title legend colorbar savefig tight_layout grid set_xlim set_ylim plot scatter hist boxplot imshow cmap alpha bins tick_params annotate quiver contour barh stackplot subplots_adjust axhline axvline semilogx semilogy loglog polar streamplot hexbin pcolor tricontour errorbar clabel set_aspect violinplot set_axis_off spines text hatch plt axis plt.bar() plt.axis import figure pyplot highlight_text pypalettes plt.subplots() xlabel ylabel title legend colorbar savefig tight_layout grid set_xlim set_ylim plot scatter hist boxplot imshow cmap alpha bins tick_params annotate quiver contour barh stackplot subplots_adjust axhline axvline semilogx semilogy loglog polar streamplot hexbin pcolor tricontour errorbar clabel set_aspect violinplot set_axis_off spines text hatch plt axis plt.bar() plt.axis import figure pyplot highlight_text pypalettes plt.subplots() xlabel ylabel title legend colorbar savefig tight_layout grid set_xlim set_ylim plot scatter hist boxplot imshow cmap alpha bins tick_params annotate quiver contour barh stackplot subplots_adjust axhline axvline semilogx semilogy loglog polar streamplot hexbin pcolor tricontour errorbar clabel set_aspect violinplot set_axis_off spines text hatch plt axis plt.bar() plt.axis import figure pyplot highlight_text pypalettes plt.subplots() xlabel ylabel title legend colorbar savefig tight_layout grid set_xlim set_ylim plot scatter hist boxplot imshow cmap alpha bins tick_params annotate quiver contour barh stackplot subplots_adjust axhline axvline semilogx semilogy loglog polar streamplot hexbin pcolor tricontour errorbar clabel set_aspect violinplot set_axis_off spines text hatch plt axis plt.bar() plt.axis import figure pyplot highlight_text pypalettes plt.subplots() xlabel ylabel title legend colorbar savefig tight_layout grid set_xlim set_ylim plot scatter hist boxplot imshow cmap alpha bins tick_params annotate quiver contour barh stackplot subplots_adjust axhline axvline semilogx semilogy loglog polar streamplot hexbin pcolor tricontour errorbar clabel set_aspect violinplot set_axis_off spines text hatch plt axis plt.bar() plt.axis import figure pyplot highlight_text pypalettes plt.subplots() xlabel ylabel title legend colorbar savefig tight_layout grid set_xlim set_ylim plot scatter hist boxplot imshow cmap alpha bins tick_params annotate quiver contour barh stackplot subplots_adjust axhline axvline semilogx semilogy loglog polar streamplot hexbin pcolor tricontour errorbar clabel set_aspect violinplot set_axis_off spines text hatch plt axis plt.bar() plt.axis import figure pyplot highlight_text pypalettes plt.subplots() xlabel ylabel title legend colorbar savefig tight_layout grid set_xlim set_ylim plot scatter hist boxplot imshow cmap alpha bins tick_params annotate quiver contour barh stackplot subplots_adjust axhline axvline semilogx semilogy loglog polar streamplot hexbin pcolor tricontour errorbar clabel set_aspect violinplot set_axis_off spines text hatch plt axis plt.bar() plt.axis import figure pyplot highlight_text pypalettes plt.subplots() xlabel ylabel title legend colorbar savefig tight_layout grid set_xlim set_ylim plot scatter hist boxplot imshow cmap alpha bins tick_params annotate quiver contour barh stackplot subplots_adjust axhline axvline semilogx semilogy loglog polar streamplot hexbin pcolor tricontour errorbar clabel set_aspect violinplot set_axis_off spines text hatch plt axis plt.bar() plt.axis import figure pyplot highlight_text pypalettes plt.subplots() xlabel ylabel title legend colorbar savefig tight_layout grid set_xlim set_ylim plot scatter hist boxplot imshow cmap alpha bins tick_params annotate quiver contour barh stackplot subplots_adjust axhline axvline semilogx semilogy loglog polar streamplot hexbin pcolor tricontour errorbar clabel set_aspect violinplot set_axis_off spines text hatch plt axis plt.bar() plt.axis import figure pyplot highlight_text pypalettes plt.subplots() xlabel ylabel title legend colorbar savefig tight_layout grid set_xlim set_ylim plot scatter hist boxplot imshow cmap alpha bins tick_params annotate quiver contour barh stackplot subplots_adjust axhline axvline semilogx semilogy loglog polar streamplot hexbin pcolor tricontour errorbar clabel set_aspect violinplot set_axis_off spines text hatch plt axis plt.bar() plt.axis import figure pyplot highlight_text pypalettes plt.subplots() xlabel ylabel title legend colorbar savefig tight_layout grid set_xlim set_ylim plot scatter hist boxplot imshow cmap alpha bins tick_params annotate quiver contour barh stackplot subplots_adjust axhline axvline semilogx semilogy loglog polar streamplot hexbin pcolor tricontour errorbar clabel set_aspect violinplot set_axis_off spines text hatch plt axis plt.bar() plt.axis import figure pyplot highlight_text pypalettes plt.subplots() xlabel ylabel title legend colorbar savefig tight_layout grid set_xlim set_ylim plot scatter hist boxplot imshow cmap alpha bins tick_params annotate quiver contour barh stackplot subplots_adjust axhline axvline semilogx semilogy loglog polar streamplot hexbin pcolor tricontour errorbar clabel set_aspect violinplot set_axis_off spines text hatch plt axis plt.bar() plt.axis import figure pyplot highlight_text pypalettes plt.subplots() xlabel ylabel title legend colorbar savefig tight_layout grid set_xlim set_ylim plot scatter hist boxplot imshow cmap alpha bins tick_params annotate quiver contour barh stackplot subplots_adjust axhline axvline semilogx semilogy loglog polar streamplot hexbin pcolor tricontour errorbar clabel set_aspect violinplot set_axis_off spines text hatch plt axis plt.bar() plt.axis import figure pyplot highlight_text pypalettes plt.subplots() xlabel ylabel title legend colorbar savefig tight_layout grid set_xlim set_ylim plot scatter hist boxplot imshow cmap alpha bins tick_params annotate quiver contour barh stackplot subplots_adjust axhline axvline semilogx semilogy loglog polar streamplot hexbin pcolor tricontour errorbar clabel set_aspect violinplot set_axis_off spines text hatch plt axis plt.bar() plt.axis import figure pyplot highlight_text pypalettes plt.subplots() xlabel ylabel title legend colorbar savefig tight_layout grid set_xlim set_ylim plot scatter hist boxplot imshow cmap alpha bins tick_params annotate quiver contour barh stackplot subplots_adjust axhline axvline semilogx semilogy loglog polar streamplot hexbin pcolor tricontour errorbar clabel set_aspect violinplot set_axis_off spines text hatch plt axis plt.bar() plt.axis import figure pyplot highlight_text pypalettes plt.subplots() xlabel ylabel title legend colorbar savefig tight_layout grid set_xlim set_ylim plot scatter hist boxplot imshow cmap alpha bins tick_params annotate quiver contour barh stackplot subplots_adjust axhline axvline semilogx semilogy loglog polar streamplot hexbin pcolor tricontour errorbar clabel set_aspect violinplot set_axis_off spines text hatch plt axis plt.bar() plt.axis import figure pyplot highlight_text pypalettes plt.subplots() xlabel ylabel title legend colorbar savefig tight_layout grid set_xlim set_ylim plot scatter hist boxplot imshow cmap alpha bins tick_params annotate quiver contour barh stackplot subplots_adjust axhline axvline semilogx semilogy loglog polar streamplot hexbin pcolor tricontour errorbar clabel set_aspect violinplot set_axis_off spines text hatch plt axis plt.bar() plt.axis import figure pyplot highlight_text pypalettes plt.subplots() xlabel ylabel title legend colorbar savefig tight_layout grid set_xlim set_ylim plot scatter hist boxplot imshow cmap alpha bins tick_params annotate quiver contour barh stackplot subplots_adjust axhline axvline semilogx semilogy loglog polar streamplot hexbin pcolor tricontour errorbar clabel set_aspect violinplot set_axis_off spines text hatch plt axis plt.bar() plt.axis import figure pyplot highlight_text pypalettes plt.subplots() xlabel ylabel title legend colorbar savefig tight_layout grid set_xlim set_ylim plot scatter hist boxplot imshow cmap alpha bins tick_params annotate quiver contour barh stackplot subplots_adjust axhline axvline semilogx semilogy loglog polar streamplot hexbin pcolor tricontour errorbar clabel set_aspect violinplot set_axis_off spines text hatch plt axis plt.bar() plt.axis import figure pyplot highlight_text pypalettes plt.subplots() xlabel ylabel title legend colorbar savefig tight_layout grid set_xlim set_ylim plot scatter hist boxplot imshow cmap alpha bins tick_params annotate quiver contour barh stackplot subplots_adjust axhline axvline semilogx semilogy loglog polar streamplot hexbin pcolor tricontour errorbar clabel set_aspect violinplot set_axis_off spines text hatch plt axis plt.bar() plt.axis import figure pyplot highlight_text pypalettes plt.subplots() xlabel ylabel title legend colorbar savefig tight_layout grid set_xlim set_ylim plot scatter hist boxplot imshow cmap alpha bins tick_params annotate quiver contour barh stackplot subplots_adjust axhline axvline semilogx semilogy loglog polar streamplot hexbin pcolor tricontour errorbar clabel set_aspect violinplot set_axis_off spines text hatch plt axis plt.bar() plt.axis import figure pyplot highlight_text pypalettes plt.subplots() xlabel ylabel title legend colorbar savefig tight_layout grid set_xlim set_ylim plot scatter hist boxplot imshow cmap alpha bins tick_params annotate quiver contour barh stackplot subplots_adjust axhline axvline semilogx semilogy loglog polar streamplot hexbin pcolor tricontour errorbar clabel set_aspect violinplot set_axis_off spines text hatch plt axis plt.bar() plt.axis import figure pyplot highlight_text pypalettes plt.subplots() xlabel ylabel title legend colorbar savefig tight_layout grid set_xlim set_ylim plot scatter hist boxplot imshow cmap alpha bins tick_params annotate quiver contour barh stackplot subplots_adjust axhline axvline semilogx semilogy loglog polar streamplot hexbin pcolor tricontour errorbar clabel set_aspect violinplot set_axis_off spines text hatch plt axis plt.bar() plt.axis import figure pyplot highlight_text pypalettes plt.subplots() xlabel ylabel title legend colorbar savefig tight_layout grid set_xlim set_ylim plot scatter hist boxplot imshow cmap alpha bins tick_params annotate quiver contour barh stackplot subplots_adjust axhline axvline semilogx semilogy loglog polar streamplot hexbin pcolor tricontour errorbar clabel set_aspect violinplot set_axis_off spines text hatch plt axis plt.bar() plt.axis import figure pyplot highlight_text pypalettes plt.subplots() xlabel ylabel title legend colorbar savefig tight_layout grid set_xlim set_ylim plot scatter hist boxplot imshow cmap alpha bins tick_params annotate quiver contour barh stackplot subplots_adjust axhline axvline semilogx semilogy loglog polar streamplot hexbin pcolor tricontour errorbar clabel set_aspect violinplot set_axis_off spines text hatch plt axis plt.bar() plt.axis import figure pyplot highlight_text pypalettes plt.subplots() xlabel ylabel title legend colorbar savefig tight_layout grid set_xlim set_ylim plot scatter hist boxplot imshow cmap alpha bins tick_params annotate quiver contour barh stackplot subplots_adjust axhline axvline semilogx semilogy loglog polar streamplot hexbin pcolor tricontour errorbar clabel set_aspect violinplot set_axis_off spines text hatch plt axis plt.bar() plt.axis import figure pyplot highlight_text pypalettes plt.subplots() xlabel ylabel title legend colorbar savefig tight_layout grid set_xlim set_ylim plot scatter hist boxplot imshow cmap alpha bins tick_params annotate quiver contour barh stackplot subplots_adjust axhline axvline semilogx semilogy loglog polar streamplot hexbin pcolor tricontour errorbar clabel set_aspect violinplot set_axis_off spines text hatch plt axis plt.bar() plt.axis import figure pyplot highlight_text pypalettes plt.subplots() xlabel ylabel title legend colorbar savefig tight_layout grid set_xlim set_ylim plot scatter hist boxplot imshow cmap alpha bins tick_params annotate quiver contour barh stackplot subplots_adjust axhline axvline semilogx semilogy loglog polar streamplot hexbin pcolor tricontour errorbar clabel set_aspect violinplot set_axis_off spines text hatch plt axis plt.bar() plt.axis import figure pyplot highlight_text pypalettes plt.subplots() xlabel ylabel title legend colorbar savefig tight_layout grid set_xlim set_ylim plot scatter hist boxplot imshow cmap alpha bins tick_params annotate quiver contour barh stackplot subplots_adjust axhline axvline semilogx semilogy loglog polar streamplot hexbin pcolor tricontour errorbar clabel set_aspect violinplot set_axis_off spines text hatch plt axis plt.bar() plt.axis import figure pyplot highlight_text pypalettes plt.subplots() xlabel ylabel title legend colorbar savefig tight_layout grid set_xlim set_ylim plot scatter hist boxplot imshow cmap alpha bins tick_params annotate quiver contour barh stackplot subplots_adjust axhline axvline semilogx semilogy loglog polar streamplot hexbin pcolor tricontour errorbar clabel set_aspect violinplot set_axis_off spines text hatch plt axis plt.bar() plt.axis import figure pyplot highlight_text pypalettes plt.subplots() xlabel ylabel title legend colorbar savefig tight_layout grid set_xlim set_ylim plot scatter hist boxplot imshow cmap alpha bins tick_params annotate quiver contour barh stackplot subplots_adjust axhline axvline semilogx semilogy loglog polar streamplot hexbin pcolor tricontour errorbar clabel set_aspect violinplot set_axis_off spines text hatch plt axis plt.bar() plt.axis import figure pyplot highlight_text pypalettes plt.subplots() xlabel ylabel title legend colorbar savefig tight_layout grid set_xlim set_ylim plot scatter hist boxplot imshow cmap alpha bins tick_params annotate quiver contour barh stackplot subplots_adjust axhline axvline semilogx semilogy loglog polar streamplot hexbin pcolor tricontour errorbar clabel set_aspect violinplot set_axis_off spines text hatch plt axis plt.bar() plt.axis import figure pyplot highlight_text pypalettes plt.subplots() xlabel ylabel title legend colorbar savefig tight_layout grid set_xlim set_ylim plot scatter hist boxplot imshow cmap alpha bins tick_params annotate quiver contour barh stackplot subplots_adjust axhline axvline semilogx semilogy loglog polar streamplot hexbin pcolor tricontour errorbar clabel set_aspect violinplot set_axis_off spines text hatch plt axis plt.bar() plt.axis import figure pyplot highlight_text pypalettes plt.subplots() xlabel ylabel title legend colorbar savefig tight_layout grid set_xlim set_ylim plot scatter hist boxplot imshow cmap alpha bins tick_params annotate quiver contour barh stackplot subplots_adjust axhline axvline semilogx semilogy loglog polar streamplot hexbin pcolor tricontour errorbar clabel set_aspect violinplot set_axis_off spines text hatch plt axis plt.bar() plt.axis import figure pyplot highlight_text pypalettes plt.subplots() xlabel ylabel title legend colorbar savefig tight_layout grid set_xlim set_ylim plot scatter hist boxplot imshow cmap alpha bins tick_params annotate quiver contour barh stackplot subplots_adjust axhline axvline semilogx semilogy loglog polar streamplot hexbin pcolor tricontour errorbar clabel set_aspect violinplot set_axis_off spines text hatch plt axis plt.bar() plt.axis import figure pyplot highlight_text pypalettes plt.subplots() xlabel ylabel title legend colorbar savefig tight_layout grid set_xlim set_ylim plot scatter hist boxplot imshow cmap alpha bins tick_params annotate quiver contour barh stackplot subplots_adjust axhline axvline semilogx semilogy loglog polar streamplot hexbin pcolor tricontour errorbar clabel set_aspect violinplot set_axis_off spines text hatch plt axis plt.bar() plt.axis import figure pyplot highlight_text pypalettes plt.subplots() xlabel ylabel title legend colorbar savefig tight_layout grid set_xlim set_ylim plot scatter hist boxplot imshow cmap alpha bins tick_params annotate quiver contour barh stackplot subplots_adjust axhline axvline semilogx semilogy loglog polar streamplot hexbin pcolor tricontour errorbar clabel set_aspect violinplot set_axis_off spines text hatch plt axis plt.bar() plt.axis import figure pyplot highlight_text pypalettes plt.subplots() xlabel ylabel title legend colorbar savefig tight_layout grid set_xlim set_ylim plot scatter hist boxplot imshow cmap alpha bins tick_params annotate quiver contour barh stackplot subplots_adjust axhline axvline semilogx semilogy loglog polar streamplot hexbin pcolor tricontour errorbar clabel set_aspect violinplot set_axis_off spines text hatch plt axis plt.bar() plt.axis import figure pyplot highlight_text pypalettes plt.subplots() xlabel ylabel title legend colorbar savefig tight_layout grid set_xlim set_ylim plot scatter hist boxplot imshow cmap alpha bins tick_params annotate quiver contour barh stackplot subplots_adjust axhline axvline semilogx semilogy loglog polar streamplot hexbin pcolor tricontour errorbar clabel set_aspect violinplot set_axis_off spines text hatch plt axis plt.bar() plt.axis import figure pyplot highlight_text pypalettes plt.subplots() xlabel ylabel title legend colorbar savefig tight_layout grid set_xlim set_ylim plot scatter hist boxplot imshow cmap alpha bins tick_params annotate quiver contour barh stackplot subplots_adjust axhline axvline semilogx semilogy loglog polar streamplot hexbin pcolor tricontour errorbar clabel set_aspect violinplot set_axis_off spines text hatch plt axis plt.bar() plt.axis import figure pyplot highlight_text pypalettes plt.subplots() xlabel ylabel title legend colorbar savefig tight_layout grid set_xlim set_ylim plot scatter hist boxplot imshow cmap alpha bins tick_params annotate quiver contour barh stackplot subplots_adjust axhline axvline semilogx semilogy loglog polar streamplot hexbin pcolor tricontour errorbar clabel set_aspect violinplot set_axis_off spines text hatch plt axis plt.bar() plt.axis import figure pyplot highlight_text pypalettes plt.subplots() xlabel ylabel title legend colorbar savefig tight_layout grid set_xlim set_ylim plot scatter hist boxplot imshow cmap alpha bins tick_params annotate quiver contour barh stackplot subplots_adjust axhline axvline semilogx semilogy loglog polar streamplot hexbin pcolor tricontour errorbar clabel set_aspect violinplot set_axis_off spines text hatch plt axis plt.bar() plt.axis import figure pyplot highlight_text pypalettes plt.subplots() xlabel ylabel title legend colorbar savefig tight_layout grid set_xlim set_ylim plot scatter hist boxplot imshow cmap alpha bins tick_params annotate quiver contour barh stackplot subplots_adjust axhline axvline semilogx semilogy loglog polar streamplot hexbin pcolor tricontour errorbar clabel set_aspect violinplot set_axis_off spines text hatch plt axis plt.bar() plt.axis import figure pyplot highlight_text pypalettes plt.subplots() xlabel ylabel title legend colorbar savefig tight_layout grid set_xlim set_ylim plot scatter hist boxplot imshow cmap alpha bins tick_params annotate quiver contour barh stackplot subplots_adjust axhline axvline semilogx semilogy loglog polar streamplot hexbin pcolor tricontour errorbar clabel set_aspect violinplot set_axis_off spines text hatch plt axis plt.bar() plt.axis import figure pyplot highlight_text pypalettes plt.subplots() xlabel ylabel title legend colorbar savefig tight_layout grid set_xlim set_ylim plot scatter hist boxplot imshow cmap alpha bins tick_params annotate quiver contour barh stackplot subplots_adjust axhline axvline semilogx semilogy loglog polar streamplot hexbin pcolor tricontour errorbar clabel set_aspect violinplot set_axis_off spines text hatch plt axis plt.bar() plt.axis import figure pyplot highlight_text pypalettes plt.subplots() xlabel ylabel title legend colorbar savefig tight_layout grid set_xlim set_ylim plot scatter hist boxplot imshow cmap alpha bins tick_params annotate quiver contour barh stackplot subplots_adjust axhline axvline semilogx semilogy loglog polar streamplot hexbin pcolor tricontour errorbar clabel set_aspect violinplot set_axis_off spines text hatch plt axis plt.bar() plt.axis import figure pyplot highlight_text pypalettes plt.subplots() xlabel ylabel title legend colorbar savefig tight_layout grid set_xlim set_ylim plot scatter hist boxplot imshow cmap alpha bins tick_params annotate quiver contour barh stackplot subplots_adjust axhline axvline semilogx semilogy loglog polar streamplot hexbin pcolor tricontour errorbar clabel set_aspect violinplot set_axis_off spines text hatch plt axis plt.bar() plt.axis import figure pyplot highlight_text pypalettes plt.subplots() xlabel ylabel title legend colorbar savefig tight_layout grid set_xlim set_ylim plot scatter hist boxplot imshow cmap alpha bins tick_params annotate quiver contour barh stackplot subplots_adjust axhline axvline semilogx semilogy loglog polar streamplot hexbin pcolor tricontour errorbar clabel set_aspect violinplot set_axis_off spines text hatch plt axis plt.bar() plt.axis import figure pyplot highlight_text pypalettes plt.subplots() xlabel ylabel title legend colorbar savefig tight_layout grid set_xlim set_ylim plot scatter hist boxplot imshow cmap alpha bins tick_params annotate quiver contour barh stackplot subplots_adjust axhline axvline semilogx semilogy loglog polar streamplot hexbin pcolor tricontour errorbar clabel set_aspect violinplot set_axis_off spines text hatch plt axis plt.bar() plt.axis import figure pyplot highlight_text pypalettes plt.subplots() xlabel ylabel title legend colorbar savefig tight_layout grid set_xlim set_ylim plot scatter hist boxplot imshow cmap alpha bins tick_params annotate quiver contour barh stackplot subplots_adjust axhline axvline semilogx semilogy loglog polar streamplot hexbin pcolor tricontour errorbar clabel set_aspect violinplot set_axis_off spines text hatch plt axis plt.bar() plt.axis import figure pyplot highlight_text pypalettes plt.subplots() xlabel ylabel title legend colorbar savefig tight_layout grid set_xlim set_ylim plot scatter hist boxplot imshow cmap alpha bins tick_params annotate quiver contour barh stackplot subplots_adjust axhline axvline semilogx semilogy loglog polar streamplot hexbin pcolor tricontour errorbar clabel set_aspect violinplot set_axis_off spines text hatch plt axis plt.bar() plt.axis import figure pyplot highlight_text pypalettes plt.subplots() xlabel ylabel title legend colorbar savefig tight_layout grid set_xlim set_ylim plot scatter hist boxplot imshow cmap alpha bins tick_params annotate quiver contour barh stackplot subplots_adjust axhline axvline semilogx semilogy loglog polar streamplot hexbin pcolor tricontour errorbar clabel set_aspect violinplot set_axis_off spines text hatch plt axis plt.bar() plt.axis import figure pyplot highlight_text pypalettes plt.subplots() xlabel ylabel title legend colorbar savefig tight_layout grid set_xlim set_ylim plot scatter hist boxplot imshow cmap alpha bins tick_params annotate quiver contour barh stackplot subplots_adjust axhline axvline semilogx semilogy loglog polar streamplot hexbin pcolor tricontour errorbar clabel set_aspect violinplot set_axis_off spines text hatch plt axis plt.bar() plt.axis import figure pyplot highlight_text pypalettes plt.subplots() xlabel ylabel title legend colorbar savefig tight_layout grid set_xlim set_ylim plot scatter hist boxplot imshow cmap alpha bins tick_params annotate quiver contour barh stackplot subplots_adjust axhline axvline semilogx semilogy loglog polar streamplot hexbin pcolor tricontour errorbar clabel set_aspect violinplot set_axis_off spines text hatch plt axis plt.bar() plt.axis import figure pyplot highlight_text pypalettes plt.subplots() xlabel ylabel title legend colorbar savefig tight_layout grid set_xlim set_ylim plot scatter hist boxplot imshow cmap alpha bins tick_params annotate quiver contour barh stackplot subplots_adjust axhline axvline semilogx semilogy loglog polar streamplot hexbin pcolor tricontour errorbar clabel set_aspect violinplot set_axis_off spines text hatch plt axis plt.bar() plt.axis import figure pyplot highlight_text pypalettes plt.subplots() xlabel ylabel title legend colorbar savefig tight_layout grid set_xlim set_ylim plot scatter hist boxplot imshow cmap alpha bins tick_params annotate quiver contour barh stackplot subplots_adjust axhline axvline semilogx semilogy loglog polar streamplot hexbin pcolor tricontour errorbar clabel set_aspect violinplot set_axis_off spines text hatch plt axis plt.bar() plt.axis import figure pyplot highlight_text pypalettes plt.subplots() xlabel ylabel title legend colorbar savefig tight_layout grid set_xlim set_ylim plot scatter hist boxplot imshow cmap alpha bins tick_params annotate quiver contour barh stackplot subplots_adjust axhline axvline semilogx semilogy loglog polar streamplot hexbin pcolor tricontour errorbar clabel set_aspect violinplot set_axis_off spines text hatch plt axis plt.bar() plt.axis import figure pyplot highlight_text pypalettes plt.subplots() xlabel ylabel title legend colorbar savefig tight_layout grid set_xlim set_ylim plot scatter hist boxplot imshow cmap alpha bins tick_params annotate quiver contour barh stackplot subplots_adjust axhline axvline semilogx semilogy loglog polar streamplot hexbin pcolor tricontour errorbar clabel set_aspect violinplot set_axis_off spines text hatch plt axis plt.bar() plt.axis import figure pyplot highlight_text pypalettes plt.subplots() xlabel ylabel title legend colorbar savefig tight_layout grid set_xlim set_ylim plot scatter hist boxplot imshow cmap alpha bins tick_params annotate quiver contour barh stackplot subplots_adjust axhline axvline semilogx semilogy loglog polar streamplot hexbin pcolor tricontour errorbar clabel set_aspect violinplot set_axis_off spines text hatch plt axis plt.bar() plt.axis import figure pyplot highlight_text pypalettes plt.subplots() xlabel ylabel title legend colorbar savefig tight_layout grid set_xlim set_ylim plot scatter hist boxplot imshow cmap alpha bins tick_params annotate quiver contour barh stackplot subplots_adjust axhline axvline semilogx semilogy loglog polar streamplot hexbin pcolor tricontour errorbar clabel set_aspect violinplot set_axis_off spines text hatch plt axis plt.bar() plt.axis import figure pyplot highlight_text pypalettes plt.subplots() xlabel ylabel title legend colorbar savefig tight_layout grid set_xlim set_ylim plot scatter hist boxplot imshow cmap alpha bins tick_params annotate quiver contour barh stackplot subplots_adjust axhline axvline semilogx semilogy loglog polar streamplot hexbin pcolor tricontour errorbar clabel set_aspect violinplot set_axis_off spines text hatch plt axis plt.bar() plt.axis import figure pyplot highlight_text pypalettes plt.subplots() xlabel ylabel title legend colorbar savefig tight_layout grid set_xlim set_ylim plot scatter hist boxplot imshow cmap alpha bins tick_params annotate quiver contour barh stackplot subplots_adjust axhline axvline semilogx semilogy loglog polar streamplot hexbin pcolor tricontour errorbar clabel set_aspect violinplot set_axis_off spines text hatch plt axis plt.bar() plt.axis import figure pyplot highlight_text pypalettes plt.subplots() xlabel ylabel title legend colorbar savefig tight_layout grid set_xlim set_ylim plot scatter hist boxplot imshow cmap alpha bins tick_params annotate quiver contour barh stackplot subplots_adjust axhline axvline semilogx semilogy loglog polar streamplot hexbin pcolor tricontour errorbar clabel set_aspect violinplot set_axis_off spines text hatch plt axis plt.bar() plt.axis import figure pyplot highlight_text pypalettes plt.subplots() xlabel ylabel title legend colorbar savefig tight_layout grid set_xlim set_ylim plot scatter hist boxplot imshow cmap alpha bins tick_params annotate quiver contour barh stackplot subplots_adjust axhline axvline semilogx semilogy loglog polar streamplot hexbin pcolor tricontour errorbar clabel set_aspect violinplot set_axis_off spines text hatch plt axis plt.bar() plt.axis import figure pyplot highlight_text pypalettes plt.subplots() xlabel ylabel title legend colorbar savefig tight_layout grid set_xlim set_ylim plot scatter hist boxplot imshow cmap alpha bins tick_params annotate quiver contour barh stackplot subplots_adjust axhline axvline semilogx semilogy loglog polar streamplot hexbin pcolor tricontour errorbar clabel set_aspect violinplot set_axis_off spines text hatch plt axis plt.bar() plt.axis import figure pyplot highlight_text pypalettes plt.subplots() xlabel ylabel title legend colorbar savefig tight_layout grid set_xlim set_ylim plot scatter hist boxplot imshow cmap alpha bins tick_params annotate quiver contour barh stackplot subplots_adjust axhline axvline semilogx semilogy loglog polar streamplot hexbin pcolor tricontour errorbar clabel set_aspect violinplot set_axis_off spines text hatch plt axis plt.bar() plt.axis import figure pyplot highlight_text pypalettes plt.subplots() xlabel ylabel title legend colorbar savefig tight_layout grid set_xlim set_ylim plot scatter hist boxplot imshow cmap alpha bins tick_params annotate quiver contour barh stackplot subplots_adjust axhline axvline semilogx semilogy loglog polar streamplot hexbin pcolor tricontour errorbar clabel set_aspect violinplot set_axis_off spines text hatch plt axis plt.bar() plt.axis import figure pyplot highlight_text pypalettes plt.subplots() xlabel ylabel title legend colorbar savefig tight_layout grid set_xlim set_ylim plot scatter hist boxplot imshow cmap alpha bins tick_params annotate quiver contour barh stackplot subplots_adjust axhline axvline semilogx semilogy loglog polar streamplot hexbin pcolor tricontour errorbar clabel set_aspect violinplot set_axis_off spines text hatch plt axis plt.bar() plt.axis import figure pyplot highlight_text pypalettes plt.subplots() xlabel ylabel title legend colorbar savefig tight_layout grid set_xlim set_ylim plot scatter hist boxplot imshow cmap alpha bins tick_params annotate quiver contour barh stackplot subplots_adjust axhline axvline semilogx semilogy loglog polar streamplot hexbin pcolor tricontour errorbar clabel set_aspect violinplot set_axis_off spines text hatch plt axis plt.bar() plt.axis import figure pyplot highlight_text pypalettes plt.subplots() xlabel ylabel title legend colorbar savefig tight_layout grid set_xlim set_ylim plot scatter hist boxplot imshow cmap alpha bins tick_params annotate quiver contour barh stackplot subplots_adjust axhline axvline semilogx semilogy loglog polar streamplot hexbin pcolor tricontour errorbar clabel set_aspect violinplot set_axis_off spines text hatch plt axis plt.bar() plt.axis import figure pyplot highlight_text pypalettes plt.subplots() xlabel ylabel title legend colorbar savefig tight_layout grid set_xlim set_ylim plot scatter hist boxplot imshow cmap alpha bins tick_params annotate quiver contour barh stackplot subplots_adjust axhline axvline semilogx semilogy loglog polar streamplot hexbin pcolor tricontour errorbar clabel set_aspect violinplot set_axis_off spines text hatch plt axis plt.bar() plt.axis import figure pyplot highlight_text pypalettes plt.subplots() xlabel ylabel title legend colorbar savefig tight_layout grid set_xlim set_ylim plot scatter hist boxplot imshow cmap alpha bins tick_params annotate quiver contour barh stackplot subplots_adjust axhline axvline semilogx semilogy loglog polar streamplot hexbin pcolor tricontour errorbar clabel set_aspect violinplot set_axis_off spines text hatch plt axis plt.bar() plt.axis import figure pyplot highlight_text pypalettes plt.subplots() xlabel ylabel title legend colorbar savefig tight_layout grid set_xlim set_ylim plot scatter hist boxplot imshow cmap alpha bins tick_params annotate quiver contour barh stackplot subplots_adjust axhline axvline semilogx semilogy loglog polar streamplot hexbin pcolor tricontour errorbar clabel set_aspect violinplot set_axis_off spines text hatch plt axis plt.bar() plt.axis import figure pyplot highlight_text pypalettes plt.subplots() xlabel ylabel title legend colorbar savefig tight_layout grid set_xlim set_ylim plot scatter hist boxplot imshow cmap alpha bins tick_params annotate quiver contour barh stackplot subplots_adjust axhline axvline semilogx semilogy loglog polar streamplot hexbin pcolor tricontour errorbar clabel set_aspect violinplot set_axis_off spines text hatch plt axis plt.bar() plt.axis import figure pyplot highlight_text pypalettes plt.subplots() xlabel ylabel title legend colorbar savefig tight_layout grid set_xlim set_ylim plot scatter hist boxplot imshow cmap alpha bins tick_params annotate quiver contour barh stackplot subplots_adjust axhline axvline semilogx semilogy loglog polar streamplot hexbin pcolor tricontour errorbar clabel set_aspect violinplot set_axis_off spines text hatch plt axis plt.bar() plt.axis import figure pyplot highlight_text pypalettes plt.subplots() xlabel ylabel title legend colorbar savefig tight_layout grid set_xlim set_ylim plot scatter hist boxplot imshow cmap alpha bins tick_params annotate quiver contour barh stackplot subplots_adjust axhline axvline semilogx semilogy loglog polar streamplot hexbin pcolor tricontour errorbar clabel set_aspect violinplot set_axis_off spines text hatch plt axis plt.bar() plt.axis import figure pyplot highlight_text pypalettes plt.subplots() xlabel ylabel title legend colorbar savefig tight_layout grid set_xlim set_ylim plot scatter hist boxplot imshow cmap alpha bins tick_params annotate quiver contour barh stackplot subplots_adjust axhline axvline semilogx semilogy loglog polar streamplot hexbin pcolor tricontour errorbar clabel set_aspect violinplot set_axis_off spines text hatch plt axis plt.bar() plt.axis import figure pyplot highlight_text pypalettes plt.subplots() xlabel ylabel title legend colorbar savefig tight_layout grid set_xlim set_ylim plot scatter hist boxplot imshow cmap alpha bins tick_params annotate quiver contour barh stackplot subplots_adjust axhline axvline semilogx semilogy loglog polar streamplot hexbin pcolor tricontour errorbar clabel set_aspect violinplot set_axis_off spines text hatch plt axis plt.bar() plt.axis import figure pyplot highlight_text pypalettes plt.subplots() xlabel ylabel title legend colorbar savefig tight_layout grid set_xlim set_ylim plot scatter hist boxplot imshow cmap alpha bins tick_params annotate quiver contour barh stackplot subplots_adjust axhline axvline semilogx semilogy loglog polar streamplot hexbin pcolor tricontour errorbar clabel set_aspect violinplot set_axis_off spines text hatch plt axis plt.bar() plt.axis import figure pyplot highlight_text pypalettes plt.subplots() xlabel ylabel title legend colorbar savefig tight_layout grid set_xlim set_ylim plot scatter hist boxplot imshow cmap alpha bins tick_params annotate quiver contour barh stackplot subplots_adjust axhline axvline semilogx semilogy loglog polar streamplot hexbin pcolor tricontour errorbar clabel set_aspect violinplot set_axis_off spines text hatch plt axis plt.bar() plt.axis import figure pyplot highlight_text pypalettes plt.subplots() xlabel ylabel title legend colorbar savefig tight_layout grid set_xlim set_ylim plot scatter hist boxplot imshow cmap alpha bins tick_params annotate quiver contour barh stackplot subplots_adjust axhline axvline semilogx semilogy loglog polar streamplot hexbin pcolor tricontour errorbar clabel set_aspect violinplot set_axis_off spines text hatch plt axis plt.bar() plt.axis import figure pyplot highlight_text pypalettes plt.subplots() xlabel ylabel title legend colorbar savefig tight_layout grid set_xlim set_ylim plot scatter hist boxplot imshow cmap alpha bins tick_params annotate quiver contour barh stackplot subplots_adjust axhline axvline semilogx semilogy loglog polar streamplot hexbin pcolor tricontour errorbar clabel set_aspect violinplot set_axis_off spines text hatch plt axis plt.bar() plt.axis import figure pyplot highlight_text pypalettes plt.subplots() xlabel ylabel title legend colorbar savefig tight_layout grid set_xlim set_ylim plot scatter hist boxplot imshow cmap alpha bins tick_params annotate quiver contour barh stackplot subplots_adjust axhline axvline semilogx semilogy loglog polar streamplot hexbin pcolor tricontour errorbar clabel set_aspect violinplot set_axis_off spines text hatch plt axis plt.bar() plt.axis import figure pyplot highlight_text pypalettes plt.subplots() xlabel ylabel title legend colorbar savefig tight_layout grid set_xlim set_ylim plot scatter hist boxplot imshow cmap alpha bins tick_params annotate quiver contour barh stackplot subplots_adjust axhline axvline semilogx semilogy loglog polar streamplot hexbin pcolor tricontour errorbar clabel set_aspect violinplot set_axis_off spines text hatch plt axis plt.bar() plt.axis import figure pyplot highlight_text pypalettes plt.subplots() xlabel ylabel title legend colorbar savefig tight_layout grid set_xlim set_ylim plot scatter hist boxplot imshow cmap alpha bins tick_params annotate quiver contour barh stackplot subplots_adjust axhline axvline semilogx semilogy loglog polar streamplot hexbin pcolor tricontour errorbar clabel set_aspect violinplot set_axis_off spines text hatch plt axis plt.bar() plt.axis import figure pyplot highlight_text pypalettes plt.subplots() xlabel ylabel title legend colorbar savefig tight_layout grid set_xlim set_ylim plot scatter hist boxplot imshow cmap alpha bins tick_params annotate quiver contour barh stackplot subplots_adjust axhline axvline semilogx semilogy loglog polar streamplot hexbin pcolor tricontour errorbar clabel set_aspect violinplot set_axis_off spines text hatch plt axis plt.bar() plt.axis import figure pyplot highlight_text pypalettes plt.subplots() xlabel ylabel title legend colorbar savefig tight_layout grid set_xlim set_ylim plot scatter hist boxplot imshow cmap alpha bins tick_params annotate quiver contour barh stackplot subplots_adjust axhline axvline semilogx semilogy loglog polar streamplot hexbin pcolor tricontour errorbar clabel set_aspect violinplot set_axis_off spines text hatch plt axis plt.bar() plt.axis import figure pyplot highlight_text pypalettes plt.subplots() xlabel ylabel title legend colorbar savefig tight_layout grid set_xlim set_ylim plot scatter hist boxplot imshow cmap alpha bins tick_params annotate quiver contour barh stackplot subplots_adjust axhline axvline semilogx semilogy loglog polar streamplot hexbin pcolor tricontour errorbar clabel set_aspect violinplot set_axis_off spines text hatch plt axis plt.bar() plt.axis import figure pyplot highlight_text pypalettes plt.subplots() xlabel ylabel title legend colorbar savefig tight_layout grid set_xlim set_ylim plot scatter hist boxplot imshow cmap alpha bins tick_params annotate quiver contour barh stackplot subplots_adjust axhline axvline semilogx semilogy loglog polar streamplot hexbin pcolor tricontour errorbar clabel set_aspect violinplot set_axis_off spines text hatch plt axis plt.bar() plt.axis import figure pyplot highlight_text pypalettes plt.subplots() xlabel ylabel title legend colorbar savefig tight_layout grid set_xlim set_ylim plot scatter hist boxplot imshow cmap alpha bins tick_params annotate quiver contour barh stackplot subplots_adjust axhline axvline semilogx semilogy loglog polar streamplot hexbin pcolor tricontour errorbar clabel set_aspect violinplot set_axis_off spines text hatch plt axis plt.bar() plt.axis import figure pyplot highlight_text pypalettes plt.subplots() xlabel ylabel title legend colorbar savefig tight_layout grid set_xlim set_ylim plot scatter hist boxplot imshow cmap alpha bins tick_params annotate quiver contour barh stackplot subplots_adjust axhline axvline semilogx semilogy loglog polar streamplot hexbin pcolor tricontour errorbar clabel set_aspect violinplot set_axis_off spines text hatch plt axis plt.bar() plt.axis import figure pyplot highlight_text pypalettes plt.subplots() xlabel ylabel title legend colorbar savefig tight_layout grid set_xlim set_ylim plot scatter hist boxplot imshow cmap alpha bins tick_params annotate quiver contour barh stackplot subplots_adjust axhline axvline semilogx semilogy loglog polar streamplot hexbin pcolor tricontour errorbar clabel set_aspect violinplot set_axis_off spines text hatch plt axis plt.bar() plt.axis import figure pyplot highlight_text pypalettes plt.subplots() xlabel ylabel title legend colorbar savefig tight_layout grid set_xlim set_ylim plot scatter hist boxplot imshow cmap alpha bins tick_params annotate quiver contour barh stackplot subplots_adjust axhline axvline semilogx semilogy loglog polar streamplot hexbin pcolor tricontour errorbar clabel set_aspect violinplot set_axis_off spines text hatch plt axis plt.bar() plt.axis import figure pyplot highlight_text pypalettes plt.subplots() xlabel ylabel title legend colorbar savefig tight_layout grid set_xlim set_ylim plot scatter hist boxplot imshow cmap alpha bins tick_params annotate quiver contour barh stackplot subplots_adjust axhline axvline semilogx semilogy loglog polar streamplot hexbin pcolor tricontour errorbar clabel set_aspect violinplot set_axis_off spines text hatch plt axis plt.bar() plt.axis import figure pyplot highlight_text pypalettes plt.subplots() xlabel ylabel title legend colorbar savefig tight_layout grid set_xlim set_ylim plot scatter hist boxplot imshow cmap alpha bins tick_params annotate quiver contour barh stackplot subplots_adjust axhline axvline semilogx semilogy loglog polar streamplot hexbin pcolor tricontour errorbar clabel set_aspect violinplot set_axis_off spines text hatch plt axis plt.bar() plt.axis import figure pyplot highlight_text pypalettes plt.subplots() xlabel ylabel title legend colorbar savefig tight_layout grid set_xlim set_ylim plot scatter hist boxplot imshow cmap alpha bins tick_params annotate quiver contour barh stackplot subplots_adjust axhline axvline semilogx semilogy loglog polar streamplot hexbin pcolor tricontour errorbar clabel set_aspect violinplot set_axis_off spines text hatch plt axis plt.bar() plt.axis import figure pyplot highlight_text pypalettes plt.subplots() xlabel ylabel title legend colorbar savefig tight_layout grid set_xlim set_ylim plot scatter hist boxplot imshow cmap alpha bins tick_params annotate quiver contour barh stackplot subplots_adjust axhline axvline semilogx semilogy loglog polar streamplot hexbin pcolor tricontour errorbar clabel set_aspect violinplot set_axis_off spines text hatch plt axis plt.bar() plt.axis import figure pyplot highlight_text pypalettes plt.subplots() xlabel ylabel title legend colorbar savefig tight_layout grid set_xlim set_ylim plot scatter hist boxplot imshow cmap alpha bins tick_params annotate quiver contour barh stackplot subplots_adjust axhline axvline semilogx semilogy loglog polar streamplot hexbin pcolor tricontour errorbar clabel set_aspect violinplot set_axis_off spines text hatch plt axis plt.bar() plt.axis import figure pyplot highlight_text pypalettes plt.subplots() xlabel ylabel title legend colorbar savefig tight_layout grid set_xlim set_ylim plot scatter hist boxplot imshow cmap alpha bins tick_params annotate quiver contour barh stackplot subplots_adjust axhline axvline semilogx semilogy loglog polar streamplot hexbin pcolor tricontour errorbar clabel set_aspect violinplot set_axis_off spines text hatch plt axis plt.bar() plt.axis import figure pyplot highlight_text pypalettes plt.subplots() xlabel ylabel title legend colorbar savefig tight_layout grid set_xlim set_ylim plot scatter hist boxplot imshow cmap alpha bins tick_params annotate quiver contour barh stackplot subplots_adjust axhline axvline semilogx semilogy loglog polar streamplot hexbin pcolor tricontour errorbar clabel set_aspect violinplot set_axis_off spines text hatch plt axis plt.bar() plt.axis import figure pyplot highlight_text pypalettes plt.subplots() xlabel ylabel title legend colorbar savefig tight_layout grid set_xlim set_ylim plot scatter hist boxplot imshow cmap alpha bins tick_params annotate quiver contour barh stackplot subplots_adjust axhline axvline semilogx semilogy loglog polar streamplot hexbin pcolor tricontour errorbar clabel set_aspect violinplot set_axis_off spines text hatch plt axis plt.bar() plt.axis import figure pyplot highlight_text pypalettes plt.subplots() xlabel ylabel title legend colorbar savefig tight_layout grid set_xlim set_ylim plot scatter hist boxplot imshow cmap alpha bins tick_params annotate quiver contour barh stackplot subplots_adjust axhline axvline semilogx semilogy loglog polar streamplot hexbin pcolor tricontour errorbar clabel set_aspect violinplot set_axis_off spines text hatch plt axis plt.bar() plt.axis import figure pyplot highlight_text pypalettes plt.subplots() xlabel ylabel title legend colorbar savefig tight_layout grid set_xlim set_ylim plot scatter hist boxplot imshow cmap alpha bins tick_params annotate quiver contour barh stackplot subplots_adjust axhline axvline semilogx semilogy loglog polar streamplot hexbin pcolor tricontour errorbar clabel set_aspect violinplot set_axis_off spines text hatch plt axis plt.bar() plt.axis import figure pyplot highlight_text pypalettes plt.subplots() xlabel ylabel title legend colorbar savefig tight_layout grid set_xlim set_ylim plot scatter hist boxplot imshow cmap alpha bins tick_params annotate quiver contour barh stackplot subplots_adjust axhline axvline semilogx semilogy loglog polar streamplot hexbin pcolor tricontour errorbar clabel set_aspect violinplot set_axis_off spines text hatch plt axis plt.bar() plt.axis import figure pyplot highlight_text pypalettes plt.subplots() xlabel ylabel title legend colorbar savefig tight_layout grid set_xlim set_ylim plot scatter hist boxplot imshow cmap alpha bins tick_params annotate quiver contour barh stackplot subplots_adjust axhline axvline semilogx semilogy loglog polar streamplot hexbin pcolor tricontour errorbar clabel set_aspect violinplot set_axis_off spines text hatch plt axis plt.bar() plt.axis import figure pyplot highlight_text pypalettes plt.subplots() xlabel ylabel title legend colorbar savefig tight_layout grid set_xlim set_ylim plot scatter hist boxplot imshow cmap alpha bins tick_params annotate quiver contour barh stackplot subplots_adjust axhline axvline semilogx semilogy loglog polar streamplot hexbin pcolor tricontour errorbar clabel set_aspect violinplot set_axis_off spines text hatch plt axis plt.bar() plt.axis import figure pyplot highlight_text pypalettes plt.subplots() xlabel ylabel title legend colorbar savefig tight_layout grid set_xlim set_ylim plot scatter hist boxplot imshow cmap alpha bins tick_params annotate quiver contour barh stackplot subplots_adjust axhline axvline semilogx semilogy loglog polar streamplot hexbin pcolor tricontour errorbar clabel set_aspect violinplot set_axis_off spines text hatch plt axis plt.bar() plt.axis import figure pyplot highlight_text pypalettes plt.subplots() xlabel ylabel title legend colorbar savefig tight_layout grid set_xlim set_ylim plot scatter hist boxplot imshow cmap alpha bins tick_params annotate quiver contour barh stackplot subplots_adjust axhline axvline semilogx semilogy loglog polar streamplot hexbin pcolor tricontour errorbar clabel set_aspect violinplot set_axis_off spines text hatch plt axis plt.bar() plt.axis import figure pyplot highlight_text pypalettes plt.subplots() xlabel ylabel title legend colorbar savefig tight_layout grid set_xlim set_ylim plot scatter hist boxplot imshow cmap alpha bins tick_params annotate quiver contour barh stackplot subplots_adjust axhline axvline semilogx semilogy loglog polar streamplot hexbin pcolor tricontour errorbar clabel set_aspect violinplot set_axis_off spines text hatch plt axis plt.bar() plt.axis import figure pyplot highlight_text pypalettes plt.subplots() xlabel ylabel title legend colorbar savefig tight_layout grid set_xlim set_ylim plot scatter hist boxplot imshow cmap alpha bins tick_params annotate quiver contour barh stackplot subplots_adjust axhline axvline semilogx semilogy loglog polar streamplot hexbin pcolor tricontour errorbar clabel set_aspect violinplot set_axis_off spines text hatch plt axis plt.bar() plt.axis import figure pyplot highlight_text pypalettes plt.subplots() xlabel ylabel title legend colorbar savefig tight_layout grid set_xlim set_ylim plot scatter hist boxplot imshow cmap alpha bins tick_params annotate quiver contour barh stackplot subplots_adjust axhline axvline semilogx semilogy loglog polar streamplot hexbin pcolor tricontour errorbar clabel set_aspect violinplot set_axis_off spines text hatch plt axis plt.bar() plt.axis import figure pyplot highlight_text pypalettes plt.subplots() xlabel ylabel title legend colorbar savefig tight_layout grid set_xlim set_ylim plot scatter hist boxplot imshow cmap alpha bins tick_params annotate quiver contour barh stackplot subplots_adjust axhline axvline semilogx semilogy loglog polar streamplot hexbin pcolor tricontour errorbar clabel set_aspect violinplot set_axis_off spines text hatch plt axis plt.bar() plt.axis import figure pyplot highlight_text pypalettes plt.subplots() xlabel ylabel title legend colorbar savefig tight_layout grid set_xlim set_ylim plot scatter hist boxplot imshow cmap alpha bins tick_params annotate quiver contour barh stackplot subplots_adjust axhline axvline semilogx semilogy loglog polar streamplot hexbin pcolor tricontour errorbar clabel set_aspect violinplot set_axis_off spines text hatch plt axis plt.bar() plt.axis import figure pyplot highlight_text pypalettes plt.subplots() xlabel ylabel title legend colorbar savefig tight_layout grid set_xlim set_ylim plot scatter hist boxplot imshow cmap alpha bins tick_params annotate quiver contour barh stackplot subplots_adjust axhline axvline semilogx semilogy loglog polar streamplot hexbin pcolor tricontour errorbar clabel set_aspect violinplot set_axis_off spines text hatch plt axis plt.bar() plt.axis import figure pyplot highlight_text pypalettes plt.subplots() xlabel ylabel title legend colorbar savefig tight_layout grid set_xlim set_ylim plot scatter hist boxplot imshow cmap alpha bins tick_params annotate quiver contour barh stackplot subplots_adjust axhline axvline semilogx semilogy loglog polar streamplot hexbin pcolor tricontour errorbar clabel set_aspect violinplot set_axis_off spines text hatch plt axis plt.bar() plt.axis import figure pyplot highlight_text pypalettes plt.subplots() xlabel ylabel title legend colorbar savefig tight_layout grid set_xlim set_ylim plot scatter hist boxplot imshow cmap alpha bins tick_params annotate quiver contour barh stackplot subplots_adjust axhline axvline semilogx semilogy loglog polar streamplot hexbin pcolor tricontour errorbar clabel set_aspect violinplot set_axis_off spines text hatch plt axis plt.bar() plt.axis import figure pyplot highlight_text pypalettes plt.subplots() xlabel ylabel title legend colorbar savefig tight_layout grid set_xlim set_ylim plot scatter hist boxplot imshow cmap alpha bins tick_params annotate quiver contour barh stackplot subplots_adjust axhline axvline semilogx semilogy loglog polar streamplot hexbin pcolor tricontour errorbar clabel set_aspect violinplot set_axis_off spines text hatch plt axis plt.bar() plt.axis import figure pyplot highlight_text pypalettes plt.subplots() xlabel ylabel title legend colorbar savefig tight_layout grid set_xlim set_ylim plot scatter hist boxplot imshow cmap alpha bins tick_params annotate quiver contour barh stackplot subplots_adjust axhline axvline semilogx semilogy loglog polar streamplot hexbin pcolor tricontour errorbar clabel set_aspect violinplot set_axis_off spines text hatch plt axis plt.bar() plt.axis import figure pyplot highlight_text pypalettes plt.subplots() xlabel ylabel title legend colorbar savefig tight_layout grid set_xlim set_ylim plot scatter hist boxplot imshow cmap alpha bins tick_params annotate quiver contour barh stackplot subplots_adjust axhline axvline semilogx semilogy loglog polar streamplot hexbin pcolor tricontour errorbar clabel set_aspect violinplot set_axis_off spines text hatch plt axis plt.bar() plt.axis import figure pyplot highlight_text pypalettes plt.subplots() xlabel ylabel title legend colorbar savefig tight_layout grid set_xlim set_ylim plot scatter hist boxplot imshow cmap alpha bins tick_params annotate quiver contour barh stackplot subplots_adjust axhline axvline semilogx semilogy loglog polar streamplot hexbin pcolor tricontour errorbar clabel set_aspect violinplot set_axis_off spines text hatch plt axis plt.bar() plt.axis import figure pyplot highlight_text pypalettes plt.subplots() xlabel ylabel title legend colorbar savefig tight_layout grid set_xlim set_ylim plot scatter hist boxplot imshow cmap alpha bins tick_params annotate quiver contour barh stackplot subplots_adjust axhline axvline semilogx semilogy loglog polar streamplot hexbin pcolor tricontour errorbar clabel set_aspect violinplot set_axis_off spines text hatch plt axis plt.bar() plt.axis import figure pyplot highlight_text pypalettes plt.subplots() xlabel ylabel title legend colorbar savefig tight_layout grid set_xlim set_ylim plot scatter hist boxplot imshow cmap alpha bins tick_params annotate quiver contour barh stackplot subplots_adjust axhline axvline semilogx semilogy loglog polar streamplot hexbin pcolor tricontour errorbar clabel set_aspect violinplot set_axis_off spines text hatch plt axis plt.bar() plt.axis import figure pyplot highlight_text pypalettes plt.subplots() xlabel ylabel title legend colorbar savefig tight_layout grid set_xlim set_ylim plot scatter hist boxplot imshow cmap alpha bins tick_params annotate quiver contour barh stackplot subplots_adjust axhline axvline semilogx semilogy loglog polar streamplot hexbin pcolor tricontour errorbar clabel set_aspect violinplot set_axis_off spines text hatch plt axis plt.bar() plt.axis import figure pyplot highlight_text pypalettes plt.subplots() xlabel ylabel title legend colorbar savefig tight_layout grid set_xlim set_ylim plot scatter hist boxplot imshow cmap alpha bins tick_params annotate quiver contour barh stackplot subplots_adjust axhline axvline semilogx semilogy loglog polar streamplot hexbin pcolor tricontour errorbar clabel set_aspect violinplot set_axis_off spines text hatch plt axis plt.bar() plt.axis import figure pyplot highlight_text pypalettes plt.subplots() xlabel ylabel title legend colorbar savefig tight_layout grid set_xlim set_ylim plot scatter hist boxplot imshow cmap alpha bins tick_params annotate quiver contour barh stackplot subplots_adjust axhline axvline semilogx semilogy loglog polar streamplot hexbin pcolor tricontour errorbar clabel set_aspect violinplot set_axis_off spines text hatch plt axis plt.bar() plt.axis import figure pyplot highlight_text pypalettes plt.subplots() xlabel ylabel title legend colorbar savefig tight_layout grid set_xlim set_ylim plot scatter hist boxplot imshow cmap alpha bins tick_params annotate quiver contour barh stackplot subplots_adjust axhline axvline semilogx semilogy loglog polar streamplot hexbin pcolor tricontour errorbar clabel set_aspect violinplot set_axis_off spines text hatch plt axis plt.bar() plt.axis import figure pyplot highlight_text pypalettes plt.subplots() xlabel ylabel title legend colorbar savefig tight_layout grid set_xlim set_ylim plot scatter hist boxplot imshow cmap alpha bins tick_params annotate quiver contour barh stackplot subplots_adjust axhline axvline semilogx semilogy loglog polar streamplot hexbin pcolor tricontour errorbar clabel set_aspect violinplot set_axis_off spines text hatch plt axis plt.bar() plt.axis import figure pyplot highlight_text pypalettes plt.subplots() xlabel ylabel title legend colorbar savefig tight_layout grid set_xlim set_ylim plot scatter hist boxplot imshow cmap alpha bins tick_params annotate quiver contour barh stackplot subplots_adjust axhline axvline semilogx semilogy loglog polar streamplot hexbin pcolor tricontour errorbar clabel set_aspect violinplot set_axis_off spines text hatch plt axis plt.bar() plt.axis import figure pyplot highlight_text pypalettes plt.subplots() xlabel ylabel title legend colorbar savefig tight_layout grid set_xlim set_ylim plot scatter hist boxplot imshow cmap alpha bins tick_params annotate quiver contour barh stackplot subplots_adjust axhline axvline semilogx semilogy loglog polar streamplot hexbin pcolor tricontour errorbar clabel set_aspect violinplot set_axis_off spines text hatch plt axis plt.bar() plt.axis import figure pyplot highlight_text pypalettes plt.subplots() xlabel ylabel title legend colorbar savefig tight_layout grid set_xlim set_ylim plot scatter hist boxplot imshow cmap alpha bins tick_params annotate quiver contour barh stackplot subplots_adjust axhline axvline semilogx semilogy loglog polar streamplot hexbin pcolor tricontour errorbar clabel set_aspect violinplot set_axis_off spines text hatch plt axis plt.bar() plt.axis import figure pyplot highlight_text pypalettes plt.subplots() xlabel ylabel title legend colorbar savefig tight_layout grid set_xlim set_ylim plot scatter hist boxplot imshow cmap alpha bins tick_params annotate quiver contour barh stackplot subplots_adjust axhline axvline semilogx semilogy loglog polar streamplot hexbin pcolor tricontour errorbar clabel set_aspect violinplot set_axis_off spines text hatch plt axis plt.bar() plt.axis import figure pyplot highlight_text pypalettes plt.subplots() xlabel ylabel title legend colorbar savefig tight_layout grid set_xlim set_ylim plot scatter hist boxplot imshow cmap alpha bins tick_params annotate quiver contour barh stackplot subplots_adjust axhline axvline semilogx semilogy loglog polar streamplot hexbin pcolor tricontour errorbar clabel set_aspect violinplot set_axis_off spines text hatch plt axis plt.bar() plt.axis import figure pyplot highlight_text pypalettes plt.subplots() xlabel ylabel title legend colorbar savefig tight_layout grid set_xlim set_ylim plot scatter hist boxplot imshow cmap alpha bins tick_params annotate quiver contour barh stackplot subplots_adjust axhline axvline semilogx semilogy loglog polar streamplot hexbin pcolor tricontour errorbar clabel set_aspect violinplot set_axis_off spines text hatch plt axis plt.bar() plt.axis import figure pyplot highlight_text pypalettes plt.subplots() xlabel ylabel title legend colorbar savefig tight_layout grid set_xlim set_ylim plot scatter hist boxplot imshow cmap alpha bins tick_params annotate quiver contour barh stackplot subplots_adjust axhline axvline semilogx semilogy loglog polar streamplot hexbin pcolor tricontour errorbar clabel set_aspect violinplot set_axis_off spines text hatch plt axis plt.bar() plt.axis import figure pyplot highlight_text pypalettes plt.subplots() xlabel ylabel title legend colorbar savefig tight_layout grid set_xlim set_ylim plot scatter hist boxplot imshow cmap alpha bins tick_params annotate quiver contour barh stackplot subplots_adjust axhline axvline semilogx semilogy loglog polar streamplot hexbin pcolor tricontour errorbar clabel set_aspect violinplot set_axis_off spines text hatch plt axis plt.bar() plt.axis import figure pyplot highlight_text pypalettes plt.subplots() xlabel ylabel title legend colorbar savefig tight_layout grid set_xlim set_ylim plot scatter hist boxplot imshow cmap alpha bins tick_params annotate quiver contour barh stackplot subplots_adjust axhline axvline semilogx semilogy loglog polar streamplot hexbin pcolor tricontour errorbar clabel set_aspect violinplot set_axis_off spines text hatch plt axis plt.bar() plt.axis import figure pyplot highlight_text pypalettes plt.subplots() xlabel ylabel title legend colorbar savefig tight_layout grid set_xlim set_ylim plot scatter hist boxplot imshow cmap alpha bins tick_params annotate quiver contour barh stackplot subplots_adjust axhline axvline semilogx semilogy loglog polar streamplot hexbin pcolor tricontour errorbar clabel set_aspect violinplot set_axis_off spines text hatch plt axis plt.bar() plt.axis import figure pyplot highlight_text pypalettes plt.subplots() xlabel ylabel title legend colorbar savefig tight_layout grid set_xlim set_ylim plot scatter hist boxplot imshow cmap alpha bins tick_params annotate quiver contour barh stackplot subplots_adjust axhline axvline semilogx semilogy loglog polar streamplot hexbin pcolor tricontour errorbar clabel set_aspect violinplot set_axis_off spines text hatch plt axis plt.bar() plt.axis import figure pyplot highlight_text pypalettes plt.subplots() xlabel ylabel title legend colorbar savefig tight_layout grid set_xlim set_ylim plot scatter hist boxplot imshow cmap alpha bins tick_params annotate quiver contour barh stackplot subplots_adjust axhline axvline semilogx semilogy loglog polar streamplot hexbin pcolor tricontour errorbar clabel set_aspect violinplot set_axis_off spines text hatch plt axis plt.bar() plt.axis import figure pyplot highlight_text pypalettes plt.subplots() xlabel ylabel title legend colorbar savefig tight_layout grid set_xlim set_ylim plot scatter hist boxplot imshow cmap alpha bins tick_params annotate quiver contour barh stackplot subplots_adjust axhline axvline semilogx semilogy loglog polar streamplot hexbin pcolor tricontour errorbar clabel set_aspect violinplot set_axis_off spines text hatch plt axis plt.bar() plt.axis import figure pyplot highlight_text pypalettes plt.subplots() xlabel ylabel title legend colorbar savefig tight_layout grid set_xlim set_ylim plot scatter hist boxplot imshow cmap alpha bins tick_params annotate quiver contour barh stackplot subplots_adjust axhline axvline semilogx semilogy loglog polar streamplot hexbin pcolor tricontour errorbar clabel set_aspect violinplot set_axis_off spines text hatch plt axis plt.bar() plt.axis import figure pyplot highlight_text pypalettes plt.subplots() xlabel ylabel title legend colorbar savefig tight_layout grid set_xlim set_ylim plot scatter hist boxplot imshow cmap alpha bins tick_params annotate quiver contour barh stackplot subplots_adjust axhline axvline semilogx semilogy loglog polar streamplot hexbin pcolor tricontour errorbar clabel set_aspect violinplot set_axis_off spines text hatch plt axis plt.bar() plt.axis import figure pyplot highlight_text pypalettes plt.subplots() xlabel ylabel title legend colorbar savefig tight_layout grid set_xlim set_ylim plot scatter hist boxplot imshow cmap alpha bins tick_params annotate quiver contour barh stackplot subplots_adjust axhline axvline semilogx semilogy loglog polar streamplot hexbin pcolor tricontour errorbar clabel set_aspect violinplot set_axis_off spines text hatch plt axis plt.bar() plt.axis import figure pyplot highlight_text pypalettes plt.subplots() xlabel ylabel title legend colorbar savefig tight_layout grid set_xlim set_ylim plot scatter hist boxplot imshow cmap alpha bins tick_params annotate quiver contour barh stackplot subplots_adjust axhline axvline semilogx semilogy loglog polar streamplot hexbin pcolor tricontour errorbar clabel set_aspect violinplot set_axis_off spines text hatch plt axis plt.bar() plt.axis import figure pyplot highlight_text pypalettes plt.subplots() xlabel ylabel title legend colorbar savefig tight_layout grid set_xlim set_ylim plot scatter hist boxplot imshow cmap alpha bins tick_params annotate quiver contour barh stackplot subplots_adjust axhline axvline semilogx semilogy loglog polar streamplot hexbin pcolor tricontour errorbar clabel set_aspect violinplot set_axis_off spines text hatch plt axis plt.bar() plt.axis import figure pyplot highlight_text pypalettes plt.subplots() xlabel ylabel title legend colorbar savefig tight_layout grid set_xlim set_ylim plot scatter hist boxplot imshow cmap alpha bins tick_params annotate quiver contour barh stackplot subplots_adjust axhline axvline semilogx semilogy loglog polar streamplot hexbin pcolor tricontour errorbar clabel set_aspect violinplot set_axis_off spines text hatch plt axis plt.bar() plt.axis import figure pyplot highlight_text pypalettes plt.subplots() xlabel ylabel title legend colorbar savefig tight_layout grid set_xlim set_ylim plot scatter hist boxplot imshow cmap alpha bins tick_params annotate quiver contour barh stackplot subplots_adjust axhline axvline semilogx semilogy loglog polar streamplot hexbin pcolor tricontour errorbar clabel set_aspect violinplot set_axis_off spines text hatch plt axis plt.bar() plt.axis import figure pyplot highlight_text pypalettes plt.subplots() xlabel ylabel title legend colorbar savefig tight_layout grid set_xlim set_ylim plot scatter hist boxplot imshow cmap alpha bins tick_params annotate quiver contour barh stackplot subplots_adjust axhline axvline semilogx semilogy loglog polar streamplot hexbin pcolor tricontour errorbar clabel set_aspect violinplot set_axis_off spines text hatch plt axis plt.bar() plt.axis import figure pyplot highlight_text pypalettes plt.subplots() xlabel ylabel title legend colorbar savefig tight_layout grid set_xlim set_ylim plot scatter hist boxplot imshow cmap alpha bins tick_params annotate quiver contour barh stackplot subplots_adjust axhline axvline semilogx semilogy loglog polar streamplot hexbin pcolor tricontour errorbar clabel set_aspect violinplot set_axis_off spines text hatch plt axis plt.bar() plt.axis import figure pyplot highlight_text pypalettes plt.subplots() xlabel ylabel title legend colorbar savefig tight_layout grid set_xlim set_ylim plot scatter hist boxplot imshow cmap alpha bins tick_params annotate quiver contour barh stackplot subplots_adjust axhline axvline semilogx semilogy loglog polar streamplot hexbin pcolor tricontour errorbar clabel set_aspect violinplot set_axis_off spines text hatch plt axis plt.bar() plt.axis import figure pyplot highlight_text pypalettes plt.subplots() xlabel ylabel title legend colorbar savefig tight_layout grid set_xlim set_ylim plot scatter hist boxplot imshow cmap alpha bins tick_params annotate quiver contour barh stackplot subplots_adjust axhline axvline semilogx semilogy loglog polar streamplot hexbin pcolor tricontour errorbar clabel set_aspect violinplot set_axis_off spines text hatch plt axis plt.bar() plt.axis import figure pyplot highlight_text pypalettes plt.subplots() xlabel ylabel title legend colorbar savefig tight_layout grid set_xlim set_ylim plot scatter hist boxplot imshow cmap alpha bins tick_params annotate quiver contour barh stackplot subplots_adjust axhline axvline semilogx semilogy loglog polar streamplot hexbin pcolor tricontour errorbar clabel set_aspect violinplot set_axis_off spines text hatch plt axis plt.bar() plt.axis import figure pyplot highlight_text pypalettes plt.subplots() xlabel ylabel title legend colorbar savefig tight_layout grid set_xlim set_ylim plot scatter hist boxplot imshow cmap alpha bins tick_params annotate quiver contour barh stackplot subplots_adjust axhline axvline semilogx semilogy loglog polar streamplot hexbin pcolor tricontour errorbar clabel set_aspect violinplot set_axis_off spines text hatch plt axis plt.bar() plt.axis import figure pyplot highlight_text pypalettes plt.subplots() xlabel ylabel title legend colorbar savefig tight_layout grid set_xlim set_ylim plot scatter hist boxplot imshow cmap alpha bins tick_params annotate quiver contour barh stackplot subplots_adjust axhline axvline semilogx semilogy loglog polar streamplot hexbin pcolor tricontour errorbar clabel set_aspect violinplot set_axis_off spines text hatch plt axis plt.bar() plt.axis import figure pyplot highlight_text pypalettes plt.subplots() xlabel ylabel title legend colorbar savefig tight_layout grid set_xlim set_ylim plot scatter hist boxplot imshow cmap alpha bins tick_params annotate quiver contour barh stackplot subplots_adjust axhline axvline semilogx semilogy loglog polar streamplot hexbin pcolor tricontour errorbar clabel set_aspect violinplot set_axis_off spines text hatch plt axis plt.bar() plt.axis import figure pyplot highlight_text pypalettes plt.subplots() xlabel ylabel title legend colorbar savefig tight_layout grid set_xlim set_ylim plot scatter hist boxplot imshow cmap alpha bins tick_params annotate quiver contour barh stackplot subplots_adjust axhline axvline semilogx semilogy loglog polar streamplot hexbin pcolor tricontour errorbar clabel set_aspect violinplot set_axis_off spines text hatch plt axis plt.bar() plt.axis import figure pyplot highlight_text pypalettes plt.subplots() xlabel ylabel title legend colorbar savefig tight_layout grid set_xlim set_ylim plot scatter hist boxplot imshow cmap alpha bins tick_params annotate quiver contour barh stackplot subplots_adjust axhline axvline semilogx semilogy loglog polar streamplot hexbin pcolor tricontour errorbar clabel set_aspect violinplot set_axis_off spines text hatch plt axis plt.bar() plt.axis import figure pyplot highlight_text pypalettes plt.subplots() xlabel ylabel title legend colorbar savefig tight_layout grid set_xlim set_ylim plot scatter hist boxplot imshow cmap alpha bins tick_params annotate quiver contour barh stackplot subplots_adjust axhline axvline semilogx semilogy loglog polar streamplot hexbin pcolor tricontour errorbar clabel set_aspect violinplot set_axis_off spines text hatch plt axis plt.bar() plt.axis import figure pyplot highlight_text pypalettes plt.subplots() xlabel ylabel title legend colorbar savefig tight_layout grid set_xlim set_ylim plot scatter hist boxplot imshow cmap alpha bins tick_params annotate quiver contour barh stackplot subplots_adjust axhline axvline semilogx semilogy loglog polar streamplot hexbin pcolor tricontour errorbar clabel set_aspect violinplot set_axis_off spines text hatch plt axis plt.bar() plt.axis import figure pyplot highlight_text pypalettes plt.subplots() xlabel ylabel title legend colorbar savefig tight_layout grid set_xlim set_ylim plot scatter hist boxplot imshow cmap alpha bins tick_params annotate quiver contour barh stackplot subplots_adjust axhline axvline semilogx semilogy loglog polar streamplot hexbin pcolor tricontour errorbar clabel set_aspect violinplot set_axis_off spines text hatch plt axis plt.bar() plt.axis import figure pyplot highlight_text pypalettes plt.subplots() xlabel ylabel title legend colorbar savefig tight_layout grid set_xlim set_ylim plot scatter hist boxplot imshow cmap alpha bins tick_params annotate quiver contour barh stackplot subplots_adjust axhline axvline semilogx semilogy loglog polar streamplot hexbin pcolor tricontour errorbar clabel set_aspect violinplot set_axis_off spines text hatch plt axis plt.bar() plt.axis import figure pyplot highlight_text pypalettes plt.subplots() xlabel ylabel title legend colorbar savefig tight_layout grid set_xlim set_ylim plot scatter hist boxplot imshow cmap alpha bins tick_params annotate quiver contour barh stackplot subplots_adjust axhline axvline semilogx semilogy loglog polar streamplot hexbin pcolor tricontour errorbar clabel set_aspect violinplot set_axis_off spines text hatch plt axis plt.bar() plt.axis import figure pyplot highlight_text pypalettes plt.subplots() xlabel ylabel title legend colorbar savefig tight_layout grid set_xlim set_ylim plot scatter hist boxplot imshow cmap alpha bins tick_params annotate quiver contour barh stackplot subplots_adjust axhline axvline semilogx semilogy loglog polar streamplot hexbin pcolor tricontour errorbar clabel set_aspect violinplot set_axis_off spines text hatch plt axis plt.bar() plt.axis import figure pyplot highlight_text pypalettes plt.subplots() xlabel ylabel title legend colorbar savefig tight_layout grid set_xlim set_ylim plot scatter hist boxplot imshow cmap alpha bins tick_params annotate quiver contour barh stackplot subplots_adjust axhline axvline semilogx semilogy loglog polar streamplot hexbin pcolor tricontour errorbar clabel set_aspect violinplot set_axis_off spines text hatch plt axis plt.bar() plt.axis import figure pyplot highlight_text pypalettes plt.subplots() xlabel ylabel title legend colorbar savefig tight_layout grid set_xlim set_ylim plot scatter hist boxplot imshow cmap alpha bins tick_params annotate quiver contour barh stackplot subplots_adjust axhline axvline semilogx semilogy loglog polar streamplot hexbin pcolor tricontour errorbar clabel set_aspect violinplot set_axis_off spines text hatch plt axis plt.bar() plt.axis import figure pyplot highlight_text pypalettes plt.subplots() xlabel ylabel title legend colorbar savefig tight_layout grid set_xlim set_ylim plot scatter hist boxplot imshow cmap alpha bins tick_params annotate quiver contour barh stackplot subplots_adjust axhline axvline semilogx semilogy loglog polar streamplot hexbin pcolor tricontour errorbar clabel set_aspect violinplot set_axis_off spines text hatch plt axis plt.bar() plt.axis import figure pyplot highlight_text pypalettes plt.subplots() xlabel ylabel title legend colorbar savefig tight_layout grid set_xlim set_ylim plot scatter hist boxplot imshow cmap alpha bins tick_params annotate quiver contour barh stackplot subplots_adjust axhline axvline semilogx semilogy loglog polar streamplot hexbin pcolor tricontour errorbar clabel set_aspect violinplot set_axis_off spines text hatch plt axis plt.bar() plt.axis import figure pyplot highlight_text pypalettes plt.subplots() xlabel ylabel title legend colorbar savefig tight_layout grid set_xlim set_ylim plot scatter hist boxplot imshow cmap alpha bins tick_params annotate quiver contour barh stackplot subplots_adjust axhline axvline semilogx semilogy loglog polar streamplot hexbin pcolor tricontour errorbar clabel set_aspect violinplot set_axis_off spines text hatch plt axis plt.bar() plt.axis import figure pyplot highlight_text pypalettes plt.subplots() xlabel ylabel title legend colorbar savefig tight_layout grid set_xlim set_ylim plot scatter hist boxplot imshow cmap alpha bins tick_params annotate quiver contour barh stackplot subplots_adjust axhline axvline semilogx semilogy loglog polar streamplot hexbin pcolor tricontour errorbar clabel set_aspect violinplot set_axis_off spines text hatch plt axis plt.bar() plt.axis import figure pyplot highlight_text pypalettes plt.subplots() xlabel ylabel title legend colorbar savefig tight_layout grid set_xlim set_ylim plot scatter hist boxplot imshow cmap alpha bins tick_params annotate quiver contour barh stackplot subplots_adjust axhline axvline semilogx semilogy loglog polar streamplot hexbin pcolor tricontour errorbar clabel set_aspect violinplot set_axis_off spines text hatch plt axis plt.bar() plt.axis import figure pyplot highlight_text pypalettes plt.subplots() xlabel ylabel title legend colorbar savefig tight_layout grid set_xlim set_ylim plot scatter hist boxplot imshow cmap alpha bins tick_params annotate quiver contour barh stackplot subplots_adjust axhline axvline semilogx semilogy loglog polar streamplot hexbin pcolor tricontour errorbar clabel set_aspect violinplot set_axis_off spines text hatch plt axis plt.bar() plt.axis import figure pyplot highlight_text pypalettes plt.subplots() xlabel ylabel title legend colorbar savefig tight_layout grid set_xlim set_ylim plot scatter hist boxplot imshow cmap alpha bins tick_params annotate quiver contour barh stackplot subplots_adjust axhline axvline semilogx semilogy loglog polar streamplot hexbin pcolor tricontour errorbar clabel set_aspect violinplot set_axis_off spines text hatch plt axis plt.bar() plt.axis import figure pyplot highlight_text pypalettes plt.subplots() xlabel ylabel title legend colorbar savefig tight_layout grid set_xlim set_ylim plot scatter hist boxplot imshow cmap alpha bins tick_params annotate quiver contour barh stackplot subplots_adjust axhline axvline semilogx semilogy loglog polar streamplot hexbin pcolor tricontour errorbar clabel set_aspect violinplot set_axis_off spines text hatch plt axis plt.bar() plt.axis import figure pyplot highlight_text pypalettes plt.subplots() xlabel ylabel title legend colorbar savefig tight_layout grid set_xlim set_ylim plot scatter hist boxplot imshow cmap alpha bins tick_params annotate quiver contour barh stackplot subplots_adjust axhline axvline semilogx semilogy loglog polar streamplot hexbin pcolor tricontour errorbar clabel set_aspect violinplot set_axis_off spines text hatch plt axis plt.bar() plt.axis import figure pyplot highlight_text pypalettes plt.subplots() xlabel ylabel title legend colorbar savefig tight_layout grid set_xlim set_ylim plot scatter hist boxplot imshow cmap alpha bins tick_params annotate quiver contour barh stackplot subplots_adjust axhline axvline semilogx semilogy loglog polar streamplot hexbin pcolor tricontour errorbar clabel set_aspect violinplot set_axis_off spines text hatch plt axis plt.bar() plt.axis import figure pyplot highlight_text pypalettes plt.subplots() xlabel ylabel title legend colorbar savefig tight_layout grid set_xlim set_ylim plot scatter hist boxplot imshow cmap alpha bins tick_params annotate quiver contour barh stackplot subplots_adjust axhline axvline semilogx semilogy loglog polar streamplot hexbin pcolor tricontour errorbar clabel set_aspect violinplot set_axis_off spines text hatch plt axis plt.bar() plt.axis import figure pyplot highlight_text pypalettes plt.subplots() xlabel ylabel title legend colorbar savefig tight_layout grid set_xlim set_ylim plot scatter hist boxplot imshow cmap alpha bins tick_params annotate quiver contour barh stackplot subplots_adjust axhline axvline semilogx semilogy loglog polar streamplot hexbin pcolor tricontour errorbar clabel set_aspect violinplot set_axis_off spines text hatch plt axis plt.bar() plt.axis import figure pyplot highlight_text pypalettes plt.subplots() xlabel ylabel title legend colorbar savefig tight_layout grid set_xlim set_ylim plot scatter hist boxplot imshow cmap alpha bins tick_params annotate quiver contour barh stackplot subplots_adjust axhline axvline semilogx semilogy loglog polar streamplot hexbin pcolor tricontour errorbar clabel set_aspect violinplot set_axis_off spines text hatch plt axis plt.bar() plt.axis import figure pyplot highlight_text pypalettes plt.subplots() xlabel ylabel title legend colorbar savefig tight_layout grid set_xlim set_ylim plot scatter hist boxplot imshow cmap alpha bins tick_params annotate quiver contour barh stackplot subplots_adjust axhline axvline semilogx semilogy loglog polar streamplot hexbin pcolor tricontour errorbar clabel set_aspect violinplot set_axis_off spines text hatch plt axis plt.bar() plt.axis import figure pyplot highlight_text pypalettes plt.subplots() xlabel ylabel title legend colorbar savefig tight_layout grid set_xlim set_ylim plot scatter hist boxplot imshow cmap alpha bins tick_params annotate quiver contour barh stackplot subplots_adjust axhline axvline semilogx semilogy loglog polar streamplot hexbin pcolor tricontour errorbar clabel set_aspect violinplot set_axis_off spines text hatch plt axis plt.bar() plt.axis import figure pyplot highlight_text pypalettes plt.subplots() xlabel ylabel title legend colorbar savefig tight_layout grid set_xlim set_ylim plot scatter hist boxplot imshow cmap alpha bins tick_params annotate quiver contour barh stackplot subplots_adjust axhline axvline semilogx semilogy loglog polar streamplot hexbin pcolor tricontour errorbar clabel set_aspect violinplot set_axis_off spines text hatch plt axis plt.bar() plt.axis import figure pyplot highlight_text pypalettes plt.subplots() xlabel ylabel title legend colorbar savefig tight_layout grid set_xlim set_ylim plot scatter hist boxplot imshow cmap alpha bins tick_params annotate quiver contour barh stackplot subplots_adjust axhline axvline semilogx semilogy loglog polar streamplot hexbin pcolor tricontour errorbar clabel set_aspect violinplot set_axis_off spines text hatch plt axis plt.bar() plt.axis import figure pyplot highlight_text pypalettes plt.subplots() xlabel ylabel title legend colorbar savefig tight_layout grid set_xlim set_ylim plot scatter hist boxplot imshow cmap alpha bins tick_params annotate quiver contour barh stackplot subplots_adjust axhline axvline semilogx semilogy loglog polar streamplot hexbin pcolor tricontour errorbar clabel set_aspect violinplot set_axis_off spines text hatch plt axis plt.bar() plt.axis import figure pyplot highlight_text pypalettes plt.subplots() xlabel ylabel title legend colorbar savefig tight_layout grid set_xlim set_ylim plot scatter hist boxplot imshow cmap alpha bins tick_params annotate quiver contour barh stackplot subplots_adjust axhline axvline semilogx semilogy loglog polar streamplot hexbin pcolor tricontour errorbar clabel set_aspect violinplot set_axis_off spines text hatch plt axis plt.bar() plt.axis import figure pyplot highlight_text pypalettes plt.subplots() xlabel ylabel title legend colorbar savefig tight_layout grid set_xlim set_ylim plot scatter hist boxplot imshow cmap alpha bins tick_params annotate quiver contour barh stackplot subplots_adjust axhline axvline semilogx semilogy loglog polar streamplot hexbin pcolor tricontour errorbar clabel set_aspect violinplot set_axis_off spines text hatch plt axis plt.bar() plt.axis import figure pyplot highlight_text pypalettes plt.subplots() xlabel ylabel title legend colorbar savefig tight_layout grid set_xlim set_ylim plot scatter hist boxplot imshow cmap alpha bins tick_params annotate quiver contour barh stackplot subplots_adjust axhline axvline semilogx semilogy loglog polar streamplot hexbin pcolor tricontour errorbar clabel set_aspect violinplot set_axis_off spines text hatch plt axis plt.bar() plt.axis import figure pyplot highlight_text pypalettes plt.subplots() xlabel ylabel title legend colorbar savefig tight_layout grid set_xlim set_ylim plot scatter hist boxplot imshow cmap alpha bins tick_params annotate quiver contour barh stackplot subplots_adjust axhline axvline semilogx semilogy loglog polar streamplot hexbin pcolor tricontour errorbar clabel set_aspect violinplot set_axis_off spines text hatch plt axis plt.bar() plt.axis import figure pyplot highlight_text pypalettes plt.subplots() xlabel ylabel title legend colorbar savefig tight_layout grid set_xlim set_ylim plot scatter hist boxplot imshow cmap alpha bins tick_params annotate quiver contour barh stackplot subplots_adjust axhline axvline semilogx semilogy loglog polar streamplot hexbin pcolor tricontour errorbar clabel set_aspect violinplot set_axis_off spines text hatch plt axis plt.bar() plt.axis import figure pyplot highlight_text pypalettes plt.subplots() xlabel ylabel title legend colorbar savefig tight_layout grid set_xlim set_ylim plot scatter hist boxplot imshow cmap alpha bins tick_params annotate quiver contour barh stackplot subplots_adjust axhline axvline semilogx semilogy loglog polar streamplot hexbin pcolor tricontour errorbar clabel set_aspect violinplot set_axis_off spines text hatch plt axis plt.bar() plt.axis import figure pyplot highlight_text pypalettes plt.subplots() xlabel ylabel title legend colorbar savefig tight_layout grid set_xlim set_ylim plot scatter hist boxplot imshow cmap alpha bins tick_params annotate quiver contour barh stackplot subplots_adjust axhline axvline semilogx semilogy loglog polar streamplot hexbin pcolor tricontour errorbar clabel set_aspect violinplot set_axis_off spines text hatch plt axis plt.bar() plt.axis import figure pyplot highlight_text pypalettes plt.subplots() xlabel ylabel title legend colorbar savefig tight_layout grid set_xlim set_ylim plot scatter hist boxplot imshow cmap alpha bins tick_params annotate quiver contour barh stackplot subplots_adjust axhline axvline semilogx semilogy loglog polar streamplot hexbin pcolor tricontour errorbar clabel set_aspect violinplot set_axis_off spines text hatch plt axis plt.bar() plt.axis import figure pyplot highlight_text pypalettes plt.subplots() xlabel ylabel title legend colorbar savefig tight_layout grid set_xlim set_ylim plot scatter hist boxplot imshow cmap alpha bins tick_params annotate quiver contour barh stackplot subplots_adjust axhline axvline semilogx semilogy loglog polar streamplot hexbin pcolor tricontour errorbar clabel set_aspect violinplot set_axis_off spines text hatch plt axis plt.bar() plt.axis import figure pyplot highlight_text pypalettes plt.subplots() xlabel ylabel title legend colorbar savefig tight_layout grid set_xlim set_ylim plot scatter hist boxplot imshow cmap alpha bins tick_params annotate quiver contour barh stackplot subplots_adjust axhline axvline semilogx semilogy loglog polar streamplot hexbin pcolor tricontour errorbar clabel set_aspect violinplot set_axis_off spines text hatch plt axis plt.bar() plt.axis import figure pyplot highlight_text pypalettes plt.subplots() xlabel ylabel title legend colorbar savefig tight_layout grid set_xlim set_ylim plot scatter hist boxplot imshow cmap alpha bins tick_params annotate quiver contour barh stackplot subplots_adjust axhline axvline semilogx semilogy loglog polar streamplot hexbin pcolor tricontour errorbar clabel set_aspect violinplot set_axis_off spines text hatch plt axis plt.bar() plt.axis import figure pyplot highlight_text pypalettes plt.subplots() xlabel ylabel title legend colorbar savefig tight_layout grid set_xlim set_ylim plot scatter hist boxplot imshow cmap alpha bins tick_params annotate quiver contour barh stackplot subplots_adjust axhline axvline semilogx semilogy loglog polar streamplot hexbin pcolor tricontour errorbar clabel set_aspect violinplot set_axis_off spines text hatch plt axis plt.bar() plt.axis import figure pyplot highlight_text pypalettes plt.subplots() xlabel ylabel title legend colorbar savefig tight_layout grid set_xlim set_ylim plot scatter hist boxplot imshow cmap alpha bins tick_params annotate quiver contour barh stackplot subplots_adjust axhline axvline semilogx semilogy loglog polar streamplot hexbin pcolor tricontour errorbar clabel set_aspect violinplot set_axis_off spines text hatch plt axis plt.bar() plt.axis import figure pyplot highlight_text pypalettes plt.subplots() xlabel ylabel title legend colorbar savefig tight_layout grid set_xlim set_ylim plot scatter hist boxplot imshow cmap alpha bins tick_params annotate quiver contour barh stackplot subplots_adjust axhline axvline semilogx semilogy loglog polar streamplot hexbin pcolor tricontour errorbar clabel set_aspect violinplot set_axis_off spines text hatch plt axis plt.bar() plt.axis import figure pyplot highlight_text pypalettes plt.subplots() xlabel ylabel title legend colorbar savefig tight_layout grid set_xlim set_ylim plot scatter hist boxplot imshow cmap alpha bins tick_params annotate quiver contour barh stackplot subplots_adjust axhline axvline semilogx semilogy loglog polar streamplot hexbin pcolor tricontour errorbar clabel set_aspect violinplot set_axis_off spines text hatch plt axis plt.bar() plt.axis import figure pyplot highlight_text pypalettes plt.subplots() xlabel ylabel title legend colorbar savefig tight_layout grid set_xlim set_ylim plot scatter hist boxplot imshow cmap alpha bins tick_params annotate quiver contour barh stackplot subplots_adjust axhline axvline semilogx semilogy loglog polar streamplot hexbin pcolor tricontour errorbar clabel set_aspect violinplot set_axis_off spines text hatch plt axis plt.bar() plt.axis import figure pyplot highlight_text pypalettes plt.subplots() xlabel ylabel title legend colorbar savefig tight_layout grid set_xlim set_ylim plot scatter hist boxplot imshow cmap alpha bins tick_params annotate quiver contour barh stackplot subplots_adjust axhline axvline semilogx semilogy loglog polar streamplot hexbin pcolor tricontour errorbar clabel set_aspect violinplot set_axis_off spines text hatch plt axis plt.bar() plt.axis import figure pyplot highlight_text pypalettes plt.subplots() xlabel ylabel title legend colorbar savefig tight_layout grid set_xlim set_ylim plot scatter hist boxplot imshow cmap alpha bins tick_params annotate quiver contour barh stackplot subplots_adjust axhline axvline semilogx semilogy loglog polar streamplot hexbin pcolor tricontour errorbar clabel set_aspect violinplot set_axis_off spines text hatch plt axis plt.bar() plt.axis import figure pyplot highlight_text pypalettes plt.subplots() xlabel ylabel title legend colorbar savefig tight_layout grid set_xlim set_ylim plot scatter hist boxplot imshow cmap alpha bins tick_params annotate quiver contour barh stackplot subplots_adjust axhline axvline semilogx semilogy loglog polar streamplot hexbin pcolor tricontour errorbar clabel set_aspect violinplot set_axis_off spines text hatch plt axis plt.bar() plt.axis import figure pyplot highlight_text pypalettes plt.subplots() xlabel ylabel title legend colorbar savefig tight_layout grid set_xlim set_ylim plot scatter hist boxplot imshow cmap alpha bins tick_params annotate quiver contour barh stackplot subplots_adjust axhline axvline semilogx semilogy loglog polar streamplot hexbin pcolor tricontour errorbar clabel set_aspect violinplot set_axis_off spines text hatch plt axis plt.bar() plt.axis import figure pyplot highlight_text pypalettes plt.subplots() xlabel ylabel title legend colorbar savefig tight_layout grid set_xlim set_ylim plot scatter hist boxplot imshow cmap alpha bins tick_params annotate quiver contour barh stackplot subplots_adjust axhline axvline semilogx semilogy loglog polar streamplot hexbin pcolor tricontour errorbar clabel set_aspect violinplot set_axis_off spines text hatch plt axis plt.bar() plt.axis import figure pyplot highlight_text pypalettes plt.subplots() xlabel ylabel title legend colorbar savefig tight_layout grid set_xlim set_ylim plot scatter hist boxplot imshow cmap alpha bins tick_params annotate quiver contour barh stackplot subplots_adjust axhline axvline semilogx semilogy loglog polar streamplot hexbin pcolor tricontour errorbar clabel set_aspect violinplot set_axis_off spines text hatch plt axis plt.bar() plt.axis import figure pyplot highlight_text pypalettes plt.subplots() xlabel ylabel title legend colorbar savefig tight_layout grid set_xlim set_ylim plot scatter hist boxplot imshow cmap alpha bins tick_params annotate quiver contour barh stackplot subplots_adjust axhline axvline semilogx semilogy loglog polar streamplot hexbin pcolor tricontour errorbar clabel set_aspect violinplot set_axis_off spines text hatch plt axis plt.bar() plt.axis import figure pyplot highlight_text pypalettes plt.subplots() xlabel ylabel title legend colorbar savefig tight_layout grid set_xlim set_ylim plot scatter hist boxplot imshow cmap alpha bins tick_params annotate quiver contour barh stackplot subplots_adjust axhline axvline semilogx semilogy loglog polar streamplot hexbin pcolor tricontour errorbar clabel set_aspect violinplot set_axis_off spines text hatch plt axis plt.bar() plt.axis import figure pyplot highlight_text pypalettes plt.subplots() xlabel ylabel title legend colorbar savefig tight_layout grid set_xlim set_ylim plot scatter hist boxplot imshow cmap alpha bins tick_params annotate quiver contour barh stackplot subplots_adjust axhline axvline semilogx semilogy loglog polar streamplot hexbin pcolor tricontour errorbar clabel set_aspect violinplot set_axis_off spines text hatch plt axis plt.bar() plt.axis import figure pyplot highlight_text pypalettes plt.subplots() xlabel ylabel title legend colorbar savefig tight_layout grid set_xlim set_ylim plot scatter hist boxplot imshow cmap alpha bins tick_params annotate quiver contour barh stackplot subplots_adjust axhline axvline semilogx semilogy loglog polar streamplot hexbin pcolor tricontour errorbar clabel set_aspect violinplot set_axis_off spines text hatch plt axis plt.bar() plt.axis import figure pyplot highlight_text pypalettes plt.subplots() xlabel ylabel title legend colorbar savefig tight_layout grid set_xlim set_ylim plot scatter hist boxplot imshow cmap alpha bins tick_params annotate quiver contour barh stackplot subplots_adjust axhline axvline semilogx semilogy loglog polar streamplot hexbin pcolor tricontour errorbar clabel set_aspect violinplot set_axis_off spines text hatch plt axis plt.bar() plt.axis import figure pyplot highlight_text pypalettes plt.subplots() xlabel ylabel title legend colorbar savefig tight_layout grid set_xlim set_ylim plot scatter hist boxplot imshow cmap alpha bins tick_params annotate quiver contour barh stackplot subplots_adjust axhline axvline semilogx semilogy loglog polar streamplot hexbin pcolor tricontour errorbar clabel set_aspect violinplot set_axis_off spines text hatch plt axis plt.bar() plt.axis import figure pyplot highlight_text pypalettes plt.subplots() xlabel ylabel title legend colorbar savefig tight_layout grid set_xlim set_ylim plot scatter hist boxplot imshow cmap alpha bins tick_params annotate quiver contour barh stackplot subplots_adjust axhline axvline semilogx semilogy loglog polar streamplot hexbin pcolor tricontour errorbar clabel set_aspect violinplot set_axis_off spines text hatch plt axis plt.bar() plt.axis import figure pyplot highlight_text pypalettes plt.subplots() xlabel ylabel title legend colorbar savefig tight_layout grid set_xlim set_ylim plot scatter hist boxplot imshow cmap alpha bins tick_params annotate quiver contour barh stackplot subplots_adjust axhline axvline semilogx semilogy loglog polar streamplot hexbin pcolor tricontour errorbar clabel set_aspect violinplot set_axis_off spines text hatch plt axis plt.bar() plt.axis import figure pyplot highlight_text pypalettes plt.subplots() xlabel ylabel title legend colorbar savefig tight_layout grid set_xlim set_ylim plot scatter hist boxplot imshow cmap alpha bins tick_params annotate quiver contour barh stackplot subplots_adjust axhline axvline semilogx semilogy loglog polar streamplot hexbin pcolor tricontour errorbar clabel set_aspect violinplot set_axis_off spines text hatch plt axis plt.bar() plt.axis import figure pyplot highlight_text pypalettes plt.subplots() xlabel ylabel title legend colorbar savefig tight_layout grid set_xlim set_ylim plot scatter hist boxplot imshow cmap alpha bins tick_params annotate quiver contour barh stackplot subplots_adjust axhline axvline semilogx semilogy loglog polar streamplot hexbin pcolor tricontour errorbar clabel set_aspect violinplot set_axis_off spines text hatch plt axis plt.bar() plt.axis import figure pyplot highlight_text pypalettes plt.subplots() xlabel ylabel title legend colorbar savefig tight_layout grid set_xlim set_ylim plot scatter hist boxplot imshow cmap alpha bins tick_params annotate quiver contour barh stackplot subplots_adjust axhline axvline semilogx semilogy loglog polar streamplot hexbin pcolor tricontour errorbar clabel set_aspect violinplot set_axis_off spines text hatch plt axis plt.bar() plt.axis import figure pyplot highlight_text pypalettes plt.subplots() xlabel ylabel title legend colorbar savefig tight_layout grid set_xlim set_ylim plot scatter hist boxplot imshow cmap alpha bins tick_params annotate quiver contour barh stackplot subplots_adjust axhline axvline semilogx semilogy loglog polar streamplot hexbin pcolor tricontour errorbar clabel set_aspect violinplot set_axis_off spines text hatch plt axis plt.bar() plt.axis import figure pyplot highlight_text pypalettes plt.subplots() xlabel ylabel title legend colorbar savefig tight_layout grid set_xlim set_ylim plot scatter hist boxplot imshow cmap alpha bins tick_params annotate quiver contour barh stackplot subplots_adjust axhline axvline semilogx semilogy loglog polar streamplot hexbin pcolor tricontour errorbar clabel set_aspect violinplot set_axis_off spines text hatch plt axis plt.bar() plt.axis import figure pyplot highlight_text pypalettes plt.subplots() xlabel ylabel title legend colorbar savefig tight_layout grid set_xlim set_ylim plot scatter hist boxplot imshow cmap alpha bins tick_params annotate quiver contour barh stackplot subplots_adjust axhline axvline semilogx semilogy loglog polar streamplot hexbin pcolor tricontour errorbar clabel set_aspect violinplot set_axis_off spines text hatch plt axis plt.bar() plt.axis import figure pyplot highlight_text pypalettes plt.subplots() xlabel ylabel title legend colorbar savefig tight_layout grid set_xlim set_ylim plot scatter hist boxplot imshow cmap alpha bins tick_params annotate quiver contour barh stackplot subplots_adjust axhline axvline semilogx semilogy loglog polar streamplot hexbin pcolor tricontour errorbar clabel set_aspect violinplot set_axis_off spines text hatch plt axis plt.bar() plt.axis import figure pyplot highlight_text pypalettes plt.subplots() xlabel ylabel title legend colorbar savefig tight_layout grid set_xlim set_ylim plot scatter hist boxplot imshow cmap alpha bins tick_params annotate quiver contour barh stackplot subplots_adjust axhline axvline semilogx semilogy loglog polar streamplot hexbin pcolor tricontour errorbar clabel set_aspect violinplot set_axis_off spines text hatch plt axis plt.bar() plt.axis import figure pyplot highlight_text pypalettes plt.subplots() xlabel ylabel title legend colorbar savefig tight_layout grid set_xlim set_ylim plot scatter hist boxplot imshow cmap alpha bins tick_params annotate quiver contour barh stackplot subplots_adjust axhline axvline semilogx semilogy loglog polar streamplot hexbin pcolor tricontour errorbar clabel set_aspect violinplot set_axis_off spines text hatch plt axis plt.bar() plt.axis import figure pyplot highlight_text pypalettes plt.subplots() xlabel ylabel title legend colorbar savefig tight_layout grid set_xlim set_ylim plot scatter hist boxplot imshow cmap alpha bins tick_params annotate quiver contour barh stackplot subplots_adjust axhline axvline semilogx semilogy loglog polar streamplot hexbin pcolor tricontour errorbar clabel set_aspect violinplot set_axis_off spines text hatch plt axis plt.bar() plt.axis import figure pyplot highlight_text pypalettes plt.subplots() xlabel ylabel title legend colorbar savefig tight_layout grid set_xlim set_ylim plot scatter hist boxplot imshow cmap alpha bins tick_params annotate quiver contour barh stackplot subplots_adjust axhline axvline semilogx semilogy loglog polar streamplot hexbin pcolor tricontour errorbar clabel set_aspect violinplot set_axis_off spines text hatch plt axis plt.bar() plt.axis import figure pyplot highlight_text pypalettes plt.subplots() xlabel ylabel title legend colorbar savefig tight_layout grid set_xlim set_ylim plot scatter hist boxplot imshow cmap alpha bins tick_params annotate quiver contour barh stackplot subplots_adjust axhline axvline semilogx semilogy loglog polar streamplot hexbin pcolor tricontour errorbar clabel set_aspect violinplot set_axis_off spines text hatch plt axis plt.bar() plt.axis import figure pyplot highlight_text pypalettes plt.subplots() xlabel ylabel title legend colorbar savefig tight_layout grid set_xlim set_ylim plot scatter hist boxplot imshow cmap alpha bins tick_params annotate quiver contour barh stackplot subplots_adjust axhline axvline semilogx semilogy loglog polar streamplot hexbin pcolor tricontour errorbar clabel set_aspect violinplot set_axis_off spines text hatch plt axis plt.bar() plt.axis import figure pyplot highlight_text pypalettes plt.subplots() xlabel ylabel title legend colorbar savefig tight_layout grid set_xlim set_ylim plot scatter hist boxplot imshow cmap alpha bins tick_params annotate quiver contour barh stackplot subplots_adjust axhline axvline semilogx semilogy loglog polar streamplot hexbin pcolor tricontour errorbar clabel set_aspect violinplot set_axis_off spines text hatch plt axis plt.bar() plt.axis import figure pyplot highlight_text pypalettes plt.subplots() xlabel ylabel title legend colorbar savefig tight_layout grid set_xlim set_ylim plot scatter hist boxplot imshow cmap alpha bins tick_params annotate quiver contour barh stackplot subplots_adjust axhline axvline semilogx semilogy loglog polar streamplot hexbin pcolor tricontour errorbar clabel set_aspect violinplot set_axis_off spines text hatch plt axis plt.bar() plt.axis import figure pyplot highlight_text pypalettes plt.subplots() xlabel ylabel title legend colorbar savefig tight_layout grid set_xlim set_ylim plot scatter hist boxplot imshow cmap alpha bins tick_params annotate quiver contour barh stackplot subplots_adjust axhline axvline semilogx semilogy loglog polar streamplot hexbin pcolor tricontour errorbar clabel set_aspect violinplot set_axis_off spines text hatch plt axis plt.bar() plt.axis import figure pyplot highlight_text pypalettes plt.subplots() xlabel ylabel title legend colorbar savefig tight_layout grid set_xlim set_ylim plot scatter hist boxplot imshow cmap alpha bins tick_params annotate quiver contour barh stackplot subplots_adjust axhline axvline semilogx semilogy loglog polar streamplot hexbin pcolor tricontour errorbar clabel set_aspect violinplot set_axis_off spines text hatch plt axis plt.bar() plt.axis import figure pyplot highlight_text pypalettes plt.subplots() xlabel ylabel title legend colorbar savefig tight_layout grid set_xlim set_ylim plot scatter hist boxplot imshow cmap alpha bins tick_params annotate quiver contour barh stackplot subplots_adjust axhline axvline semilogx semilogy loglog polar streamplot hexbin pcolor tricontour errorbar clabel set_aspect violinplot set_axis_off spines text hatch plt axis plt.bar() plt.axis import figure pyplot highlight_text pypalettes plt.subplots() xlabel ylabel title legend colorbar savefig tight_layout grid set_xlim set_ylim plot scatter hist boxplot imshow cmap alpha bins tick_params annotate quiver contour barh stackplot subplots_adjust axhline axvline semilogx semilogy loglog polar streamplot hexbin pcolor tricontour errorbar clabel set_aspect violinplot set_axis_off spines text hatch plt axis plt.bar() plt.axis import figure pyplot highlight_text pypalettes plt.subplots() xlabel ylabel title legend colorbar savefig tight_layout grid set_xlim set_ylim plot scatter hist boxplot imshow cmap alpha bins tick_params annotate quiver contour barh stackplot subplots_adjust axhline axvline semilogx semilogy loglog polar streamplot hexbin pcolor tricontour errorbar clabel set_aspect violinplot set_axis_off spines text hatch plt axis plt.bar() plt.axis import figure pyplot highlight_text pypalettes plt.subplots() xlabel ylabel title legend colorbar savefig tight_layout grid set_xlim set_ylim plot scatter hist boxplot imshow cmap alpha bins tick_params annotate quiver contour barh stackplot subplots_adjust axhline axvline semilogx semilogy loglog polar streamplot hexbin pcolor tricontour errorbar clabel set_aspect violinplot set_axis_off spines text hatch plt axis plt.bar() plt.axis import figure pyplot highlight_text pypalettes plt.subplots() xlabel ylabel title legend colorbar savefig tight_layout grid set_xlim set_ylim plot scatter hist boxplot imshow cmap alpha bins tick_params annotate quiver contour barh stackplot subplots_adjust axhline axvline semilogx semilogy loglog polar streamplot hexbin pcolor tricontour errorbar clabel set_aspect violinplot set_axis_off spines text hatch plt axis plt.bar() plt.axis import figure pyplot highlight_text pypalettes plt.subplots() xlabel ylabel title legend colorbar savefig tight_layout grid set_xlim set_ylim plot scatter hist boxplot imshow cmap alpha bins tick_params annotate quiver contour barh stackplot subplots_adjust axhline axvline semilogx semilogy loglog polar streamplot hexbin pcolor tricontour errorbar clabel set_aspect violinplot set_axis_off spines text hatch plt axis plt.bar() plt.axis import figure pyplot highlight_text pypalettes plt.subplots() xlabel ylabel title legend colorbar savefig tight_layout grid set_xlim set_ylim plot scatter hist boxplot imshow cmap alpha bins tick_params annotate quiver contour barh stackplot subplots_adjust axhline axvline semilogx semilogy loglog polar streamplot hexbin pcolor tricontour errorbar clabel set_aspect violinplot set_axis_off spines text hatch plt axis plt.bar() plt.axis import figure pyplot highlight_text pypalettes plt.subplots() xlabel ylabel title legend colorbar savefig tight_layout grid set_xlim set_ylim plot scatter hist boxplot imshow cmap alpha bins tick_params annotate quiver contour barh stackplot subplots_adjust axhline axvline semilogx semilogy loglog polar streamplot hexbin pcolor tricontour errorbar clabel set_aspect violinplot set_axis_off spines text hatch plt axis plt.bar() plt.axis import figure pyplot highlight_text pypalettes plt.subplots() xlabel ylabel title legend colorbar savefig tight_layout grid set_xlim set_ylim plot scatter hist boxplot imshow cmap alpha bins tick_params annotate quiver contour barh stackplot subplots_adjust axhline axvline semilogx semilogy loglog polar streamplot hexbin pcolor tricontour errorbar clabel set_aspect violinplot set_axis_off spines text hatch plt axis plt.bar() plt.axis import figure pyplot highlight_text pypalettes plt.subplots() xlabel ylabel title legend colorbar savefig tight_layout grid set_xlim set_ylim plot scatter hist boxplot imshow cmap alpha bins tick_params annotate quiver contour barh stackplot subplots_adjust axhline axvline semilogx semilogy loglog polar streamplot hexbin pcolor tricontour errorbar clabel set_aspect violinplot set_axis_off spines text hatch plt axis plt.bar() plt.axis import figure pyplot highlight_text pypalettes plt.subplots() xlabel ylabel title legend colorbar savefig tight_layout grid set_xlim set_ylim plot scatter hist boxplot imshow cmap alpha bins tick_params annotate quiver contour barh stackplot subplots_adjust axhline axvline semilogx semilogy loglog polar streamplot hexbin pcolor tricontour errorbar clabel set_aspect violinplot set_axis_off spines text hatch plt axis plt.bar() plt.axis import figure pyplot highlight_text pypalettes plt.subplots() xlabel ylabel title legend colorbar savefig tight_layout grid set_xlim set_ylim plot scatter hist boxplot imshow cmap alpha bins tick_params annotate quiver contour barh stackplot subplots_adjust axhline axvline semilogx semilogy loglog polar streamplot hexbin pcolor tricontour errorbar clabel set_aspect violinplot set_axis_off spines text hatch plt axis plt.bar() plt.axis import figure pyplot highlight_text pypalettes plt.subplots() xlabel ylabel title legend colorbar savefig tight_layout grid set_xlim set_ylim plot scatter hist boxplot imshow cmap alpha bins tick_params annotate quiver contour barh stackplot subplots_adjust axhline axvline semilogx semilogy loglog polar streamplot hexbin pcolor tricontour errorbar clabel set_aspect violinplot set_axis_off spines text hatch plt axis plt.bar() plt.axis import figure pyplot highlight_text pypalettes plt.subplots() xlabel ylabel title legend colorbar savefig tight_layout grid set_xlim set_ylim plot scatter hist boxplot imshow cmap alpha bins tick_params annotate quiver contour barh stackplot subplots_adjust axhline axvline semilogx semilogy loglog polar streamplot hexbin pcolor tricontour errorbar clabel set_aspect violinplot set_axis_off spines text hatch plt axis plt.bar() plt.axis import figure pyplot highlight_text pypalettes plt.subplots() xlabel ylabel title legend colorbar savefig tight_layout grid set_xlim set_ylim plot scatter hist boxplot imshow cmap alpha bins tick_params annotate quiver contour barh stackplot subplots_adjust axhline axvline semilogx semilogy loglog polar streamplot hexbin pcolor tricontour errorbar clabel set_aspect violinplot set_axis_off spines text hatch plt axis plt.bar() plt.axis import figure pyplot highlight_text pypalettes plt.subplots() xlabel ylabel title legend colorbar savefig tight_layout grid set_xlim set_ylim plot scatter hist boxplot imshow cmap alpha bins tick_params annotate quiver contour barh stackplot subplots_adjust axhline axvline semilogx semilogy loglog polar streamplot hexbin pcolor tricontour errorbar clabel set_aspect violinplot set_axis_off spines text hatch plt axis plt.bar() plt.axis import figure pyplot highlight_text pypalettes plt.subplots() xlabel ylabel title legend colorbar savefig tight_layout grid set_xlim set_ylim plot scatter hist boxplot imshow cmap alpha bins tick_params annotate quiver contour barh stackplot subplots_adjust axhline axvline semilogx semilogy loglog polar streamplot hexbin pcolor tricontour errorbar clabel set_aspect violinplot set_axis_off spines text hatch plt axis plt.bar() plt.axis import figure pyplot highlight_text pypalettes plt.subplots() xlabel ylabel title legend colorbar savefig tight_layout grid set_xlim set_ylim plot scatter hist boxplot imshow cmap alpha bins tick_params annotate quiver contour barh stackplot subplots_adjust axhline axvline semilogx semilogy loglog polar streamplot hexbin pcolor tricontour errorbar clabel set_aspect violinplot set_axis_off spines text hatch plt axis plt.bar() plt.axis import figure pyplot highlight_text pypalettes plt.subplots() xlabel ylabel title legend colorbar savefig tight_layout grid set_xlim set_ylim plot scatter hist boxplot imshow cmap alpha bins tick_params annotate quiver contour barh stackplot subplots_adjust axhline axvline semilogx semilogy loglog polar streamplot hexbin pcolor tricontour errorbar clabel set_aspect violinplot set_axis_off spines text hatch plt axis plt.bar() plt.axis import figure pyplot highlight_text pypalettes plt.subplots() xlabel ylabel title legend colorbar savefig tight_layout grid set_xlim set_ylim plot scatter hist boxplot imshow cmap alpha bins tick_params annotate quiver contour barh stackplot subplots_adjust axhline axvline semilogx semilogy loglog polar streamplot hexbin pcolor tricontour errorbar clabel set_aspect violinplot set_axis_off spines text hatch plt axis plt.bar() plt.axis import figure pyplot highlight_text pypalettes plt.subplots() xlabel ylabel title legend colorbar savefig tight_layout grid set_xlim set_ylim plot scatter hist boxplot imshow cmap alpha bins tick_params annotate quiver contour barh stackplot subplots_adjust axhline axvline semilogx semilogy loglog polar streamplot hexbin pcolor tricontour errorbar clabel set_aspect violinplot set_axis_off spines text hatch plt axis plt.bar() plt.axis import figure pyplot highlight_text pypalettes plt.subplots() xlabel ylabel title legend colorbar savefig tight_layout grid set_xlim set_ylim plot scatter hist boxplot imshow cmap alpha bins tick_params annotate quiver contour barh stackplot subplots_adjust axhline axvline semilogx semilogy loglog polar streamplot hexbin pcolor tricontour errorbar clabel set_aspect violinplot set_axis_off spines text hatch plt axis plt.bar() plt.axis import figure pyplot highlight_text pypalettes plt.subplots() xlabel ylabel title legend colorbar savefig tight_layout grid set_xlim set_ylim plot scatter hist boxplot imshow cmap alpha bins tick_params annotate quiver contour barh stackplot subplots_adjust axhline axvline semilogx semilogy loglog polar streamplot hexbin pcolor tricontour errorbar clabel set_aspect violinplot set_axis_off spines text hatch plt axis plt.bar() plt.axis import figure pyplot highlight_text pypalettes plt.subplots() xlabel ylabel title legend colorbar savefig tight_layout grid set_xlim set_ylim plot scatter hist boxplot imshow cmap alpha bins tick_params annotate quiver contour barh stackplot subplots_adjust axhline axvline semilogx semilogy loglog polar streamplot hexbin pcolor tricontour errorbar clabel set_aspect violinplot set_axis_off spines text hatch plt axis plt.bar() plt.axis import figure pyplot highlight_text pypalettes plt.subplots() xlabel ylabel title legend colorbar savefig tight_layout grid set_xlim set_ylim plot scatter hist boxplot imshow cmap alpha bins tick_params annotate quiver contour barh stackplot subplots_adjust axhline axvline semilogx semilogy loglog polar streamplot hexbin pcolor tricontour errorbar clabel set_aspect violinplot set_axis_off spines text hatch plt axis plt.bar() plt.axis import figure pyplot highlight_text pypalettes plt.subplots() xlabel ylabel title legend colorbar savefig tight_layout grid set_xlim set_ylim plot scatter hist boxplot imshow cmap alpha bins tick_params annotate quiver contour barh stackplot subplots_adjust axhline axvline semilogx semilogy loglog polar streamplot hexbin pcolor tricontour errorbar clabel set_aspect violinplot set_axis_off spines text hatch plt axis plt.bar() plt.axis import figure pyplot highlight_text pypalettes plt.subplots() xlabel ylabel title legend colorbar savefig tight_layout grid set_xlim set_ylim plot scatter hist boxplot imshow cmap alpha bins tick_params annotate quiver contour barh stackplot subplots_adjust axhline axvline semilogx semilogy loglog polar streamplot hexbin pcolor tricontour errorbar clabel set_aspect violinplot set_axis_off spines text hatch plt axis plt.bar() plt.axis import figure pyplot highlight_text pypalettes plt.subplots() xlabel ylabel title legend colorbar savefig tight_layout grid set_xlim set_ylim plot scatter hist boxplot imshow cmap alpha bins tick_params annotate quiver contour barh stackplot subplots_adjust axhline axvline semilogx semilogy loglog polar streamplot hexbin pcolor tricontour errorbar clabel set_aspect violinplot set_axis_off spines text hatch plt axis plt.bar() plt.axis import figure pyplot highlight_text pypalettes plt.subplots() xlabel ylabel title legend colorbar savefig tight_layout grid set_xlim set_ylim plot scatter hist boxplot imshow cmap alpha bins tick_params annotate quiver contour barh stackplot subplots_adjust axhline axvline semilogx semilogy loglog polar streamplot hexbin pcolor tricontour errorbar clabel set_aspect violinplot set_axis_off spines text hatch plt axis plt.bar() plt.axis import figure pyplot highlight_text pypalettes plt.subplots() xlabel ylabel title legend colorbar savefig tight_layout grid set_xlim set_ylim plot scatter hist boxplot imshow cmap alpha bins tick_params annotate quiver contour barh stackplot subplots_adjust axhline axvline semilogx semilogy loglog polar streamplot hexbin pcolor tricontour errorbar clabel set_aspect violinplot set_axis_off spines text hatch plt axis plt.bar() plt.axis import figure pyplot highlight_text pypalettes plt.subplots() xlabel ylabel title legend colorbar savefig tight_layout grid set_xlim set_ylim plot scatter hist boxplot imshow cmap alpha bins tick_params annotate quiver contour barh stackplot subplots_adjust axhline axvline semilogx semilogy loglog polar streamplot hexbin pcolor tricontour errorbar clabel set_aspect violinplot set_axis_off spines text hatch plt axis plt.bar() plt.axis import figure pyplot highlight_text pypalettes plt.subplots() xlabel ylabel title legend colorbar savefig tight_layout grid set_xlim set_ylim plot scatter hist boxplot imshow cmap alpha bins tick_params annotate quiver contour barh stackplot subplots_adjust axhline axvline semilogx semilogy loglog polar streamplot hexbin pcolor tricontour errorbar clabel set_aspect violinplot set_axis_off spines text hatch plt axis plt.bar() plt.axis import figure pyplot highlight_text pypalettes plt.subplots() xlabel ylabel title legend colorbar savefig tight_layout grid set_xlim set_ylim plot scatter hist boxplot imshow cmap alpha bins tick_params annotate quiver contour barh stackplot subplots_adjust axhline axvline semilogx semilogy loglog polar streamplot hexbin pcolor tricontour errorbar clabel set_aspect violinplot set_axis_off spines text hatch plt axis plt.bar() plt.axis import figure pyplot highlight_text pypalettes plt.subplots() xlabel ylabel title legend colorbar savefig tight_layout grid set_xlim set_ylim plot scatter hist boxplot imshow cmap alpha bins tick_params annotate quiver contour barh stackplot subplots_adjust axhline axvline semilogx semilogy loglog polar streamplot hexbin pcolor tricontour errorbar clabel set_aspect violinplot set_axis_off spines text hatch plt axis plt.bar() plt.axis import figure pyplot highlight_text pypalettes plt.subplots() xlabel ylabel title legend colorbar savefig tight_layout grid set_xlim set_ylim plot scatter hist boxplot imshow cmap alpha bins tick_params annotate quiver contour barh stackplot subplots_adjust axhline axvline semilogx semilogy loglog polar streamplot hexbin pcolor tricontour errorbar clabel set_aspect violinplot set_axis_off spines text hatch plt axis plt.bar() plt.axis import figure pyplot highlight_text pypalettes plt.subplots() xlabel ylabel title legend colorbar savefig tight_layout grid set_xlim set_ylim plot scatter hist boxplot imshow cmap alpha bins tick_params annotate quiver contour barh stackplot subplots_adjust axhline axvline semilogx semilogy loglog polar streamplot hexbin pcolor tricontour errorbar clabel set_aspect violinplot set_axis_off spines text hatch plt axis plt.bar() plt.axis import figure pyplot highlight_text pypalettes plt.subplots() xlabel ylabel title legend colorbar savefig tight_layout grid set_xlim set_ylim plot scatter hist boxplot imshow cmap alpha bins tick_params annotate quiver contour barh stackplot subplots_adjust axhline axvline semilogx semilogy loglog polar streamplot hexbin pcolor tricontour errorbar clabel set_aspect violinplot set_axis_off spines text hatch plt axis plt.bar() plt.axis import figure pyplot highlight_text pypalettes plt.subplots() xlabel ylabel title legend colorbar savefig tight_layout grid set_xlim set_ylim plot scatter hist boxplot imshow cmap alpha bins tick_params annotate quiver contour barh stackplot subplots_adjust axhline axvline semilogx semilogy loglog polar streamplot hexbin pcolor tricontour errorbar clabel set_aspect violinplot set_axis_off spines text hatch plt axis plt.bar() plt.axis import figure pyplot highlight_text pypalettes plt.subplots() xlabel ylabel title legend colorbar savefig tight_layout grid set_xlim set_ylim plot scatter hist boxplot imshow cmap alpha bins tick_params annotate quiver contour barh stackplot subplots_adjust axhline axvline semilogx semilogy loglog polar streamplot hexbin pcolor tricontour errorbar clabel set_aspect violinplot set_axis_off spines text hatch plt axis plt.bar() plt.axis import figure pyplot highlight_text pypalettes plt.subplots() xlabel ylabel title legend colorbar savefig tight_layout grid set_xlim set_ylim plot scatter hist boxplot imshow cmap alpha bins tick_params annotate quiver contour barh stackplot subplots_adjust axhline axvline semilogx semilogy loglog polar streamplot hexbin pcolor tricontour errorbar clabel set_aspect violinplot set_axis_off spines text hatch plt axis plt.bar() plt.axis import figure pyplot highlight_text pypalettes plt.subplots() xlabel ylabel title legend colorbar savefig tight_layout grid set_xlim set_ylim plot scatter hist boxplot imshow cmap alpha bins tick_params annotate quiver contour barh stackplot subplots_adjust axhline axvline semilogx semilogy loglog polar streamplot hexbin pcolor tricontour errorbar clabel set_aspect violinplot set_axis_off spines text hatch plt axis plt.bar() plt.axis import figure pyplot highlight_text pypalettes plt.subplots() xlabel ylabel title legend colorbar savefig tight_layout grid set_xlim set_ylim plot scatter hist boxplot imshow cmap alpha bins tick_params annotate quiver contour barh stackplot subplots_adjust axhline axvline semilogx semilogy loglog polar streamplot hexbin pcolor tricontour errorbar clabel set_aspect violinplot set_axis_off spines text hatch plt axis plt.bar() plt.axis import figure pyplot highlight_text pypalettes plt.subplots() xlabel ylabel title legend colorbar savefig tight_layout grid set_xlim set_ylim plot scatter hist boxplot imshow cmap alpha bins tick_params annotate quiver contour barh stackplot subplots_adjust axhline axvline semilogx semilogy loglog polar streamplot hexbin pcolor tricontour errorbar clabel set_aspect violinplot set_axis_off spines text hatch plt axis plt.bar() plt.axis import figure pyplot highlight_text pypalettes plt.subplots() xlabel ylabel title legend colorbar savefig tight_layout grid set_xlim set_ylim plot scatter hist boxplot imshow cmap alpha bins tick_params annotate quiver contour barh stackplot subplots_adjust axhline axvline semilogx semilogy loglog polar streamplot hexbin pcolor tricontour errorbar clabel set_aspect violinplot set_axis_off spines text hatch plt axis plt.bar() plt.axis import figure pyplot highlight_text pypalettes plt.subplots() xlabel ylabel title legend colorbar savefig tight_layout grid set_xlim set_ylim plot scatter hist boxplot imshow cmap alpha bins tick_params annotate quiver contour barh stackplot subplots_adjust axhline axvline semilogx semilogy loglog polar streamplot hexbin pcolor tricontour errorbar clabel set_aspect violinplot set_axis_off spines text hatch plt axis plt.bar() plt.axis import figure pyplot highlight_text pypalettes plt.subplots() xlabel ylabel title legend colorbar savefig tight_layout grid set_xlim set_ylim plot scatter hist boxplot imshow cmap alpha bins tick_params annotate quiver contour barh stackplot subplots_adjust axhline axvline semilogx semilogy loglog polar streamplot hexbin pcolor tricontour errorbar clabel set_aspect violinplot set_axis_off spines text hatch plt axis plt.bar() plt.axis import figure pyplot highlight_text pypalettes plt.subplots() xlabel ylabel title legend colorbar savefig tight_layout grid set_xlim set_ylim plot scatter hist boxplot imshow cmap alpha bins tick_params annotate quiver contour barh stackplot subplots_adjust axhline axvline semilogx semilogy loglog polar streamplot hexbin pcolor tricontour errorbar clabel set_aspect violinplot set_axis_off spines text hatch plt axis plt.bar() plt.axis import figure pyplot highlight_text pypalettes plt.subplots() xlabel ylabel title legend colorbar savefig tight_layout grid set_xlim set_ylim plot scatter hist boxplot imshow cmap alpha bins tick_params annotate quiver contour barh stackplot subplots_adjust axhline axvline semilogx semilogy loglog polar streamplot hexbin pcolor tricontour errorbar clabel set_aspect violinplot set_axis_off spines text hatch plt axis plt.bar() plt.axis import figure pyplot highlight_text pypalettes plt.subplots() xlabel ylabel title legend colorbar savefig tight_layout grid set_xlim set_ylim plot scatter hist boxplot imshow cmap alpha bins tick_params annotate quiver contour barh stackplot subplots_adjust axhline axvline semilogx semilogy loglog polar streamplot hexbin pcolor tricontour errorbar clabel set_aspect violinplot set_axis_off spines text hatch plt axis plt.bar() plt.axis import figure pyplot highlight_text pypalettes plt.subplots() xlabel ylabel title legend colorbar savefig tight_layout grid set_xlim set_ylim plot scatter hist boxplot imshow cmap alpha bins tick_params annotate quiver contour barh stackplot subplots_adjust axhline axvline semilogx semilogy loglog polar streamplot hexbin pcolor tricontour errorbar clabel set_aspect violinplot set_axis_off spines text hatch plt axis plt.bar() plt.axis import figure pyplot highlight_text pypalettes plt.subplots() xlabel ylabel title legend colorbar savefig tight_layout grid set_xlim set_ylim plot scatter hist boxplot imshow cmap alpha bins tick_params annotate quiver contour barh stackplot subplots_adjust axhline axvline semilogx semilogy loglog polar streamplot hexbin pcolor tricontour errorbar clabel set_aspect violinplot set_axis_off spines text hatch plt axis plt.bar() plt.axis import figure pyplot highlight_text pypalettes plt.subplots() xlabel ylabel title legend colorbar savefig tight_layout grid set_xlim set_ylim plot scatter hist boxplot imshow cmap alpha bins tick_params annotate quiver contour barh stackplot subplots_adjust axhline axvline semilogx semilogy loglog polar streamplot hexbin pcolor tricontour errorbar clabel set_aspect violinplot set_axis_off spines text hatch plt axis plt.bar() plt.axis import figure pyplot highlight_text pypalettes plt.subplots() xlabel ylabel title legend colorbar savefig tight_layout grid set_xlim set_ylim plot scatter hist boxplot imshow cmap alpha bins tick_params annotate quiver contour barh stackplot subplots_adjust axhline axvline semilogx semilogy loglog polar streamplot hexbin pcolor tricontour errorbar clabel set_aspect violinplot set_axis_off spines text hatch plt axis plt.bar() plt.axis import figure pyplot highlight_text pypalettes plt.subplots() xlabel ylabel title legend colorbar savefig tight_layout grid set_xlim set_ylim plot scatter hist boxplot imshow cmap alpha bins tick_params annotate quiver contour barh stackplot subplots_adjust axhline axvline semilogx semilogy loglog polar streamplot hexbin pcolor tricontour errorbar clabel set_aspect violinplot set_axis_off spines text hatch plt axis plt.bar() plt.axis import figure pyplot highlight_text pypalettes plt.subplots() xlabel ylabel title legend colorbar savefig tight_layout grid set_xlim set_ylim plot scatter hist boxplot imshow cmap alpha bins tick_params annotate quiver contour barh stackplot subplots_adjust axhline axvline semilogx semilogy loglog polar streamplot hexbin pcolor tricontour errorbar clabel set_aspect violinplot set_axis_off spines text hatch plt axis plt.bar() plt.axis import figure pyplot highlight_text pypalettes plt.subplots() xlabel ylabel title legend colorbar savefig tight_layout grid set_xlim set_ylim plot scatter hist boxplot imshow cmap alpha bins tick_params annotate quiver contour barh stackplot subplots_adjust axhline axvline semilogx semilogy loglog polar streamplot hexbin pcolor tricontour errorbar clabel set_aspect violinplot set_axis_off spines text hatch plt axis plt.bar() plt.axis import figure pyplot highlight_text pypalettes plt.subplots() xlabel ylabel title legend colorbar savefig tight_layout grid set_xlim set_ylim plot scatter hist boxplot imshow cmap alpha bins tick_params annotate quiver contour barh stackplot subplots_adjust axhline axvline semilogx semilogy loglog polar streamplot hexbin pcolor tricontour errorbar clabel set_aspect violinplot set_axis_off spines text hatch plt axis plt.bar() plt.axis import figure pyplot highlight_text pypalettes plt.subplots() xlabel ylabel title legend colorbar savefig tight_layout grid set_xlim set_ylim plot scatter hist boxplot imshow cmap alpha bins tick_params annotate quiver contour barh stackplot subplots_adjust axhline axvline semilogx semilogy loglog polar streamplot hexbin pcolor tricontour errorbar clabel set_aspect violinplot set_axis_off spines text hatch plt axis plt.bar() plt.axis import figure pyplot highlight_text pypalettes plt.subplots() xlabel ylabel title legend colorbar savefig tight_layout grid set_xlim set_ylim plot scatter hist boxplot imshow cmap alpha bins tick_params annotate quiver contour barh stackplot subplots_adjust axhline axvline semilogx semilogy loglog polar streamplot hexbin pcolor tricontour errorbar clabel set_aspect violinplot set_axis_off spines text hatch plt axis plt.bar() plt.axis import figure pyplot highlight_text pypalettes plt.subplots() xlabel ylabel title legend colorbar savefig tight_layout grid set_xlim set_ylim plot scatter hist boxplot imshow cmap alpha bins tick_params annotate quiver contour barh stackplot subplots_adjust axhline axvline semilogx semilogy loglog polar streamplot hexbin pcolor tricontour errorbar clabel set_aspect violinplot set_axis_off spines text hatch plt axis plt.bar() plt.axis import figure pyplot highlight_text pypalettes plt.subplots() xlabel ylabel title legend colorbar savefig tight_layout grid set_xlim set_ylim plot scatter hist boxplot imshow cmap alpha bins tick_params annotate quiver contour barh stackplot subplots_adjust axhline axvline semilogx semilogy loglog polar streamplot hexbin pcolor tricontour errorbar clabel set_aspect violinplot set_axis_off spines text hatch plt axis plt.bar() plt.axis import figure pyplot highlight_text pypalettes plt.subplots() xlabel ylabel title legend colorbar savefig tight_layout grid set_xlim set_ylim plot scatter hist boxplot imshow cmap alpha bins tick_params annotate quiver contour barh stackplot subplots_adjust axhline axvline semilogx semilogy loglog polar streamplot hexbin pcolor tricontour errorbar clabel set_aspect violinplot set_axis_off spines text hatch plt axis plt.bar() plt.axis import figure pyplot highlight_text pypalettes plt.subplots() xlabel ylabel title legend colorbar savefig tight_layout grid set_xlim set_ylim plot scatter hist boxplot imshow cmap alpha bins tick_params annotate quiver contour barh stackplot subplots_adjust axhline axvline semilogx semilogy loglog polar streamplot hexbin pcolor tricontour errorbar clabel set_aspect violinplot set_axis_off spines text hatch plt axis plt.bar() plt.axis import figure pyplot highlight_text pypalettes plt.subplots() xlabel ylabel title legend colorbar savefig tight_layout grid set_xlim set_ylim plot scatter hist boxplot imshow cmap alpha bins tick_params annotate quiver contour barh stackplot subplots_adjust axhline axvline semilogx semilogy loglog polar streamplot hexbin pcolor tricontour errorbar clabel set_aspect violinplot set_axis_off spines text hatch plt axis plt.bar() plt.axis import figure pyplot highlight_text pypalettes plt.subplots() xlabel ylabel title legend colorbar savefig tight_layout grid set_xlim set_ylim plot scatter hist boxplot imshow cmap alpha bins tick_params annotate quiver contour barh stackplot subplots_adjust axhline axvline semilogx semilogy loglog polar streamplot hexbin pcolor tricontour errorbar clabel set_aspect violinplot set_axis_off spines text hatch plt axis plt.bar() plt.axis import figure pyplot highlight_text pypalettes plt.subplots() xlabel ylabel title legend colorbar savefig tight_layout grid set_xlim set_ylim plot scatter hist boxplot imshow cmap alpha bins tick_params annotate quiver contour barh stackplot subplots_adjust axhline axvline semilogx semilogy loglog polar streamplot hexbin pcolor tricontour errorbar clabel set_aspect violinplot set_axis_off spines text hatch plt axis plt.bar() plt.axis import figure pyplot highlight_text pypalettes plt.subplots() xlabel ylabel title legend colorbar savefig tight_layout grid set_xlim set_ylim plot scatter hist boxplot imshow cmap alpha bins tick_params annotate quiver contour barh stackplot subplots_adjust axhline axvline semilogx semilogy loglog polar streamplot hexbin pcolor tricontour errorbar clabel set_aspect violinplot set_axis_off spines text hatch plt axis plt.bar() plt.axis import figure pyplot highlight_text pypalettes plt.subplots() xlabel ylabel title legend colorbar savefig tight_layout grid set_xlim set_ylim plot scatter hist boxplot imshow cmap alpha bins tick_params annotate quiver contour barh stackplot subplots_adjust axhline axvline semilogx semilogy loglog polar streamplot hexbin pcolor tricontour errorbar clabel set_aspect violinplot set_axis_off spines text hatch plt axis plt.bar() plt.axis import figure pyplot highlight_text pypalettes plt.subplots() xlabel ylabel title legend colorbar savefig tight_layout grid set_xlim set_ylim plot scatter hist boxplot imshow cmap alpha bins tick_params annotate quiver contour barh stackplot subplots_adjust axhline axvline semilogx semilogy loglog polar streamplot hexbin pcolor tricontour errorbar clabel set_aspect violinplot set_axis_off spines text hatch plt axis plt.bar() plt.axis import figure pyplot highlight_text pypalettes plt.subplots() xlabel ylabel title legend colorbar savefig tight_layout grid set_xlim set_ylim plot scatter hist boxplot imshow cmap alpha bins tick_params annotate quiver contour barh stackplot subplots_adjust axhline axvline semilogx semilogy loglog polar streamplot hexbin pcolor tricontour errorbar clabel set_aspect violinplot set_axis_off spines text hatch plt axis plt.bar() plt.axis import figure pyplot highlight_text pypalettes plt.subplots() xlabel ylabel title legend colorbar savefig tight_layout grid set_xlim set_ylim plot scatter hist boxplot imshow cmap alpha bins tick_params annotate quiver contour barh stackplot subplots_adjust axhline axvline semilogx semilogy loglog polar streamplot hexbin pcolor tricontour errorbar clabel set_aspect violinplot set_axis_off spines text hatch plt axis plt.bar() plt.axis import figure pyplot highlight_text pypalettes plt.subplots() xlabel ylabel title legend colorbar savefig tight_layout grid set_xlim set_ylim plot scatter hist boxplot imshow cmap alpha bins tick_params annotate quiver contour barh stackplot subplots_adjust axhline axvline semilogx semilogy loglog polar streamplot hexbin pcolor tricontour errorbar clabel set_aspect violinplot set_axis_off spines text hatch plt axis plt.bar() plt.axis import figure pyplot highlight_text pypalettes plt.subplots() xlabel ylabel title legend colorbar savefig tight_layout grid set_xlim set_ylim plot scatter hist boxplot imshow cmap alpha bins tick_params annotate quiver contour barh stackplot subplots_adjust axhline axvline semilogx semilogy loglog polar streamplot hexbin pcolor tricontour errorbar clabel set_aspect violinplot set_axis_off spines text hatch plt axis plt.bar() plt.axis import figure pyplot highlight_text pypalettes plt.subplots() xlabel ylabel title legend colorbar savefig tight_layout grid set_xlim set_ylim plot scatter hist boxplot imshow cmap alpha bins tick_params annotate quiver contour barh stackplot subplots_adjust axhline axvline semilogx semilogy loglog polar streamplot hexbin pcolor tricontour errorbar clabel set_aspect violinplot set_axis_off spines text hatch plt axis plt.bar() plt.axis import figure pyplot highlight_text pypalettes plt.subplots() xlabel ylabel title legend colorbar savefig tight_layout grid set_xlim set_ylim plot scatter hist boxplot imshow cmap alpha bins tick_params annotate quiver contour barh stackplot subplots_adjust axhline axvline semilogx semilogy loglog polar streamplot hexbin pcolor tricontour errorbar clabel set_aspect violinplot set_axis_off spines text hatch plt axis plt.bar() plt.axis import figure pyplot highlight_text pypalettes plt.subplots() xlabel ylabel title legend colorbar savefig tight_layout grid set_xlim set_ylim plot scatter hist boxplot imshow cmap alpha bins tick_params annotate quiver contour barh stackplot subplots_adjust axhline axvline semilogx semilogy loglog polar streamplot hexbin pcolor tricontour errorbar clabel set_aspect violinplot set_axis_off spines text hatch plt axis plt.bar() plt.axis import figure pyplot highlight_text pypalettes plt.subplots() xlabel ylabel title legend colorbar savefig tight_layout grid set_xlim set_ylim plot scatter hist boxplot imshow cmap alpha bins tick_params annotate quiver contour barh stackplot subplots_adjust axhline axvline semilogx semilogy loglog polar streamplot hexbin pcolor tricontour errorbar clabel set_aspect violinplot set_axis_off spines text hatch plt axis plt.bar() plt.axis import figure pyplot highlight_text pypalettes plt.subplots() xlabel ylabel title legend colorbar savefig tight_layout grid set_xlim set_ylim plot scatter hist boxplot imshow cmap alpha bins tick_params annotate quiver contour barh stackplot subplots_adjust axhline axvline semilogx semilogy loglog polar streamplot hexbin pcolor tricontour errorbar clabel set_aspect violinplot set_axis_off spines text hatch plt axis plt.bar() plt.axis import figure pyplot highlight_text pypalettes plt.subplots() xlabel ylabel title legend colorbar savefig tight_layout grid set_xlim set_ylim plot scatter hist boxplot imshow cmap alpha bins tick_params annotate quiver contour barh stackplot subplots_adjust axhline axvline semilogx semilogy loglog polar streamplot hexbin pcolor tricontour errorbar clabel set_aspect violinplot set_axis_off spines text hatch plt axis plt.bar() plt.axis import figure pyplot highlight_text pypalettes plt.subplots() xlabel ylabel title legend colorbar savefig tight_layout grid set_xlim set_ylim plot scatter hist boxplot imshow cmap alpha bins tick_params annotate quiver contour barh stackplot subplots_adjust axhline axvline semilogx semilogy loglog polar streamplot hexbin pcolor tricontour errorbar clabel set_aspect violinplot set_axis_off spines text hatch plt axis plt.bar() plt.axis import figure pyplot highlight_text pypalettes plt.subplots() xlabel ylabel title legend colorbar savefig tight_layout grid set_xlim set_ylim plot scatter hist boxplot imshow cmap alpha bins tick_params annotate quiver contour barh stackplot subplots_adjust axhline axvline semilogx semilogy loglog polar streamplot hexbin pcolor tricontour errorbar clabel set_aspect violinplot set_axis_off spines text hatch plt axis plt.bar() plt.axis import figure pyplot highlight_text pypalettes plt.subplots() xlabel ylabel title legend colorbar savefig tight_layout grid set_xlim set_ylim plot scatter hist boxplot imshow cmap alpha bins tick_params annotate quiver contour barh stackplot subplots_adjust axhline axvline semilogx semilogy loglog polar streamplot hexbin pcolor tricontour errorbar clabel set_aspect violinplot set_axis_off spines text hatch plt axis plt.bar() plt.axis import figure pyplot highlight_text pypalettes plt.subplots() xlabel ylabel title legend colorbar savefig tight_layout grid set_xlim set_ylim plot scatter hist boxplot imshow cmap alpha bins tick_params annotate quiver contour barh stackplot subplots_adjust axhline axvline semilogx semilogy loglog polar streamplot hexbin pcolor tricontour errorbar clabel set_aspect violinplot set_axis_off spines text hatch plt axis plt.bar() plt.axis import figure pyplot highlight_text pypalettes plt.subplots() xlabel ylabel title legend colorbar savefig tight_layout grid set_xlim set_ylim plot scatter hist boxplot imshow cmap alpha bins tick_params annotate quiver contour barh stackplot subplots_adjust axhline axvline semilogx semilogy loglog polar streamplot hexbin pcolor tricontour errorbar clabel set_aspect violinplot set_axis_off spines text hatch plt axis plt.bar() plt.axis import figure pyplot highlight_text pypalettes plt.subplots() xlabel ylabel title legend colorbar savefig tight_layout grid set_xlim set_ylim plot scatter hist boxplot imshow cmap alpha bins tick_params annotate quiver contour barh stackplot subplots_adjust axhline axvline semilogx semilogy loglog polar streamplot hexbin pcolor tricontour errorbar clabel set_aspect violinplot set_axis_off spines text hatch plt axis plt.bar() plt.axis import figure pyplot highlight_text pypalettes plt.subplots() xlabel ylabel title legend colorbar savefig tight_layout grid set_xlim set_ylim plot scatter hist boxplot imshow cmap alpha bins tick_params annotate quiver contour barh stackplot subplots_adjust axhline axvline semilogx semilogy loglog polar streamplot hexbin pcolor tricontour errorbar clabel set_aspect violinplot set_axis_off spines text hatch plt axis plt.bar() plt.axis import figure pyplot highlight_text pypalettes plt.subplots() xlabel ylabel title legend colorbar savefig tight_layout grid set_xlim set_ylim plot scatter hist boxplot imshow cmap alpha bins tick_params annotate quiver contour barh stackplot subplots_adjust axhline axvline semilogx semilogy loglog polar streamplot hexbin pcolor tricontour errorbar clabel set_aspect violinplot set_axis_off spines text hatch plt axis plt.bar() plt.axis import figure pyplot highlight_text pypalettes plt.subplots() xlabel ylabel title legend colorbar savefig tight_layout grid set_xlim set_ylim plot scatter hist boxplot imshow cmap alpha bins tick_params annotate quiver contour barh stackplot subplots_adjust axhline axvline semilogx semilogy loglog polar streamplot hexbin pcolor tricontour errorbar clabel set_aspect violinplot set_axis_off spines text hatch plt axis plt.bar() plt.axis import figure pyplot highlight_text pypalettes plt.subplots() xlabel ylabel title legend colorbar savefig tight_layout grid set_xlim set_ylim plot scatter hist boxplot imshow cmap alpha bins tick_params annotate quiver contour barh stackplot subplots_adjust axhline axvline semilogx semilogy loglog polar streamplot hexbin pcolor tricontour errorbar clabel set_aspect violinplot set_axis_off spines text hatch plt axis plt.bar() plt.axis import figure pyplot highlight_text pypalettes plt.subplots() xlabel ylabel title legend colorbar savefig tight_layout grid set_xlim set_ylim plot scatter hist boxplot imshow cmap alpha bins tick_params annotate quiver contour barh stackplot subplots_adjust axhline axvline semilogx semilogy loglog polar streamplot hexbin pcolor tricontour errorbar clabel set_aspect violinplot set_axis_off spines text hatch plt axis plt.bar() plt.axis import figure pyplot highlight_text pypalettes plt.subplots() xlabel ylabel title legend colorbar savefig tight_layout grid set_xlim set_ylim plot scatter hist boxplot imshow cmap alpha bins tick_params annotate quiver contour barh stackplot subplots_adjust axhline axvline semilogx semilogy loglog polar streamplot hexbin pcolor tricontour errorbar clabel set_aspect violinplot set_axis_off spines text hatch plt axis plt.bar() plt.axis import figure pyplot highlight_text pypalettes plt.subplots() xlabel ylabel title legend colorbar savefig tight_layout grid set_xlim set_ylim plot scatter hist boxplot imshow cmap alpha bins tick_params annotate quiver contour barh stackplot subplots_adjust axhline axvline semilogx semilogy loglog polar streamplot hexbin pcolor tricontour errorbar clabel set_aspect violinplot set_axis_off spines text hatch plt axis plt.bar() plt.axis import figure pyplot highlight_text pypalettes plt.subplots() xlabel ylabel title legend colorbar savefig tight_layout grid set_xlim set_ylim plot scatter hist boxplot imshow cmap alpha bins tick_params annotate quiver contour barh stackplot subplots_adjust axhline axvline semilogx semilogy loglog polar streamplot hexbin pcolor tricontour errorbar clabel set_aspect violinplot set_axis_off spines text hatch plt axis plt.bar() plt.axis import figure pyplot highlight_text pypalettes plt.subplots() xlabel ylabel title legend colorbar savefig tight_layout grid set_xlim set_ylim plot scatter hist boxplot imshow cmap alpha bins tick_params annotate quiver contour barh stackplot subplots_adjust axhline axvline semilogx semilogy loglog polar streamplot hexbin pcolor tricontour errorbar clabel set_aspect violinplot set_axis_off spines text hatch plt axis plt.bar() plt.axis import figure pyplot highlight_text pypalettes plt.subplots() xlabel ylabel title legend colorbar savefig tight_layout grid set_xlim set_ylim plot scatter hist boxplot imshow cmap alpha bins tick_params annotate quiver contour barh stackplot subplots_adjust axhline axvline semilogx semilogy loglog polar streamplot hexbin pcolor tricontour errorbar clabel set_aspect violinplot set_axis_off spines text hatch plt axis plt.bar() plt.axis import figure pyplot highlight_text pypalettes plt.subplots() xlabel ylabel title legend colorbar savefig tight_layout grid set_xlim set_ylim plot scatter hist boxplot imshow cmap alpha bins tick_params annotate quiver contour barh stackplot subplots_adjust axhline axvline semilogx semilogy loglog polar streamplot hexbin pcolor tricontour errorbar clabel set_aspect violinplot set_axis_off spines text hatch plt axis plt.bar() plt.axis import figure pyplot highlight_text pypalettes plt.subplots() xlabel ylabel title legend colorbar savefig tight_layout grid set_xlim set_ylim plot scatter hist boxplot imshow cmap alpha bins tick_params annotate quiver contour barh stackplot subplots_adjust axhline axvline semilogx semilogy loglog polar streamplot hexbin pcolor tricontour errorbar clabel set_aspect violinplot set_axis_off spines text hatch plt axis plt.bar() plt.axis import figure pyplot highlight_text pypalettes plt.subplots() xlabel ylabel title legend colorbar savefig tight_layout grid set_xlim set_ylim plot scatter hist boxplot imshow cmap alpha bins tick_params annotate quiver contour barh stackplot subplots_adjust axhline axvline semilogx semilogy loglog polar streamplot hexbin pcolor tricontour errorbar clabel set_aspect violinplot set_axis_off spines text hatch plt axis plt.bar() plt.axis import figure pyplot highlight_text pypalettes plt.subplots() xlabel ylabel title legend colorbar savefig tight_layout grid set_xlim set_ylim plot scatter hist boxplot imshow cmap alpha bins tick_params annotate quiver contour barh stackplot subplots_adjust axhline axvline semilogx semilogy loglog polar streamplot hexbin pcolor tricontour errorbar clabel set_aspect violinplot set_axis_off spines text hatch plt axis plt.bar() plt.axis import figure pyplot highlight_text pypalettes plt.subplots() xlabel ylabel title legend colorbar savefig tight_layout grid set_xlim set_ylim plot scatter hist boxplot imshow cmap alpha bins tick_params annotate quiver contour barh stackplot subplots_adjust axhline axvline semilogx semilogy loglog polar streamplot hexbin pcolor tricontour errorbar clabel set_aspect violinplot set_axis_off spines text hatch plt axis plt.bar() plt.axis import figure pyplot highlight_text pypalettes plt.subplots() xlabel ylabel title legend colorbar savefig tight_layout grid set_xlim set_ylim plot scatter hist boxplot imshow cmap alpha bins tick_params annotate quiver contour barh stackplot subplots_adjust axhline axvline semilogx semilogy loglog polar streamplot hexbin pcolor tricontour errorbar clabel set_aspect violinplot set_axis_off spines text hatch plt axis plt.bar() plt.axis import figure pyplot highlight_text pypalettes plt.subplots() xlabel ylabel title legend colorbar savefig tight_layout grid set_xlim set_ylim plot scatter hist boxplot imshow cmap alpha bins tick_params annotate quiver contour barh stackplot subplots_adjust axhline axvline semilogx semilogy loglog polar streamplot hexbin pcolor tricontour errorbar clabel set_aspect violinplot set_axis_off spines text hatch plt axis plt.bar() plt.axis import figure pyplot highlight_text pypalettes plt.subplots() xlabel ylabel title legend colorbar savefig tight_layout grid set_xlim set_ylim plot scatter hist boxplot imshow cmap alpha bins tick_params annotate quiver contour barh stackplot subplots_adjust axhline axvline semilogx semilogy loglog polar streamplot hexbin pcolor tricontour errorbar clabel set_aspect violinplot set_axis_off spines text hatch plt axis plt.bar() plt.axis import figure pyplot highlight_text pypalettes plt.subplots() xlabel ylabel title legend colorbar savefig tight_layout grid set_xlim set_ylim plot scatter hist boxplot imshow cmap alpha bins tick_params annotate quiver contour barh stackplot subplots_adjust axhline axvline semilogx semilogy loglog polar streamplot hexbin pcolor tricontour errorbar clabel set_aspect violinplot set_axis_off spines text hatch plt axis plt.bar() plt.axis import figure pyplot highlight_text pypalettes plt.subplots() xlabel ylabel title legend colorbar savefig tight_layout grid set_xlim set_ylim plot scatter hist boxplot imshow cmap alpha bins tick_params annotate quiver contour barh stackplot subplots_adjust axhline axvline semilogx semilogy loglog polar streamplot hexbin pcolor tricontour errorbar clabel set_aspect violinplot set_axis_off spines text hatch plt axis plt.bar() plt.axis import figure pyplot highlight_text pypalettes plt.subplots() xlabel ylabel title legend colorbar savefig tight_layout grid set_xlim set_ylim plot scatter hist boxplot imshow cmap alpha bins tick_params annotate quiver contour barh stackplot subplots_adjust axhline axvline semilogx semilogy loglog polar streamplot hexbin pcolor tricontour errorbar clabel set_aspect violinplot set_axis_off spines text hatch plt axis plt.bar() plt.axis import figure pyplot highlight_text pypalettes plt.subplots() xlabel ylabel title legend colorbar savefig tight_layout grid set_xlim set_ylim plot scatter hist boxplot imshow cmap alpha bins tick_params annotate quiver contour barh stackplot subplots_adjust axhline axvline semilogx semilogy loglog polar streamplot hexbin pcolor tricontour errorbar clabel set_aspect violinplot set_axis_off spines text hatch plt axis plt.bar() plt.axis import figure pyplot highlight_text pypalettes plt.subplots() xlabel ylabel title legend colorbar savefig tight_layout grid set_xlim set_ylim plot scatter hist boxplot imshow cmap alpha bins tick_params annotate quiver contour barh stackplot subplots_adjust axhline axvline semilogx semilogy loglog polar streamplot hexbin pcolor tricontour errorbar clabel set_aspect violinplot set_axis_off spines text hatch plt axis plt.bar() plt.axis import figure pyplot highlight_text pypalettes plt.subplots() xlabel ylabel title legend colorbar savefig tight_layout grid set_xlim set_ylim plot scatter hist boxplot imshow cmap alpha bins tick_params annotate quiver contour barh stackplot subplots_adjust axhline axvline semilogx semilogy loglog polar streamplot hexbin pcolor tricontour errorbar clabel set_aspect violinplot set_axis_off spines text hatch plt axis plt.bar() plt.axis import figure pyplot highlight_text pypalettes plt.subplots() xlabel ylabel title legend colorbar savefig tight_layout grid set_xlim set_ylim plot scatter hist boxplot imshow cmap alpha bins tick_params annotate quiver contour barh stackplot subplots_adjust axhline axvline semilogx semilogy loglog polar streamplot hexbin pcolor tricontour errorbar clabel set_aspect violinplot set_axis_off spines text hatch plt axis plt.bar() plt.axis import figure pyplot highlight_text pypalettes plt.subplots() xlabel ylabel title legend colorbar savefig tight_layout grid set_xlim set_ylim plot scatter hist boxplot imshow cmap alpha bins tick_params annotate quiver contour barh stackplot subplots_adjust axhline axvline semilogx semilogy loglog polar streamplot hexbin pcolor tricontour errorbar clabel set_aspect violinplot set_axis_off spines text hatch plt axis plt.bar() plt.axis import figure pyplot highlight_text pypalettes plt.subplots() xlabel ylabel title legend colorbar savefig tight_layout grid set_xlim set_ylim plot scatter hist boxplot imshow cmap alpha bins tick_params annotate quiver contour barh stackplot subplots_adjust axhline axvline semilogx semilogy loglog polar streamplot hexbin pcolor tricontour errorbar clabel set_aspect violinplot set_axis_off spines text hatch plt axis plt.bar() plt.axis import figure pyplot highlight_text pypalettes plt.subplots() xlabel ylabel title legend colorbar savefig tight_layout grid set_xlim set_ylim plot scatter hist boxplot imshow cmap alpha bins tick_params annotate quiver contour barh stackplot subplots_adjust axhline axvline semilogx semilogy loglog polar streamplot hexbin pcolor tricontour errorbar clabel set_aspect violinplot set_axis_off spines text hatch plt axis plt.bar() plt.axis import figure pyplot highlight_text pypalettes plt.subplots() xlabel ylabel title legend colorbar savefig tight_layout grid set_xlim set_ylim plot scatter hist boxplot imshow cmap alpha bins tick_params annotate quiver contour barh stackplot subplots_adjust axhline axvline semilogx semilogy loglog polar streamplot hexbin pcolor tricontour errorbar clabel set_aspect violinplot set_axis_off spines text hatch plt axis plt.bar() plt.axis import figure pyplot highlight_text pypalettes plt.subplots() xlabel ylabel title legend colorbar savefig tight_layout grid set_xlim set_ylim plot scatter hist boxplot imshow cmap alpha bins tick_params annotate quiver contour barh stackplot subplots_adjust axhline axvline semilogx semilogy loglog polar streamplot hexbin pcolor tricontour errorbar clabel set_aspect violinplot set_axis_off spines text hatch plt axis plt.bar() plt.axis import figure pyplot highlight_text pypalettes plt.subplots() xlabel ylabel title legend colorbar savefig tight_layout grid set_xlim set_ylim plot scatter hist boxplot imshow cmap alpha bins tick_params annotate quiver contour barh stackplot subplots_adjust axhline axvline semilogx semilogy loglog polar streamplot hexbin pcolor tricontour errorbar clabel set_aspect violinplot set_axis_off spines text hatch plt axis plt.bar() plt.axis import figure pyplot highlight_text pypalettes plt.subplots() xlabel ylabel title legend colorbar savefig tight_layout grid set_xlim set_ylim plot scatter hist boxplot imshow cmap alpha bins tick_params annotate quiver contour barh stackplot subplots_adjust axhline axvline semilogx semilogy loglog polar streamplot hexbin pcolor tricontour errorbar clabel set_aspect violinplot set_axis_off spines text hatch plt axis plt.bar() plt.axis import figure pyplot highlight_text pypalettes plt.subplots() xlabel ylabel title legend colorbar savefig tight_layout grid set_xlim set_ylim plot scatter hist boxplot imshow cmap alpha bins tick_params annotate quiver contour barh stackplot subplots_adjust axhline axvline semilogx semilogy loglog polar streamplot hexbin pcolor tricontour errorbar clabel set_aspect violinplot set_axis_off spines text hatch plt axis plt.bar() plt.axis import figure pyplot highlight_text pypalettes plt.subplots() xlabel ylabel title legend colorbar savefig tight_layout grid set_xlim set_ylim plot scatter hist boxplot imshow cmap alpha bins tick_params annotate quiver contour barh stackplot subplots_adjust axhline axvline semilogx semilogy loglog polar streamplot hexbin pcolor tricontour errorbar clabel set_aspect violinplot set_axis_off spines text hatch plt axis plt.bar() plt.axis import figure pyplot highlight_text pypalettes plt.subplots() xlabel ylabel title legend colorbar savefig tight_layout grid set_xlim set_ylim plot scatter hist boxplot imshow cmap alpha bins tick_params annotate quiver contour barh stackplot subplots_adjust axhline axvline semilogx semilogy loglog polar streamplot hexbin pcolor tricontour errorbar clabel set_aspect violinplot set_axis_off spines text hatch plt axis plt.bar() plt.axis import figure pyplot highlight_text pypalettes plt.subplots() xlabel ylabel title legend colorbar savefig tight_layout grid set_xlim set_ylim plot scatter hist boxplot imshow cmap alpha bins tick_params annotate quiver contour barh stackplot subplots_adjust axhline axvline semilogx semilogy loglog polar streamplot hexbin pcolor tricontour errorbar clabel set_aspect violinplot set_axis_off spines text hatch plt axis plt.bar() plt.axis import figure pyplot highlight_text pypalettes plt.subplots() xlabel ylabel title legend colorbar savefig tight_layout grid set_xlim set_ylim plot scatter hist boxplot imshow cmap alpha bins tick_params annotate quiver contour barh stackplot subplots_adjust axhline axvline semilogx semilogy loglog polar streamplot hexbin pcolor tricontour errorbar clabel set_aspect violinplot set_axis_off spines text hatch plt axis plt.bar() plt.axis import figure pyplot highlight_text pypalettes plt.subplots() xlabel ylabel title legend colorbar savefig tight_layout grid set_xlim set_ylim plot scatter hist boxplot imshow cmap alpha bins tick_params annotate quiver contour barh stackplot subplots_adjust axhline axvline semilogx semilogy loglog polar streamplot hexbin pcolor tricontour errorbar clabel set_aspect violinplot set_axis_off spines text hatch plt axis plt.bar() plt.axis import figure pyplot highlight_text pypalettes plt.subplots() xlabel ylabel title legend colorbar savefig tight_layout grid set_xlim set_ylim plot scatter hist boxplot imshow cmap alpha bins tick_params annotate quiver contour barh stackplot subplots_adjust axhline axvline semilogx semilogy loglog polar streamplot hexbin pcolor tricontour errorbar clabel set_aspect violinplot set_axis_off spines text hatch plt axis plt.bar() plt.axis import figure pyplot highlight_text pypalettes plt.subplots() xlabel ylabel title legend colorbar savefig tight_layout grid set_xlim set_ylim plot scatter hist boxplot imshow cmap alpha bins tick_params annotate quiver contour barh stackplot subplots_adjust axhline axvline semilogx semilogy loglog polar streamplot hexbin pcolor tricontour errorbar clabel set_aspect violinplot set_axis_off spines text hatch plt axis plt.bar() plt.axis import figure pyplot highlight_text pypalettes plt.subplots() xlabel ylabel title legend colorbar savefig tight_layout grid set_xlim set_ylim plot scatter hist boxplot imshow cmap alpha bins tick_params annotate quiver contour barh stackplot subplots_adjust axhline axvline semilogx semilogy loglog polar streamplot hexbin pcolor tricontour errorbar clabel set_aspect violinplot set_axis_off spines text hatch plt axis plt.bar() plt.axis import figure pyplot highlight_text pypalettes plt.subplots() xlabel ylabel title legend colorbar savefig tight_layout grid set_xlim set_ylim plot scatter hist boxplot imshow cmap alpha bins tick_params annotate quiver contour barh stackplot subplots_adjust axhline axvline semilogx semilogy loglog polar streamplot hexbin pcolor tricontour errorbar clabel set_aspect violinplot set_axis_off spines text hatch plt axis plt.bar() plt.axis import figure pyplot highlight_text pypalettes plt.subplots() xlabel ylabel title legend colorbar savefig tight_layout grid set_xlim set_ylim plot scatter hist boxplot imshow cmap alpha bins tick_params annotate quiver contour barh stackplot subplots_adjust axhline axvline semilogx semilogy loglog polar streamplot hexbin pcolor tricontour errorbar clabel set_aspect violinplot set_axis_off spines text hatch plt axis plt.bar() plt.axis import figure pyplot highlight_text pypalettes plt.subplots() xlabel ylabel title legend colorbar savefig tight_layout grid set_xlim set_ylim plot scatter hist boxplot imshow cmap alpha bins tick_params annotate quiver contour barh stackplot subplots_adjust axhline axvline semilogx semilogy loglog polar streamplot hexbin pcolor tricontour errorbar clabel set_aspect violinplot set_axis_off spines text hatch plt axis plt.bar() plt.axis import figure pyplot highlight_text pypalettes plt.subplots() xlabel ylabel title legend colorbar savefig tight_layout grid set_xlim set_ylim plot scatter hist boxplot imshow cmap alpha bins tick_params annotate quiver contour barh stackplot subplots_adjust axhline axvline semilogx semilogy loglog polar streamplot hexbin pcolor tricontour errorbar clabel set_aspect violinplot set_axis_off spines text hatch plt axis plt.bar() plt.axis import figure pyplot highlight_text pypalettes plt.subplots() xlabel ylabel title legend colorbar savefig tight_layout grid set_xlim set_ylim plot scatter hist boxplot imshow cmap alpha bins tick_params annotate quiver contour barh stackplot subplots_adjust axhline axvline semilogx semilogy loglog polar streamplot hexbin pcolor tricontour errorbar clabel set_aspect violinplot set_axis_off spines text hatch plt axis plt.bar() plt.axis import figure pyplot highlight_text pypalettes plt.subplots() xlabel ylabel title legend colorbar savefig tight_layout grid set_xlim set_ylim plot scatter hist boxplot imshow cmap alpha bins tick_params annotate quiver contour barh stackplot subplots_adjust axhline axvline semilogx semilogy loglog polar streamplot hexbin pcolor tricontour errorbar clabel set_aspect violinplot set_axis_off spines text hatch plt axis plt.bar() plt.axis import figure pyplot highlight_text pypalettes plt.subplots() xlabel ylabel title legend colorbar savefig tight_layout grid set_xlim set_ylim plot scatter hist boxplot imshow cmap alpha bins tick_params annotate quiver contour barh stackplot subplots_adjust axhline axvline semilogx semilogy loglog polar streamplot hexbin pcolor tricontour errorbar clabel set_aspect violinplot set_axis_off spines text hatch plt axis plt.bar() plt.axis import figure pyplot highlight_text pypalettes plt.subplots() xlabel ylabel title legend colorbar savefig tight_layout grid set_xlim set_ylim plot scatter hist boxplot imshow cmap alpha bins tick_params annotate quiver contour barh stackplot subplots_adjust axhline axvline semilogx semilogy loglog polar streamplot hexbin pcolor tricontour errorbar clabel set_aspect violinplot set_axis_off spines text hatch plt axis plt.bar() plt.axis import figure pyplot highlight_text pypalettes plt.subplots() xlabel ylabel title legend colorbar savefig tight_layout grid set_xlim set_ylim plot scatter hist boxplot imshow cmap alpha bins tick_params annotate quiver contour barh stackplot subplots_adjust axhline axvline semilogx semilogy loglog polar streamplot hexbin pcolor tricontour errorbar clabel set_aspect violinplot set_axis_off spines text hatch plt axis plt.bar() plt.axis import figure pyplot highlight_text pypalettes plt.subplots() xlabel ylabel title legend colorbar savefig tight_layout grid set_xlim set_ylim plot scatter hist boxplot imshow cmap alpha bins tick_params annotate quiver contour barh stackplot subplots_adjust axhline axvline semilogx semilogy loglog polar streamplot hexbin pcolor tricontour errorbar clabel set_aspect violinplot set_axis_off spines text hatch plt axis plt.bar() plt.axis import figure pyplot highlight_text pypalettes plt.subplots() xlabel ylabel title legend colorbar savefig tight_layout grid set_xlim set_ylim plot scatter hist boxplot imshow cmap alpha bins tick_params annotate quiver contour barh stackplot subplots_adjust axhline axvline semilogx semilogy loglog polar streamplot hexbin pcolor tricontour errorbar clabel set_aspect violinplot set_axis_off spines text hatch plt axis plt.bar() plt.axis import figure pyplot highlight_text pypalettes plt.subplots() xlabel ylabel title legend colorbar savefig tight_layout grid set_xlim set_ylim plot scatter hist boxplot imshow cmap alpha bins tick_params annotate quiver contour barh stackplot subplots_adjust axhline axvline semilogx semilogy loglog polar streamplot hexbin pcolor tricontour errorbar clabel set_aspect violinplot set_axis_off spines text hatch plt axis plt.bar() plt.axis import figure pyplot highlight_text pypalettes plt.subplots() xlabel ylabel title legend colorbar savefig tight_layout grid set_xlim set_ylim plot scatter hist boxplot imshow cmap alpha bins tick_params annotate quiver contour barh stackplot subplots_adjust axhline axvline semilogx semilogy loglog polar streamplot hexbin pcolor tricontour errorbar clabel set_aspect violinplot set_axis_off spines text hatch plt axis plt.bar() plt.axis import figure pyplot highlight_text pypalettes plt.subplots() xlabel ylabel title legend colorbar savefig tight_layout grid set_xlim set_ylim plot scatter hist boxplot imshow cmap alpha bins tick_params annotate quiver contour barh stackplot subplots_adjust axhline axvline semilogx semilogy loglog polar streamplot hexbin pcolor tricontour errorbar clabel set_aspect violinplot set_axis_off spines text hatch plt axis plt.bar() plt.axis import figure pyplot highlight_text pypalettes plt.subplots() xlabel ylabel title legend colorbar savefig tight_layout grid set_xlim set_ylim plot scatter hist boxplot imshow cmap alpha bins tick_params annotate quiver contour barh stackplot subplots_adjust axhline axvline semilogx semilogy loglog polar streamplot hexbin pcolor tricontour errorbar clabel set_aspect violinplot set_axis_off spines text hatch plt axis plt.bar() plt.axis import figure pyplot highlight_text pypalettes plt.subplots() xlabel ylabel title legend colorbar savefig tight_layout grid set_xlim set_ylim plot scatter hist boxplot imshow cmap alpha bins tick_params annotate quiver contour barh stackplot subplots_adjust axhline axvline semilogx semilogy loglog polar streamplot hexbin pcolor tricontour errorbar clabel set_aspect violinplot set_axis_off spines text hatch plt axis plt.bar() plt.axis import figure pyplot highlight_text pypalettes plt.subplots() xlabel ylabel title legend colorbar savefig tight_layout grid set_xlim set_ylim plot scatter hist boxplot imshow cmap alpha bins tick_params annotate quiver contour barh stackplot subplots_adjust axhline axvline semilogx semilogy loglog polar streamplot hexbin pcolor tricontour errorbar clabel set_aspect violinplot set_axis_off spines text hatch plt axis plt.bar() plt.axis import figure pyplot highlight_text pypalettes plt.subplots() xlabel ylabel title legend colorbar savefig tight_layout grid set_xlim set_ylim plot scatter hist boxplot imshow cmap alpha bins tick_params annotate quiver contour barh stackplot subplots_adjust axhline axvline semilogx semilogy loglog polar streamplot hexbin pcolor tricontour errorbar clabel set_aspect violinplot set_axis_off spines text hatch plt axis plt.bar() plt.axis import figure pyplot highlight_text pypalettes plt.subplots() xlabel ylabel title legend colorbar savefig tight_layout grid set_xlim set_ylim plot scatter hist boxplot imshow cmap alpha bins tick_params annotate quiver contour barh stackplot subplots_adjust axhline axvline semilogx semilogy loglog polar streamplot hexbin pcolor tricontour errorbar clabel set_aspect violinplot set_axis_off spines text hatch plt axis plt.bar() plt.axis import figure pyplot highlight_text pypalettes plt.subplots() xlabel ylabel title legend colorbar savefig tight_layout grid set_xlim set_ylim plot scatter hist boxplot imshow cmap alpha bins tick_params annotate quiver contour barh stackplot subplots_adjust axhline axvline semilogx semilogy loglog polar streamplot hexbin pcolor tricontour errorbar clabel set_aspect violinplot set_axis_off spines text hatch plt axis plt.bar() plt.axis import figure pyplot highlight_text pypalettes plt.subplots() xlabel ylabel title legend colorbar savefig tight_layout grid set_xlim set_ylim plot scatter hist boxplot imshow cmap alpha bins tick_params annotate quiver contour barh stackplot subplots_adjust axhline axvline semilogx semilogy loglog polar streamplot hexbin pcolor tricontour errorbar clabel set_aspect violinplot set_axis_off spines text hatch plt axis plt.bar() plt.axis import figure pyplot highlight_text pypalettes plt.subplots() xlabel ylabel title legend colorbar savefig tight_layout grid set_xlim set_ylim plot scatter hist boxplot imshow cmap alpha bins tick_params annotate quiver contour barh stackplot subplots_adjust axhline axvline semilogx semilogy loglog polar streamplot hexbin pcolor tricontour errorbar clabel set_aspect violinplot set_axis_off spines text hatch plt axis plt.bar() plt.axis import figure pyplot highlight_text pypalettes plt.subplots() xlabel ylabel title legend colorbar savefig tight_layout grid set_xlim set_ylim plot scatter hist boxplot imshow cmap alpha bins tick_params annotate quiver contour barh stackplot subplots_adjust axhline axvline semilogx semilogy loglog polar streamplot hexbin pcolor tricontour errorbar clabel set_aspect violinplot set_axis_off spines text hatch plt axis plt.bar() plt.axis import figure pyplot highlight_text pypalettes plt.subplots() xlabel ylabel title legend colorbar savefig tight_layout grid set_xlim set_ylim plot scatter hist boxplot imshow cmap alpha bins tick_params annotate quiver contour barh stackplot subplots_adjust axhline axvline semilogx semilogy loglog polar streamplot hexbin pcolor tricontour errorbar clabel set_aspect violinplot set_axis_off spines text hatch plt axis plt.bar() plt.axis import figure pyplot highlight_text pypalettes plt.subplots() xlabel ylabel title legend colorbar savefig tight_layout grid set_xlim set_ylim plot scatter hist boxplot imshow cmap alpha bins tick_params annotate quiver contour barh stackplot subplots_adjust axhline axvline semilogx semilogy loglog polar streamplot hexbin pcolor tricontour errorbar clabel set_aspect violinplot set_axis_off spines text hatch plt axis plt.bar() plt.axis import figure pyplot highlight_text pypalettes plt.subplots() xlabel ylabel title legend colorbar savefig tight_layout grid set_xlim set_ylim plot scatter hist boxplot imshow cmap alpha bins tick_params annotate quiver contour barh stackplot subplots_adjust axhline axvline semilogx semilogy loglog polar streamplot hexbin pcolor tricontour errorbar clabel set_aspect violinplot set_axis_off spines text hatch plt axis plt.bar() plt.axis import figure pyplot highlight_text pypalettes plt.subplots() xlabel ylabel title legend colorbar savefig tight_layout grid set_xlim set_ylim plot scatter hist boxplot imshow cmap alpha bins tick_params annotate quiver contour barh stackplot subplots_adjust axhline axvline semilogx semilogy loglog polar streamplot hexbin pcolor tricontour errorbar clabel set_aspect violinplot set_axis_off spines text hatch plt axis plt.bar() plt.axis import figure pyplot highlight_text pypalettes plt.subplots() xlabel ylabel title legend colorbar savefig tight_layout grid set_xlim set_ylim plot scatter hist boxplot imshow cmap alpha bins tick_params annotate quiver contour barh stackplot subplots_adjust axhline axvline semilogx semilogy loglog polar streamplot hexbin pcolor tricontour errorbar clabel set_aspect violinplot set_axis_off spines text hatch plt axis plt.bar() plt.axis import figure pyplot highlight_text pypalettes plt.subplots() xlabel ylabel title legend colorbar savefig tight_layout grid set_xlim set_ylim plot scatter hist boxplot imshow cmap alpha bins tick_params annotate quiver contour barh stackplot subplots_adjust axhline axvline semilogx semilogy loglog polar streamplot hexbin pcolor tricontour errorbar clabel set_aspect violinplot set_axis_off spines text hatch plt axis plt.bar() plt.axis import figure pyplot highlight_text pypalettes plt.subplots() xlabel ylabel title legend colorbar savefig tight_layout grid set_xlim set_ylim plot scatter hist boxplot imshow cmap alpha bins tick_params annotate quiver contour barh stackplot subplots_adjust axhline axvline semilogx semilogy loglog polar streamplot hexbin pcolor tricontour errorbar clabel set_aspect violinplot set_axis_off spines text hatch plt axis plt.bar() plt.axis import figure pyplot highlight_text pypalettes plt.subplots() xlabel ylabel title legend colorbar savefig tight_layout grid set_xlim set_ylim plot scatter hist boxplot imshow cmap alpha bins tick_params annotate quiver contour barh stackplot subplots_adjust axhline axvline semilogx semilogy loglog polar streamplot hexbin pcolor tricontour errorbar clabel set_aspect violinplot set_axis_off spines text hatch plt axis plt.bar() plt.axis import figure pyplot highlight_text pypalettes plt.subplots() xlabel ylabel title legend colorbar savefig tight_layout grid set_xlim set_ylim plot scatter hist boxplot imshow cmap alpha bins tick_params annotate quiver contour barh stackplot subplots_adjust axhline axvline semilogx semilogy loglog polar streamplot hexbin pcolor tricontour errorbar clabel set_aspect violinplot set_axis_off spines text hatch plt axis plt.bar() plt.axis import figure pyplot highlight_text pypalettes plt.subplots() xlabel ylabel title legend colorbar savefig tight_layout grid set_xlim set_ylim plot scatter hist boxplot imshow cmap alpha bins tick_params annotate quiver contour barh stackplot subplots_adjust axhline axvline semilogx semilogy loglog polar streamplot hexbin pcolor tricontour errorbar clabel set_aspect violinplot set_axis_off spines text hatch plt axis plt.bar() plt.axis import figure pyplot highlight_text pypalettes plt.subplots() xlabel ylabel title legend colorbar savefig tight_layout grid set_xlim set_ylim plot scatter hist boxplot imshow cmap alpha bins tick_params annotate quiver contour barh stackplot subplots_adjust axhline axvline semilogx semilogy loglog polar streamplot hexbin pcolor tricontour errorbar clabel set_aspect violinplot set_axis_off spines text hatch plt axis plt.bar() plt.axis import figure pyplot highlight_text pypalettes plt.subplots() xlabel ylabel title legend colorbar savefig tight_layout grid set_xlim set_ylim plot scatter hist boxplot imshow cmap alpha bins tick_params annotate quiver contour barh stackplot subplots_adjust axhline axvline semilogx semilogy loglog polar streamplot hexbin pcolor tricontour errorbar clabel set_aspect violinplot set_axis_off spines text hatch plt axis plt.bar() plt.axis import figure pyplot highlight_text pypalettes plt.subplots() xlabel ylabel title legend colorbar savefig tight_layout grid set_xlim set_ylim plot scatter hist boxplot imshow cmap alpha bins tick_params annotate quiver contour barh stackplot subplots_adjust axhline axvline semilogx semilogy loglog polar streamplot hexbin pcolor tricontour errorbar clabel set_aspect violinplot set_axis_off spines text hatch plt axis plt.bar() plt.axis import figure pyplot highlight_text pypalettes plt.subplots() xlabel ylabel title legend colorbar savefig tight_layout grid set_xlim set_ylim plot scatter hist boxplot imshow cmap alpha bins tick_params annotate quiver contour barh stackplot subplots_adjust axhline axvline semilogx semilogy loglog polar streamplot hexbin pcolor tricontour errorbar clabel set_aspect violinplot set_axis_off spines text hatch plt axis plt.bar() plt.axis import figure pyplot highlight_text pypalettes plt.subplots() xlabel ylabel title legend colorbar savefig tight_layout grid set_xlim set_ylim plot scatter hist boxplot imshow cmap alpha bins tick_params annotate quiver contour barh stackplot subplots_adjust axhline axvline semilogx semilogy loglog polar streamplot hexbin pcolor tricontour errorbar clabel set_aspect violinplot set_axis_off spines text hatch plt axis plt.bar() plt.axis import figure pyplot highlight_text pypalettes plt.subplots() xlabel ylabel title legend colorbar savefig tight_layout grid set_xlim set_ylim plot scatter hist boxplot imshow cmap alpha bins tick_params annotate quiver contour barh stackplot subplots_adjust axhline axvline semilogx semilogy loglog polar streamplot hexbin pcolor tricontour errorbar clabel set_aspect violinplot set_axis_off spines text hatch plt axis plt.bar() plt.axis import figure pyplot highlight_text pypalettes plt.subplots() xlabel ylabel title legend colorbar savefig tight_layout grid set_xlim set_ylim plot scatter hist boxplot imshow cmap alpha bins tick_params annotate quiver contour barh stackplot subplots_adjust axhline axvline semilogx semilogy loglog polar streamplot hexbin pcolor tricontour errorbar clabel set_aspect violinplot set_axis_off spines text hatch plt axis plt.bar() plt.axis import figure pyplot highlight_text pypalettes plt.subplots() xlabel ylabel title legend colorbar savefig tight_layout grid set_xlim set_ylim plot scatter hist boxplot imshow cmap alpha bins tick_params annotate quiver contour barh stackplot subplots_adjust axhline axvline semilogx semilogy loglog polar streamplot hexbin pcolor tricontour errorbar clabel set_aspect violinplot set_axis_off spines text hatch plt axis plt.bar() plt.axis import figure pyplot highlight_text pypalettes plt.subplots() xlabel ylabel title legend colorbar savefig tight_layout grid set_xlim set_ylim plot scatter hist boxplot imshow cmap alpha bins tick_params annotate quiver contour barh stackplot subplots_adjust axhline axvline semilogx semilogy loglog polar streamplot hexbin pcolor tricontour errorbar clabel set_aspect violinplot set_axis_off spines text hatch plt axis plt.bar() plt.axis import figure pyplot highlight_text pypalettes plt.subplots() xlabel ylabel title legend colorbar savefig tight_layout grid set_xlim set_ylim plot scatter hist boxplot imshow cmap alpha bins tick_params annotate quiver contour barh stackplot subplots_adjust axhline axvline semilogx semilogy loglog polar streamplot hexbin pcolor tricontour errorbar clabel set_aspect violinplot set_axis_off spines text hatch plt axis plt.bar() plt.axis import figure pyplot highlight_text pypalettes plt.subplots() xlabel ylabel title legend colorbar savefig tight_layout grid set_xlim set_ylim plot scatter hist boxplot imshow cmap alpha bins tick_params annotate quiver contour barh stackplot subplots_adjust axhline axvline semilogx semilogy loglog polar streamplot hexbin pcolor tricontour errorbar clabel set_aspect violinplot set_axis_off spines text hatch plt axis plt.bar() plt.axis import figure pyplot highlight_text pypalettes plt.subplots() xlabel ylabel title legend colorbar savefig tight_layout grid set_xlim set_ylim plot scatter hist boxplot imshow cmap alpha bins tick_params annotate quiver contour barh stackplot subplots_adjust axhline axvline semilogx semilogy loglog polar streamplot hexbin pcolor tricontour errorbar clabel set_aspect violinplot set_axis_off spines text hatch plt axis plt.bar() plt.axis import figure pyplot highlight_text pypalettes plt.subplots() xlabel ylabel title legend colorbar savefig tight_layout grid set_xlim set_ylim plot scatter hist boxplot imshow cmap alpha bins tick_params annotate quiver contour barh stackplot subplots_adjust axhline axvline semilogx semilogy loglog polar streamplot hexbin pcolor tricontour errorbar clabel set_aspect violinplot set_axis_off spines text hatch plt axis plt.bar() plt.axis import figure pyplot highlight_text pypalettes plt.subplots() xlabel ylabel title legend colorbar savefig tight_layout grid set_xlim set_ylim plot scatter hist boxplot imshow cmap alpha bins tick_params annotate quiver contour barh stackplot subplots_adjust axhline axvline semilogx semilogy loglog polar streamplot hexbin pcolor tricontour errorbar clabel set_aspect violinplot set_axis_off spines text hatch plt axis plt.bar() plt.axis import figure pyplot highlight_text pypalettes plt.subplots() xlabel ylabel title legend colorbar savefig tight_layout grid set_xlim set_ylim plot scatter hist boxplot imshow cmap alpha bins tick_params annotate quiver contour barh stackplot subplots_adjust axhline axvline semilogx semilogy loglog polar streamplot hexbin pcolor tricontour errorbar clabel set_aspect violinplot set_axis_off spines text hatch plt axis plt.bar() plt.axis import figure pyplot highlight_text pypalettes plt.subplots() xlabel ylabel title legend colorbar savefig tight_layout grid set_xlim set_ylim plot scatter hist boxplot imshow cmap alpha bins tick_params annotate quiver contour barh stackplot subplots_adjust axhline axvline semilogx semilogy loglog polar streamplot hexbin pcolor tricontour errorbar clabel set_aspect violinplot set_axis_off spines text hatch plt axis plt.bar() plt.axis import figure pyplot highlight_text pypalettes plt.subplots() xlabel ylabel title legend colorbar savefig tight_layout grid set_xlim set_ylim plot scatter hist boxplot imshow cmap alpha bins tick_params annotate quiver contour barh stackplot subplots_adjust axhline axvline semilogx semilogy loglog polar streamplot hexbin pcolor tricontour errorbar clabel set_aspect violinplot set_axis_off spines text hatch plt axis plt.bar() plt.axis import figure pyplot highlight_text pypalettes plt.subplots() xlabel ylabel title legend colorbar savefig tight_layout grid set_xlim set_ylim plot scatter hist boxplot imshow cmap alpha bins tick_params annotate quiver contour barh stackplot subplots_adjust axhline axvline semilogx semilogy loglog polar streamplot hexbin pcolor tricontour errorbar clabel set_aspect violinplot set_axis_off spines text hatch plt axis plt.bar() plt.axis import figure pyplot highlight_text pypalettes plt.subplots() xlabel ylabel title legend colorbar savefig tight_layout grid set_xlim set_ylim plot scatter hist boxplot imshow cmap alpha bins tick_params annotate quiver contour barh stackplot subplots_adjust axhline axvline semilogx semilogy loglog polar streamplot hexbin pcolor tricontour errorbar clabel set_aspect violinplot set_axis_off spines text hatch plt axis plt.bar() plt.axis import figure pyplot highlight_text pypalettes plt.subplots() xlabel ylabel title legend colorbar savefig tight_layout grid set_xlim set_ylim plot scatter hist boxplot imshow cmap alpha bins tick_params annotate quiver contour barh stackplot subplots_adjust axhline axvline semilogx semilogy loglog polar streamplot hexbin pcolor tricontour errorbar clabel set_aspect violinplot set_axis_off spines text hatch plt axis plt.bar() plt.axis import figure pyplot highlight_text pypalettes plt.subplots() xlabel ylabel title legend colorbar savefig tight_layout grid set_xlim set_ylim plot scatter hist boxplot imshow cmap alpha bins tick_params annotate quiver contour barh stackplot subplots_adjust axhline axvline semilogx semilogy loglog polar streamplot hexbin pcolor tricontour errorbar clabel set_aspect violinplot set_axis_off spines text hatch plt axis plt.bar() plt.axis import figure pyplot highlight_text pypalettes plt.subplots() xlabel ylabel title legend colorbar savefig tight_layout grid set_xlim set_ylim plot scatter hist boxplot imshow cmap alpha bins tick_params annotate quiver contour barh stackplot subplots_adjust axhline axvline semilogx semilogy loglog polar streamplot hexbin pcolor tricontour errorbar clabel set_aspect violinplot set_axis_off spines text hatch plt axis plt.bar() plt.axis import figure pyplot highlight_text pypalettes plt.subplots() xlabel ylabel title legend colorbar savefig tight_layout grid set_xlim set_ylim plot scatter hist boxplot imshow cmap alpha bins tick_params annotate quiver contour barh stackplot subplots_adjust axhline axvline semilogx semilogy loglog polar streamplot hexbin pcolor tricontour errorbar clabel set_aspect violinplot set_axis_off spines text hatch plt axis plt.bar() plt.axis import figure pyplot highlight_text pypalettes plt.subplots() xlabel ylabel title legend colorbar savefig tight_layout grid set_xlim set_ylim plot scatter hist boxplot imshow cmap alpha bins tick_params annotate quiver contour barh stackplot subplots_adjust axhline axvline semilogx semilogy loglog polar streamplot hexbin pcolor tricontour errorbar clabel set_aspect violinplot set_axis_off spines text hatch plt axis plt.bar() plt.axis import figure pyplot highlight_text pypalettes plt.subplots() xlabel ylabel title legend colorbar savefig tight_layout grid set_xlim set_ylim plot scatter hist boxplot imshow cmap alpha bins tick_params annotate quiver contour barh stackplot subplots_adjust axhline axvline semilogx semilogy loglog polar streamplot hexbin pcolor tricontour errorbar clabel set_aspect violinplot set_axis_off spines text hatch plt axis plt.bar() plt.axis import figure pyplot highlight_text pypalettes plt.subplots() xlabel ylabel title legend colorbar savefig tight_layout grid set_xlim set_ylim plot scatter hist boxplot imshow cmap alpha bins tick_params annotate quiver contour barh stackplot subplots_adjust axhline axvline semilogx semilogy loglog polar streamplot hexbin pcolor tricontour errorbar clabel set_aspect violinplot set_axis_off spines text hatch plt axis plt.bar() plt.axis import figure pyplot highlight_text pypalettes plt.subplots() xlabel ylabel title legend colorbar savefig tight_layout grid set_xlim set_ylim plot scatter hist boxplot imshow cmap alpha bins tick_params annotate quiver contour barh stackplot subplots_adjust axhline axvline semilogx semilogy loglog polar streamplot hexbin pcolor tricontour errorbar clabel set_aspect violinplot set_axis_off spines text hatch plt axis plt.bar() plt.axis import figure pyplot highlight_text pypalettes plt.subplots() xlabel ylabel title legend colorbar savefig tight_layout grid set_xlim set_ylim plot scatter hist boxplot imshow cmap alpha bins tick_params annotate quiver contour barh stackplot subplots_adjust axhline axvline semilogx semilogy loglog polar streamplot hexbin pcolor tricontour errorbar clabel set_aspect violinplot set_axis_off spines text hatch plt axis plt.bar() plt.axis import figure pyplot highlight_text pypalettes plt.subplots() xlabel ylabel title legend colorbar savefig tight_layout grid set_xlim set_ylim plot scatter hist boxplot imshow cmap alpha bins tick_params annotate quiver contour barh stackplot subplots_adjust axhline axvline semilogx semilogy loglog polar streamplot hexbin pcolor tricontour errorbar clabel set_aspect violinplot set_axis_off spines text hatch plt axis plt.bar() plt.axis import figure pyplot highlight_text pypalettes plt.subplots() xlabel ylabel title legend colorbar savefig tight_layout grid set_xlim set_ylim plot scatter hist boxplot imshow cmap alpha bins tick_params annotate quiver contour barh stackplot subplots_adjust axhline axvline semilogx semilogy loglog polar streamplot hexbin pcolor tricontour errorbar clabel set_aspect violinplot set_axis_off spines text hatch plt axis plt.bar() plt.axis import figure pyplot highlight_text pypalettes plt.subplots() xlabel ylabel title legend colorbar savefig tight_layout grid set_xlim set_ylim plot scatter hist boxplot imshow cmap alpha bins tick_params annotate quiver contour barh stackplot subplots_adjust axhline axvline semilogx semilogy loglog polar streamplot hexbin pcolor tricontour errorbar clabel set_aspect violinplot set_axis_off spines text hatch plt axis plt.bar() plt.axis import figure pyplot highlight_text pypalettes plt.subplots() xlabel ylabel title legend colorbar savefig tight_layout grid set_xlim set_ylim plot scatter hist boxplot imshow cmap alpha bins tick_params annotate quiver contour barh stackplot subplots_adjust axhline axvline semilogx semilogy loglog polar streamplot hexbin pcolor tricontour errorbar clabel set_aspect violinplot set_axis_off spines text hatch plt axis plt.bar() plt.axis import figure pyplot highlight_text pypalettes plt.subplots() xlabel ylabel title legend colorbar savefig tight_layout grid set_xlim set_ylim plot scatter hist boxplot imshow cmap alpha bins tick_params annotate quiver contour barh stackplot subplots_adjust axhline axvline semilogx semilogy loglog polar streamplot hexbin pcolor tricontour errorbar clabel set_aspect violinplot set_axis_off spines text hatch plt axis plt.bar() plt.axis import figure pyplot highlight_text pypalettes plt.subplots() xlabel ylabel title legend colorbar savefig tight_layout grid set_xlim set_ylim plot scatter hist boxplot imshow cmap alpha bins tick_params annotate quiver contour barh stackplot subplots_adjust axhline axvline semilogx semilogy loglog polar streamplot hexbin pcolor tricontour errorbar clabel set_aspect violinplot set_axis_off spines text hatch plt axis plt.bar() plt.axis import figure pyplot highlight_text pypalettes plt.subplots() xlabel ylabel title legend colorbar savefig tight_layout grid set_xlim set_ylim plot scatter hist boxplot imshow cmap alpha bins tick_params annotate quiver contour barh stackplot subplots_adjust axhline axvline semilogx semilogy loglog polar streamplot hexbin pcolor tricontour errorbar clabel set_aspect violinplot set_axis_off spines text hatch plt axis plt.bar() plt.axis import figure pyplot highlight_text pypalettes plt.subplots() xlabel ylabel title legend colorbar savefig tight_layout grid set_xlim set_ylim plot scatter hist boxplot imshow cmap alpha bins tick_params annotate quiver contour barh stackplot subplots_adjust axhline axvline semilogx semilogy loglog polar streamplot hexbin pcolor tricontour errorbar clabel set_aspect violinplot set_axis_off spines text hatch plt axis plt.bar() plt.axis import figure pyplot highlight_text pypalettes plt.subplots() xlabel ylabel title legend colorbar savefig tight_layout grid set_xlim set_ylim plot scatter hist boxplot imshow cmap alpha bins tick_params annotate quiver contour barh stackplot subplots_adjust axhline axvline semilogx semilogy loglog polar streamplot hexbin pcolor tricontour errorbar clabel set_aspect violinplot set_axis_off spines text hatch plt axis plt.bar() plt.axis import figure pyplot highlight_text pypalettes plt.subplots() xlabel ylabel title legend colorbar savefig tight_layout grid set_xlim set_ylim plot scatter hist boxplot imshow cmap alpha bins tick_params annotate quiver contour barh stackplot subplots_adjust axhline axvline semilogx semilogy loglog polar streamplot hexbin pcolor tricontour errorbar clabel set_aspect violinplot set_axis_off spines text hatch plt axis plt.bar() plt.axis import figure pyplot highlight_text pypalettes plt.subplots() xlabel ylabel title legend colorbar savefig tight_layout grid set_xlim set_ylim plot scatter hist boxplot imshow cmap alpha bins tick_params annotate quiver contour barh stackplot subplots_adjust axhline axvline semilogx semilogy loglog polar streamplot hexbin pcolor tricontour errorbar clabel set_aspect violinplot set_axis_off spines text hatch plt axis plt.bar() plt.axis import figure pyplot highlight_text pypalettes plt.subplots() xlabel ylabel title legend colorbar savefig tight_layout grid set_xlim set_ylim plot scatter hist boxplot imshow cmap alpha bins tick_params annotate quiver contour barh stackplot subplots_adjust axhline axvline semilogx semilogy loglog polar streamplot hexbin pcolor tricontour errorbar clabel set_aspect violinplot set_axis_off spines text hatch plt axis plt.bar() plt.axis import figure pyplot highlight_text pypalettes plt.subplots() xlabel ylabel title legend colorbar savefig tight_layout grid set_xlim set_ylim plot scatter hist boxplot imshow cmap alpha bins tick_params annotate quiver contour barh stackplot subplots_adjust axhline axvline semilogx semilogy loglog polar streamplot hexbin pcolor tricontour errorbar clabel set_aspect violinplot set_axis_off spines text hatch plt axis plt.bar() plt.axis import figure pyplot highlight_text pypalettes plt.subplots() xlabel ylabel title legend colorbar savefig tight_layout grid set_xlim set_ylim plot scatter hist boxplot imshow cmap alpha bins tick_params annotate quiver contour barh stackplot subplots_adjust axhline axvline semilogx semilogy loglog polar streamplot hexbin pcolor tricontour errorbar clabel set_aspect violinplot set_axis_off spines text hatch plt axis plt.bar() plt.axis import figure pyplot highlight_text pypalettes plt.subplots() xlabel ylabel title legend colorbar savefig tight_layout grid set_xlim set_ylim plot scatter hist boxplot imshow cmap alpha bins tick_params annotate quiver contour barh stackplot subplots_adjust axhline axvline semilogx semilogy loglog polar streamplot hexbin pcolor tricontour errorbar clabel set_aspect violinplot set_axis_off spines text hatch plt axis plt.bar() plt.axis import figure pyplot highlight_text pypalettes plt.subplots() xlabel ylabel title legend colorbar savefig tight_layout grid set_xlim set_ylim plot scatter hist boxplot imshow cmap alpha bins tick_params annotate quiver contour barh stackplot subplots_adjust axhline axvline semilogx semilogy loglog polar streamplot hexbin pcolor tricontour errorbar clabel set_aspect violinplot set_axis_off spines text hatch plt axis plt.bar() plt.axis import figure pyplot highlight_text pypalettes plt.subplots() xlabel ylabel title legend colorbar savefig tight_layout grid set_xlim set_ylim plot scatter hist boxplot imshow cmap alpha bins tick_params annotate quiver contour barh stackplot subplots_adjust axhline axvline semilogx semilogy loglog polar streamplot hexbin pcolor tricontour errorbar clabel set_aspect violinplot set_axis_off spines text hatch plt axis plt.bar() plt.axis import figure pyplot highlight_text pypalettes plt.subplots() xlabel ylabel title legend colorbar savefig tight_layout grid set_xlim set_ylim plot scatter hist boxplot imshow cmap alpha bins tick_params annotate quiver contour barh stackplot subplots_adjust axhline axvline semilogx semilogy loglog polar streamplot hexbin pcolor tricontour errorbar clabel set_aspect violinplot set_axis_off spines text hatch plt axis plt.bar() plt.axis import figure pyplot highlight_text pypalettes plt.subplots() xlabel ylabel title legend colorbar savefig tight_layout grid set_xlim set_ylim plot scatter hist boxplot imshow cmap alpha bins tick_params annotate quiver contour barh stackplot subplots_adjust axhline axvline semilogx semilogy loglog polar streamplot hexbin pcolor tricontour errorbar clabel set_aspect violinplot set_axis_off spines text hatch plt axis plt.bar() plt.axis import figure pyplot highlight_text pypalettes plt.subplots() xlabel ylabel title legend colorbar savefig tight_layout grid set_xlim set_ylim plot scatter hist boxplot imshow cmap alpha bins tick_params annotate quiver contour barh stackplot subplots_adjust axhline axvline semilogx semilogy loglog polar streamplot hexbin pcolor tricontour errorbar clabel set_aspect violinplot set_axis_off spines text hatch plt axis plt.bar() plt.axis import figure pyplot highlight_text pypalettes plt.subplots() xlabel ylabel title legend colorbar savefig tight_layout grid set_xlim set_ylim plot scatter hist boxplot imshow cmap alpha bins tick_params annotate quiver contour barh stackplot subplots_adjust axhline axvline semilogx semilogy loglog polar streamplot hexbin pcolor tricontour errorbar clabel set_aspect violinplot set_axis_off spines text hatch plt axis plt.bar() plt.axis import figure pyplot highlight_text pypalettes plt.subplots() xlabel ylabel title legend colorbar savefig tight_layout grid set_xlim set_ylim plot scatter hist boxplot imshow cmap alpha bins tick_params annotate quiver contour barh stackplot subplots_adjust axhline axvline semilogx semilogy loglog polar streamplot hexbin pcolor tricontour errorbar clabel set_aspect violinplot set_axis_off spines text hatch plt axis plt.bar() plt.axis import figure pyplot highlight_text pypalettes plt.subplots() xlabel ylabel title legend colorbar savefig tight_layout grid set_xlim set_ylim plot scatter hist boxplot imshow cmap alpha bins tick_params annotate quiver contour barh stackplot subplots_adjust axhline axvline semilogx semilogy loglog polar streamplot hexbin pcolor tricontour errorbar clabel set_aspect violinplot set_axis_off spines text hatch plt axis plt.bar() plt.axis import figure pyplot highlight_text pypalettes plt.subplots() xlabel ylabel title legend colorbar savefig tight_layout grid set_xlim set_ylim plot scatter hist boxplot imshow cmap alpha bins tick_params annotate quiver contour barh stackplot subplots_adjust axhline axvline semilogx semilogy loglog polar streamplot hexbin pcolor tricontour errorbar clabel set_aspect violinplot set_axis_off spines text hatch plt axis plt.bar() plt.axis import figure pyplot highlight_text pypalettes plt.subplots() xlabel ylabel title legend colorbar savefig tight_layout grid set_xlim set_ylim plot scatter hist boxplot imshow cmap alpha bins tick_params annotate quiver contour barh stackplot subplots_adjust axhline axvline semilogx semilogy loglog polar streamplot hexbin pcolor tricontour errorbar clabel set_aspect violinplot set_axis_off spines text hatch plt axis plt.bar() plt.axis import figure pyplot highlight_text pypalettes plt.subplots() xlabel ylabel title legend colorbar savefig tight_layout grid set_xlim set_ylim plot scatter hist boxplot imshow cmap alpha bins tick_params annotate quiver contour barh stackplot subplots_adjust axhline axvline semilogx semilogy loglog polar streamplot hexbin pcolor tricontour errorbar clabel set_aspect violinplot set_axis_off spines text hatch plt axis plt.bar() plt.axis import figure pyplot highlight_text pypalettes plt.subplots() xlabel ylabel title legend colorbar savefig tight_layout grid set_xlim set_ylim plot scatter hist boxplot imshow cmap alpha bins tick_params annotate quiver contour barh stackplot subplots_adjust axhline axvline semilogx semilogy loglog polar streamplot hexbin pcolor tricontour errorbar clabel set_aspect violinplot set_axis_off spines text hatch plt axis plt.bar() plt.axis import figure pyplot highlight_text pypalettes plt.subplots() xlabel ylabel title legend colorbar savefig tight_layout grid set_xlim set_ylim plot scatter hist boxplot imshow cmap alpha bins tick_params annotate quiver contour barh stackplot subplots_adjust axhline axvline semilogx semilogy loglog polar streamplot hexbin pcolor tricontour errorbar clabel set_aspect violinplot set_axis_off spines text hatch plt axis plt.bar() plt.axis import figure pyplot highlight_text pypalettes plt.subplots() xlabel ylabel title legend colorbar savefig tight_layout grid set_xlim set_ylim plot scatter hist boxplot imshow cmap alpha bins tick_params annotate quiver contour barh stackplot subplots_adjust axhline axvline semilogx semilogy loglog polar streamplot hexbin pcolor tricontour errorbar clabel set_aspect violinplot set_axis_off spines text hatch plt axis plt.bar() plt.axis import figure pyplot highlight_text pypalettes plt.subplots() xlabel ylabel title legend colorbar savefig tight_layout grid set_xlim set_ylim plot scatter hist boxplot imshow cmap alpha bins tick_params annotate quiver contour barh stackplot subplots_adjust axhline axvline semilogx semilogy loglog polar streamplot hexbin pcolor tricontour errorbar clabel set_aspect violinplot set_axis_off spines text hatch plt axis plt.bar() plt.axis import figure pyplot highlight_text pypalettes plt.subplots() xlabel ylabel title legend colorbar savefig tight_layout grid set_xlim set_ylim plot scatter hist boxplot imshow cmap alpha bins tick_params annotate quiver contour barh stackplot subplots_adjust axhline axvline semilogx semilogy loglog polar streamplot hexbin pcolor tricontour errorbar clabel set_aspect violinplot set_axis_off spines text hatch plt axis plt.bar() plt.axis import figure pyplot highlight_text pypalettes plt.subplots() xlabel ylabel title legend colorbar savefig tight_layout grid set_xlim set_ylim plot scatter hist boxplot imshow cmap alpha bins tick_params annotate quiver contour barh stackplot subplots_adjust axhline axvline semilogx semilogy loglog polar streamplot hexbin pcolor tricontour errorbar clabel set_aspect violinplot set_axis_off spines text hatch plt axis plt.bar() plt.axis import figure pyplot highlight_text pypalettes plt.subplots() xlabel ylabel title legend colorbar savefig tight_layout grid set_xlim set_ylim plot scatter hist boxplot imshow cmap alpha bins tick_params annotate quiver contour barh stackplot subplots_adjust axhline axvline semilogx semilogy loglog polar streamplot hexbin pcolor tricontour errorbar clabel set_aspect violinplot set_axis_off spines text hatch plt axis plt.bar() plt.axis import figure pyplot highlight_text pypalettes plt.subplots() xlabel ylabel title legend colorbar savefig tight_layout grid set_xlim set_ylim plot scatter hist boxplot imshow cmap alpha bins tick_params annotate quiver contour barh stackplot subplots_adjust axhline axvline semilogx semilogy loglog polar streamplot hexbin pcolor tricontour errorbar clabel set_aspect violinplot set_axis_off spines text hatch plt axis plt.bar() plt.axis import figure pyplot highlight_text pypalettes plt.subplots() xlabel ylabel title legend colorbar savefig tight_layout grid set_xlim set_ylim plot scatter hist boxplot imshow cmap alpha bins tick_params annotate quiver contour barh stackplot subplots_adjust axhline axvline semilogx semilogy loglog polar streamplot hexbin pcolor tricontour errorbar clabel set_aspect violinplot set_axis_off spines text hatch plt axis plt.bar() plt.axis import figure pyplot highlight_text pypalettes plt.subplots() xlabel ylabel title legend colorbar savefig tight_layout grid set_xlim set_ylim plot scatter hist boxplot imshow cmap alpha bins tick_params annotate quiver contour barh stackplot subplots_adjust axhline axvline semilogx semilogy loglog polar streamplot hexbin pcolor tricontour errorbar clabel set_aspect violinplot set_axis_off spines text hatch plt axis plt.bar() plt.axis import figure pyplot highlight_text pypalettes plt.subplots() xlabel ylabel title legend colorbar savefig tight_layout grid set_xlim set_ylim plot scatter hist boxplot imshow cmap alpha bins tick_params annotate quiver contour barh stackplot subplots_adjust axhline axvline semilogx semilogy loglog polar streamplot hexbin pcolor tricontour errorbar clabel set_aspect violinplot set_axis_off spines text hatch plt axis plt.bar() plt.axis import figure pyplot highlight_text pypalettes plt.subplots() xlabel ylabel title legend colorbar savefig tight_layout grid set_xlim set_ylim plot scatter hist boxplot imshow cmap alpha bins tick_params annotate quiver contour barh stackplot subplots_adjust axhline axvline semilogx semilogy loglog polar streamplot hexbin pcolor tricontour errorbar clabel set_aspect violinplot set_axis_off spines text hatch plt axis plt.bar() plt.axis import figure pyplot highlight_text pypalettes plt.subplots() xlabel ylabel title legend colorbar savefig tight_layout grid set_xlim set_ylim plot scatter hist boxplot imshow cmap alpha bins tick_params annotate quiver contour barh stackplot subplots_adjust axhline axvline semilogx semilogy loglog polar streamplot hexbin pcolor tricontour errorbar clabel set_aspect violinplot set_axis_off spines text hatch plt axis plt.bar() plt.axis import figure pyplot highlight_text pypalettes plt.subplots() xlabel ylabel title legend colorbar savefig tight_layout grid set_xlim set_ylim plot scatter hist boxplot imshow cmap alpha bins tick_params annotate quiver contour barh stackplot subplots_adjust axhline axvline semilogx semilogy loglog polar streamplot hexbin pcolor tricontour errorbar clabel set_aspect violinplot set_axis_off spines text hatch plt axis plt.bar() plt.axis import figure pyplot highlight_text pypalettes plt.subplots() xlabel ylabel title legend colorbar savefig tight_layout grid set_xlim set_ylim plot scatter hist boxplot imshow cmap alpha bins tick_params annotate quiver contour barh stackplot subplots_adjust axhline axvline semilogx semilogy loglog polar streamplot hexbin pcolor tricontour errorbar clabel set_aspect violinplot set_axis_off spines text hatch plt axis plt.bar() plt.axis import figure pyplot highlight_text pypalettes plt.subplots() xlabel ylabel title legend colorbar savefig tight_layout grid set_xlim set_ylim plot scatter hist boxplot imshow cmap alpha bins tick_params annotate quiver contour barh stackplot subplots_adjust axhline axvline semilogx semilogy loglog polar streamplot hexbin pcolor tricontour errorbar clabel set_aspect violinplot set_axis_off spines text hatch plt axis plt.bar() plt.axis import figure pyplot highlight_text pypalettes plt.subplots() xlabel ylabel title legend colorbar savefig tight_layout grid set_xlim set_ylim plot scatter hist boxplot imshow cmap alpha bins tick_params annotate quiver contour barh stackplot subplots_adjust axhline axvline semilogx semilogy loglog polar streamplot hexbin pcolor tricontour errorbar clabel set_aspect violinplot set_axis_off spines text hatch plt axis plt.bar() plt.axis import figure pyplot highlight_text pypalettes plt.subplots() xlabel ylabel title legend colorbar savefig tight_layout grid set_xlim set_ylim plot scatter hist boxplot imshow cmap alpha bins tick_params annotate quiver contour barh stackplot subplots_adjust axhline axvline semilogx semilogy loglog polar streamplot hexbin pcolor tricontour errorbar clabel set_aspect violinplot set_axis_off spines text hatch plt axis plt.bar() plt.axis import figure pyplot highlight_text pypalettes plt.subplots() xlabel ylabel title legend colorbar savefig tight_layout grid set_xlim set_ylim plot scatter hist boxplot imshow cmap alpha bins tick_params annotate quiver contour barh stackplot subplots_adjust axhline axvline semilogx semilogy loglog polar streamplot hexbin pcolor tricontour errorbar clabel set_aspect violinplot set_axis_off spines text hatch plt axis plt.bar() plt.axis import figure pyplot highlight_text pypalettes plt.subplots() xlabel ylabel title legend colorbar savefig tight_layout grid set_xlim set_ylim plot scatter hist boxplot imshow cmap alpha bins tick_params annotate quiver contour barh stackplot subplots_adjust axhline axvline semilogx semilogy loglog polar streamplot hexbin pcolor tricontour errorbar clabel set_aspect violinplot set_axis_off spines text hatch plt axis plt.bar() plt.axis import figure pyplot highlight_text pypalettes plt.subplots() xlabel ylabel title legend colorbar savefig tight_layout grid set_xlim set_ylim plot scatter hist boxplot imshow cmap alpha bins tick_params annotate quiver contour barh stackplot subplots_adjust axhline axvline semilogx semilogy loglog polar streamplot hexbin pcolor tricontour errorbar clabel set_aspect violinplot set_axis_off spines text hatch plt axis plt.bar() plt.axis import figure pyplot highlight_text pypalettes plt.subplots() xlabel ylabel title legend colorbar savefig tight_layout grid set_xlim set_ylim plot scatter hist boxplot imshow cmap alpha bins tick_params annotate quiver contour barh stackplot subplots_adjust axhline axvline semilogx semilogy loglog polar streamplot hexbin pcolor tricontour errorbar clabel set_aspect violinplot set_axis_off spines text hatch plt axis plt.bar() plt.axis import figure pyplot highlight_text pypalettes plt.subplots() xlabel ylabel title legend colorbar savefig tight_layout grid set_xlim set_ylim plot scatter hist boxplot imshow cmap alpha bins tick_params annotate quiver contour barh stackplot subplots_adjust axhline axvline semilogx semilogy loglog polar streamplot hexbin pcolor tricontour errorbar clabel set_aspect violinplot set_axis_off spines text hatch plt axis plt.bar() plt.axis import figure pyplot highlight_text pypalettes plt.subplots() xlabel ylabel title legend colorbar savefig tight_layout grid set_xlim set_ylim plot scatter hist boxplot imshow cmap alpha bins tick_params annotate quiver contour barh stackplot subplots_adjust axhline axvline semilogx semilogy loglog polar streamplot hexbin pcolor tricontour errorbar clabel set_aspect violinplot set_axis_off spines text hatch plt axis plt.bar() plt.axis import figure pyplot highlight_text pypalettes plt.subplots() xlabel ylabel title legend colorbar savefig tight_layout grid set_xlim set_ylim plot scatter hist boxplot imshow cmap alpha bins tick_params annotate quiver contour barh stackplot subplots_adjust axhline axvline semilogx semilogy loglog polar streamplot hexbin pcolor tricontour errorbar clabel set_aspect violinplot set_axis_off spines text hatch plt axis plt.bar() plt.axis import figure pyplot highlight_text pypalettes plt.subplots() xlabel ylabel title legend colorbar savefig tight_layout grid set_xlim set_ylim plot scatter hist boxplot imshow cmap alpha bins tick_params annotate quiver contour barh stackplot subplots_adjust axhline axvline semilogx semilogy loglog polar streamplot hexbin pcolor tricontour errorbar clabel set_aspect violinplot set_axis_off spines text hatch plt axis plt.bar() plt.axis import figure pyplot highlight_text pypalettes plt.subplots() xlabel ylabel title legend colorbar savefig tight_layout grid set_xlim set_ylim plot scatter hist boxplot imshow cmap alpha bins tick_params annotate quiver contour barh stackplot subplots_adjust axhline axvline semilogx semilogy loglog polar streamplot hexbin pcolor tricontour errorbar clabel set_aspect violinplot set_axis_off spines text hatch plt axis plt.bar() plt.axis import figure pyplot highlight_text pypalettes plt.subplots() xlabel ylabel title legend colorbar savefig tight_layout grid set_xlim set_ylim plot scatter hist boxplot imshow cmap alpha bins tick_params annotate quiver contour barh stackplot subplots_adjust axhline axvline semilogx semilogy loglog polar streamplot hexbin pcolor tricontour errorbar clabel set_aspect violinplot set_axis_off spines text hatch plt axis plt.bar() plt.axis import figure pyplot highlight_text pypalettes plt.subplots() xlabel ylabel title legend colorbar savefig tight_layout grid set_xlim set_ylim plot scatter hist boxplot imshow cmap alpha bins tick_params annotate quiver contour barh stackplot subplots_adjust axhline axvline semilogx semilogy loglog polar streamplot hexbin pcolor tricontour errorbar clabel set_aspect violinplot set_axis_off spines text hatch plt axis plt.bar() plt.axis import figure pyplot highlight_text pypalettes plt.subplots() xlabel ylabel title legend colorbar savefig tight_layout grid set_xlim set_ylim plot scatter hist boxplot imshow cmap alpha bins tick_params annotate quiver contour barh stackplot subplots_adjust axhline axvline semilogx semilogy loglog polar streamplot hexbin pcolor tricontour errorbar clabel set_aspect violinplot set_axis_off spines text hatch plt axis plt.bar() plt.axis import figure pyplot highlight_text pypalettes plt.subplots() xlabel ylabel title legend colorbar savefig tight_layout grid set_xlim set_ylim plot scatter hist boxplot imshow cmap alpha bins tick_params annotate quiver contour barh stackplot subplots_adjust axhline axvline semilogx semilogy loglog polar streamplot hexbin pcolor tricontour errorbar clabel set_aspect violinplot set_axis_off spines text hatch plt axis plt.bar() plt.axis import figure pyplot highlight_text pypalettes plt.subplots() xlabel ylabel title legend colorbar savefig tight_layout grid set_xlim set_ylim plot scatter hist boxplot imshow cmap alpha bins tick_params annotate quiver contour barh stackplot subplots_adjust axhline axvline semilogx semilogy loglog polar streamplot hexbin pcolor tricontour errorbar clabel set_aspect violinplot set_axis_off spines text hatch plt axis plt.bar() plt.axis import figure pyplot highlight_text pypalettes plt.subplots() xlabel ylabel title legend colorbar savefig tight_layout grid set_xlim set_ylim plot scatter hist boxplot imshow cmap alpha bins tick_params annotate quiver contour barh stackplot subplots_adjust axhline axvline semilogx semilogy loglog polar streamplot hexbin pcolor tricontour errorbar clabel set_aspect violinplot set_axis_off spines text hatch plt axis plt.bar() plt.axis import figure pyplot highlight_text pypalettes plt.subplots() xlabel ylabel title legend colorbar savefig tight_layout grid set_xlim set_ylim plot scatter hist boxplot imshow cmap alpha bins tick_params annotate quiver contour barh stackplot subplots_adjust axhline axvline semilogx semilogy loglog polar streamplot hexbin pcolor tricontour errorbar clabel set_aspect violinplot set_axis_off spines text hatch plt axis plt.bar() plt.axis import figure pyplot highlight_text pypalettes plt.subplots() xlabel ylabel title legend colorbar savefig tight_layout grid set_xlim set_ylim plot scatter hist boxplot imshow cmap alpha bins tick_params annotate quiver contour barh stackplot subplots_adjust axhline axvline semilogx semilogy loglog polar streamplot hexbin pcolor tricontour errorbar clabel set_aspect violinplot set_axis_off spines text hatch plt axis plt.bar() plt.axis import figure pyplot highlight_text pypalettes plt.subplots() xlabel ylabel title legend colorbar savefig tight_layout grid set_xlim set_ylim plot scatter hist boxplot imshow cmap alpha bins tick_params annotate quiver contour barh stackplot subplots_adjust axhline axvline semilogx semilogy loglog polar streamplot hexbin pcolor tricontour errorbar clabel set_aspect violinplot set_axis_off spines text hatch plt axis plt.bar() plt.axis import figure pyplot highlight_text pypalettes plt.subplots() xlabel ylabel title legend colorbar savefig tight_layout grid set_xlim set_ylim plot scatter hist boxplot imshow cmap alpha bins tick_params annotate quiver contour barh stackplot subplots_adjust axhline axvline semilogx semilogy loglog polar streamplot hexbin pcolor tricontour errorbar clabel set_aspect violinplot set_axis_off spines text hatch plt axis plt.bar() plt.axis import figure pyplot highlight_text pypalettes plt.subplots() xlabel ylabel title legend colorbar savefig tight_layout grid set_xlim set_ylim plot scatter hist boxplot imshow cmap alpha bins tick_params annotate quiver contour barh stackplot subplots_adjust axhline axvline semilogx semilogy loglog polar streamplot hexbin pcolor tricontour errorbar clabel set_aspect violinplot set_axis_off spines text hatch plt axis plt.bar() plt.axis import figure pyplot highlight_text pypalettes plt.subplots() xlabel ylabel title legend colorbar savefig tight_layout grid set_xlim set_ylim plot scatter hist boxplot imshow cmap alpha bins tick_params annotate quiver contour barh stackplot subplots_adjust axhline axvline semilogx semilogy loglog polar streamplot hexbin pcolor tricontour errorbar clabel set_aspect violinplot set_axis_off spines text hatch plt axis plt.bar() plt.axis import figure pyplot highlight_text pypalettes plt.subplots() xlabel ylabel title legend colorbar savefig tight_layout grid set_xlim set_ylim plot scatter hist boxplot imshow cmap alpha bins tick_params annotate quiver contour barh stackplot subplots_adjust axhline axvline semilogx semilogy loglog polar streamplot hexbin pcolor tricontour errorbar clabel set_aspect violinplot set_axis_off spines text hatch plt axis plt.bar() plt.axis import figure pyplot highlight_text pypalettes plt.subplots() xlabel ylabel title legend colorbar savefig tight_layout grid set_xlim set_ylim plot scatter hist boxplot imshow cmap alpha bins tick_params annotate quiver contour barh stackplot subplots_adjust axhline axvline semilogx semilogy loglog polar streamplot hexbin pcolor tricontour errorbar clabel set_aspect violinplot set_axis_off spines text hatch plt axis plt.bar() plt.axis import figure pyplot highlight_text pypalettes plt.subplots() xlabel ylabel title legend colorbar savefig tight_layout grid set_xlim set_ylim plot scatter hist boxplot imshow cmap alpha bins tick_params annotate quiver contour barh stackplot subplots_adjust axhline axvline semilogx semilogy loglog polar streamplot hexbin pcolor tricontour errorbar clabel set_aspect violinplot set_axis_off spines text hatch plt axis plt.bar() plt.axis import figure pyplot highlight_text pypalettes plt.subplots() xlabel ylabel title legend colorbar savefig tight_layout grid set_xlim set_ylim plot scatter hist boxplot imshow cmap alpha bins tick_params annotate quiver contour barh stackplot subplots_adjust axhline axvline semilogx semilogy loglog polar streamplot hexbin pcolor tricontour errorbar clabel set_aspect violinplot set_axis_off spines text hatch plt axis plt.bar() plt.axis import figure pyplot highlight_text pypalettes plt.subplots() xlabel ylabel title legend colorbar savefig tight_layout grid set_xlim set_ylim plot scatter hist boxplot imshow cmap alpha bins tick_params annotate quiver contour barh stackplot subplots_adjust axhline axvline semilogx semilogy loglog polar streamplot hexbin pcolor tricontour errorbar clabel set_aspect violinplot set_axis_off spines text hatch plt axis plt.bar() plt.axis import figure pyplot highlight_text pypalettes plt.subplots() xlabel ylabel title legend colorbar savefig tight_layout grid set_xlim set_ylim plot scatter hist boxplot imshow cmap alpha bins tick_params annotate quiver contour barh stackplot subplots_adjust axhline axvline semilogx semilogy loglog polar streamplot hexbin pcolor tricontour errorbar clabel set_aspect violinplot set_axis_off spines text hatch plt axis plt.bar() plt.axis import figure pyplot highlight_text pypalettes plt.subplots() xlabel ylabel title legend colorbar savefig tight_layout grid set_xlim set_ylim plot scatter hist boxplot imshow cmap alpha bins tick_params annotate quiver contour barh stackplot subplots_adjust axhline axvline semilogx semilogy loglog polar streamplot hexbin pcolor tricontour errorbar clabel set_aspect violinplot set_axis_off spines text hatch plt axis plt.bar() plt.axis import figure pyplot highlight_text pypalettes plt.subplots() xlabel ylabel title legend colorbar savefig tight_layout grid set_xlim set_ylim plot scatter hist boxplot imshow cmap alpha bins tick_params annotate quiver contour barh stackplot subplots_adjust axhline axvline semilogx semilogy loglog polar streamplot hexbin pcolor tricontour errorbar clabel set_aspect violinplot set_axis_off spines text hatch plt axis plt.bar() plt.axis import figure pyplot highlight_text pypalettes plt.subplots() xlabel ylabel title legend colorbar savefig tight_layout grid set_xlim set_ylim plot scatter hist boxplot imshow cmap alpha bins tick_params annotate quiver contour barh stackplot subplots_adjust axhline axvline semilogx semilogy loglog polar streamplot hexbin pcolor tricontour errorbar clabel set_aspect violinplot set_axis_off spines text hatch plt axis plt.bar() plt.axis import figure pyplot highlight_text pypalettes plt.subplots() xlabel ylabel title legend colorbar savefig tight_layout grid set_xlim set_ylim plot scatter hist boxplot imshow cmap alpha bins tick_params annotate quiver contour barh stackplot subplots_adjust axhline axvline semilogx semilogy loglog polar streamplot hexbin pcolor tricontour errorbar clabel set_aspect violinplot set_axis_off spines text hatch plt axis plt.bar() plt.axis import figure pyplot highlight_text pypalettes plt.subplots() xlabel ylabel title legend colorbar savefig tight_layout grid set_xlim set_ylim plot scatter hist boxplot imshow cmap alpha bins tick_params annotate quiver contour barh stackplot subplots_adjust axhline axvline semilogx semilogy loglog polar streamplot hexbin pcolor tricontour errorbar clabel set_aspect violinplot set_axis_off spines text hatch plt axis plt.bar() plt.axis import figure pyplot highlight_text pypalettes plt.subplots() xlabel ylabel title legend colorbar savefig tight_layout grid set_xlim set_ylim plot scatter hist boxplot imshow cmap alpha bins tick_params annotate quiver contour barh stackplot subplots_adjust axhline axvline semilogx semilogy loglog polar streamplot hexbin pcolor tricontour errorbar clabel set_aspect violinplot set_axis_off spines text hatch plt axis plt.bar() plt.axis import figure pyplot highlight_text pypalettes plt.subplots() xlabel ylabel title legend colorbar savefig tight_layout grid set_xlim set_ylim plot scatter hist boxplot imshow cmap alpha bins tick_params annotate quiver contour barh stackplot subplots_adjust axhline axvline semilogx semilogy loglog polar streamplot hexbin pcolor tricontour errorbar clabel set_aspect violinplot set_axis_off spines text hatch plt axis plt.bar() plt.axis import figure pyplot highlight_text pypalettes plt.subplots() xlabel ylabel title legend colorbar savefig tight_layout grid set_xlim set_ylim plot scatter hist boxplot imshow cmap alpha bins tick_params annotate quiver contour barh stackplot subplots_adjust axhline axvline semilogx semilogy loglog polar streamplot hexbin pcolor tricontour errorbar clabel set_aspect violinplot set_axis_off spines text hatch plt axis plt.bar() plt.axis import figure pyplot highlight_text pypalettes plt.subplots() xlabel ylabel title legend colorbar savefig tight_layout grid set_xlim set_ylim plot scatter hist boxplot imshow cmap alpha bins tick_params annotate quiver contour barh stackplot subplots_adjust axhline axvline semilogx semilogy loglog polar streamplot hexbin pcolor tricontour errorbar clabel set_aspect violinplot set_axis_off spines text hatch plt axis plt.bar() plt.axis import figure pyplot highlight_text pypalettes plt.subplots() xlabel ylabel title legend colorbar savefig tight_layout grid set_xlim set_ylim plot scatter hist boxplot imshow cmap alpha bins tick_params annotate quiver contour barh stackplot subplots_adjust axhline axvline semilogx semilogy loglog polar streamplot hexbin pcolor tricontour errorbar clabel set_aspect violinplot set_axis_off spines text hatch plt axis plt.bar() plt.axis import figure pyplot highlight_text pypalettes plt.subplots() xlabel ylabel title legend colorbar savefig tight_layout grid set_xlim set_ylim plot scatter hist boxplot imshow cmap alpha bins tick_params annotate quiver contour barh stackplot subplots_adjust axhline axvline semilogx semilogy loglog polar streamplot hexbin pcolor tricontour errorbar clabel set_aspect violinplot set_axis_off spines text hatch plt axis plt.bar() plt.axis import figure pyplot highlight_text pypalettes plt.subplots() xlabel ylabel title legend colorbar savefig tight_layout grid set_xlim set_ylim plot scatter hist boxplot imshow cmap alpha bins tick_params annotate quiver contour barh stackplot subplots_adjust axhline axvline semilogx semilogy loglog polar streamplot hexbin pcolor tricontour errorbar clabel set_aspect violinplot set_axis_off spines text hatch plt axis plt.bar() plt.axis import figure pyplot highlight_text pypalettes plt.subplots() xlabel ylabel title legend colorbar savefig tight_layout grid set_xlim set_ylim plot scatter hist boxplot imshow cmap alpha bins tick_params annotate quiver contour barh stackplot subplots_adjust axhline axvline semilogx semilogy loglog polar streamplot hexbin pcolor tricontour errorbar clabel set_aspect violinplot set_axis_off spines text hatch plt axis plt.bar() plt.axis import figure pyplot highlight_text pypalettes plt.subplots() xlabel ylabel title legend colorbar savefig tight_layout grid set_xlim set_ylim plot scatter hist boxplot imshow cmap alpha bins tick_params annotate quiver contour barh stackplot subplots_adjust axhline axvline semilogx semilogy loglog polar streamplot hexbin pcolor tricontour errorbar clabel set_aspect violinplot set_axis_off spines text hatch plt axis plt.bar() plt.axis import figure pyplot highlight_text pypalettes plt.subplots() xlabel ylabel title legend colorbar savefig tight_layout grid set_xlim set_ylim plot scatter hist boxplot imshow cmap alpha bins tick_params annotate quiver contour barh stackplot subplots_adjust axhline axvline semilogx semilogy loglog polar streamplot hexbin pcolor tricontour errorbar clabel set_aspect violinplot set_axis_off spines text hatch plt axis plt.bar() plt.axis import figure pyplot highlight_text pypalettes plt.subplots() xlabel ylabel title legend colorbar savefig tight_layout grid set_xlim set_ylim plot scatter hist boxplot imshow cmap alpha bins tick_params annotate quiver contour barh stackplot subplots_adjust axhline axvline semilogx semilogy loglog polar streamplot hexbin pcolor tricontour errorbar clabel set_aspect violinplot set_axis_off spines text hatch plt axis plt.bar() plt.axis import figure pyplot highlight_text pypalettes plt.subplots() xlabel ylabel title legend colorbar savefig tight_layout grid set_xlim set_ylim plot scatter hist boxplot imshow cmap alpha bins tick_params annotate quiver contour barh stackplot subplots_adjust axhline axvline semilogx semilogy loglog polar streamplot hexbin pcolor tricontour errorbar clabel set_aspect violinplot set_axis_off spines text hatch plt axis plt.bar() plt.axis import figure pyplot highlight_text pypalettes plt.subplots() xlabel ylabel title legend colorbar savefig tight_layout grid set_xlim set_ylim plot scatter hist boxplot imshow cmap alpha bins tick_params annotate quiver contour barh stackplot subplots_adjust axhline axvline semilogx semilogy loglog polar streamplot hexbin pcolor tricontour errorbar clabel set_aspect violinplot set_axis_off spines text hatch plt axis plt.bar() plt.axis import figure pyplot highlight_text pypalettes plt.subplots() xlabel ylabel title legend colorbar savefig tight_layout grid set_xlim set_ylim plot scatter hist boxplot imshow cmap alpha bins tick_params annotate quiver contour barh stackplot subplots_adjust axhline axvline semilogx semilogy loglog polar streamplot hexbin pcolor tricontour errorbar clabel set_aspect violinplot set_axis_off spines text hatch plt axis plt.bar() plt.axis import figure pyplot highlight_text pypalettes plt.subplots() xlabel ylabel title legend colorbar savefig tight_layout grid set_xlim set_ylim plot scatter hist boxplot imshow cmap alpha bins tick_params annotate quiver contour barh stackplot subplots_adjust axhline axvline semilogx semilogy loglog polar streamplot hexbin pcolor tricontour errorbar clabel set_aspect violinplot set_axis_off spines text hatch plt axis plt.bar() plt.axis import figure pyplot highlight_text pypalettes plt.subplots() xlabel ylabel title legend colorbar savefig tight_layout grid set_xlim set_ylim plot scatter hist boxplot imshow cmap alpha bins tick_params annotate quiver contour barh stackplot subplots_adjust axhline axvline semilogx semilogy loglog polar streamplot hexbin pcolor tricontour errorbar clabel set_aspect violinplot set_axis_off spines text hatch plt axis plt.bar() plt.axis import figure pyplot highlight_text pypalettes plt.subplots() xlabel ylabel title legend colorbar savefig tight_layout grid set_xlim set_ylim plot scatter hist boxplot imshow cmap alpha bins tick_params annotate quiver contour barh stackplot subplots_adjust axhline axvline semilogx semilogy loglog polar streamplot hexbin pcolor tricontour errorbar clabel set_aspect violinplot set_axis_off spines text hatch plt axis plt.bar() plt.axis import figure pyplot highlight_text pypalettes plt.subplots() xlabel ylabel title legend colorbar savefig tight_layout grid set_xlim set_ylim plot scatter hist boxplot imshow cmap alpha bins tick_params annotate quiver contour barh stackplot subplots_adjust axhline axvline semilogx semilogy loglog polar streamplot hexbin pcolor tricontour errorbar clabel set_aspect violinplot set_axis_off spines text hatch plt axis plt.bar() plt.axis import figure pyplot highlight_text pypalettes plt.subplots() xlabel ylabel title legend colorbar savefig tight_layout grid set_xlim set_ylim plot scatter hist boxplot imshow cmap alpha bins tick_params annotate quiver contour barh stackplot subplots_adjust axhline axvline semilogx semilogy loglog polar streamplot hexbin pcolor tricontour errorbar clabel set_aspect violinplot set_axis_off spines text hatch plt axis plt.bar() plt.axis import figure pyplot highlight_text pypalettes plt.subplots() xlabel ylabel title legend colorbar savefig tight_layout grid set_xlim set_ylim plot scatter hist boxplot imshow cmap alpha bins tick_params annotate quiver contour barh stackplot subplots_adjust axhline axvline semilogx semilogy loglog polar streamplot hexbin pcolor tricontour errorbar clabel set_aspect violinplot set_axis_off spines text hatch plt axis plt.bar() plt.axis import figure pyplot highlight_text pypalettes plt.subplots() xlabel ylabel title legend colorbar savefig tight_layout grid set_xlim set_ylim plot scatter hist boxplot imshow cmap alpha bins tick_params annotate quiver contour barh stackplot subplots_adjust axhline axvline semilogx semilogy loglog polar streamplot hexbin pcolor tricontour errorbar clabel set_aspect violinplot set_axis_off spines text hatch plt axis plt.bar() plt.axis import figure pyplot highlight_text pypalettes plt.subplots() xlabel ylabel title legend colorbar savefig tight_layout grid set_xlim set_ylim plot scatter hist boxplot imshow cmap alpha bins tick_params annotate quiver contour barh stackplot subplots_adjust axhline axvline semilogx semilogy loglog polar streamplot hexbin pcolor tricontour errorbar clabel set_aspect violinplot set_axis_off spines text hatch plt axis plt.bar() plt.axis import figure pyplot highlight_text pypalettes plt.subplots() xlabel ylabel title legend colorbar savefig tight_layout grid set_xlim set_ylim plot scatter hist boxplot imshow cmap alpha bins tick_params annotate quiver contour barh stackplot subplots_adjust axhline axvline semilogx semilogy loglog polar streamplot hexbin pcolor tricontour errorbar clabel set_aspect violinplot set_axis_off spines text hatch plt axis plt.bar() plt.axis import figure pyplot highlight_text pypalettes plt.subplots() xlabel ylabel title legend colorbar savefig tight_layout grid set_xlim set_ylim plot scatter hist boxplot imshow cmap alpha bins tick_params annotate quiver contour barh stackplot subplots_adjust axhline axvline semilogx semilogy loglog polar streamplot hexbin pcolor tricontour errorbar clabel set_aspect violinplot set_axis_off spines text hatch plt axis plt.bar() plt.axis import figure pyplot highlight_text pypalettes plt.subplots() xlabel ylabel title legend colorbar savefig tight_layout grid set_xlim set_ylim plot scatter hist boxplot imshow cmap alpha bins tick_params annotate quiver contour barh stackplot subplots_adjust axhline axvline semilogx semilogy loglog polar streamplot hexbin pcolor tricontour errorbar clabel set_aspect violinplot set_axis_off spines text hatch plt axis plt.bar() plt.axis import figure pyplot highlight_text pypalettes plt.subplots() xlabel ylabel title legend colorbar savefig tight_layout grid set_xlim set_ylim plot scatter hist boxplot imshow cmap alpha bins tick_params annotate quiver contour barh stackplot subplots_adjust axhline axvline semilogx semilogy loglog polar streamplot hexbin pcolor tricontour errorbar clabel set_aspect violinplot set_axis_off spines text hatch plt axis plt.bar() plt.axis import figure pyplot highlight_text pypalettes plt.subplots() xlabel ylabel title legend colorbar savefig tight_layout grid set_xlim set_ylim plot scatter hist boxplot imshow cmap alpha bins tick_params annotate quiver contour barh stackplot subplots_adjust axhline axvline semilogx semilogy loglog polar streamplot hexbin pcolor tricontour errorbar clabel set_aspect violinplot set_axis_off spines text hatch plt axis plt.bar() plt.axis import figure pyplot highlight_text pypalettes plt.subplots() xlabel ylabel title legend colorbar savefig tight_layout grid set_xlim set_ylim plot scatter hist boxplot imshow cmap alpha bins tick_params annotate quiver contour barh stackplot subplots_adjust axhline axvline semilogx semilogy loglog polar streamplot hexbin pcolor tricontour errorbar clabel set_aspect violinplot set_axis_off spines text hatch plt axis plt.bar() plt.axis import figure pyplot highlight_text pypalettes plt.subplots() xlabel ylabel title legend colorbar savefig tight_layout grid set_xlim set_ylim plot scatter hist boxplot imshow cmap alpha bins tick_params annotate quiver contour barh stackplot subplots_adjust axhline axvline semilogx semilogy loglog polar streamplot hexbin pcolor tricontour errorbar clabel set_aspect violinplot set_axis_off spines text hatch plt axis plt.bar() plt.axis import figure pyplot highlight_text pypalettes plt.subplots() xlabel ylabel title legend colorbar savefig tight_layout grid set_xlim set_ylim plot scatter hist boxplot imshow cmap alpha bins tick_params annotate quiver contour barh stackplot subplots_adjust axhline axvline semilogx semilogy loglog polar streamplot hexbin pcolor tricontour errorbar clabel set_aspect violinplot set_axis_off spines text hatch plt axis plt.bar() plt.axis import figure pyplot highlight_text pypalettes plt.subplots() xlabel ylabel title legend colorbar savefig tight_layout grid set_xlim set_ylim plot scatter hist boxplot imshow cmap alpha bins tick_params annotate quiver contour barh stackplot subplots_adjust axhline axvline semilogx semilogy loglog polar streamplot hexbin pcolor tricontour errorbar clabel set_aspect violinplot set_axis_off spines text hatch plt axis plt.bar() plt.axis import figure pyplot highlight_text pypalettes plt.subplots() xlabel ylabel title legend colorbar savefig tight_layout grid set_xlim set_ylim plot scatter hist boxplot imshow cmap alpha bins tick_params annotate quiver contour barh stackplot subplots_adjust axhline axvline semilogx semilogy loglog polar streamplot hexbin pcolor tricontour errorbar clabel set_aspect violinplot set_axis_off spines text hatch plt axis plt.bar() plt.axis import figure pyplot highlight_text pypalettes plt.subplots() xlabel ylabel title legend colorbar savefig tight_layout grid set_xlim set_ylim plot scatter hist boxplot imshow cmap alpha bins tick_params annotate quiver contour barh stackplot subplots_adjust axhline axvline semilogx semilogy loglog polar streamplot hexbin pcolor tricontour errorbar clabel set_aspect violinplot set_axis_off spines text hatch plt axis plt.bar() plt.axis import figure pyplot highlight_text pypalettes plt.subplots() xlabel ylabel title legend colorbar savefig tight_layout grid set_xlim set_ylim plot scatter hist boxplot imshow cmap alpha bins tick_params annotate quiver contour barh stackplot subplots_adjust axhline axvline semilogx semilogy loglog polar streamplot hexbin pcolor tricontour errorbar clabel set_aspect violinplot set_axis_off spines text hatch plt axis plt.bar() plt.axis import figure pyplot highlight_text pypalettes plt.subplots() xlabel ylabel title legend colorbar savefig tight_layout grid set_xlim set_ylim plot scatter hist boxplot imshow cmap alpha bins tick_params annotate quiver contour barh stackplot subplots_adjust axhline axvline semilogx semilogy loglog polar streamplot hexbin pcolor tricontour errorbar clabel set_aspect violinplot set_axis_off spines text hatch plt axis plt.bar() plt.axis import figure pyplot highlight_text pypalettes plt.subplots() xlabel ylabel title legend colorbar savefig tight_layout grid set_xlim set_ylim plot scatter hist boxplot imshow cmap alpha bins tick_params annotate quiver contour barh stackplot subplots_adjust axhline axvline semilogx semilogy loglog polar streamplot hexbin pcolor tricontour errorbar clabel set_aspect violinplot set_axis_off spines text hatch plt axis plt.bar() plt.axis import figure pyplot highlight_text pypalettes plt.subplots() xlabel ylabel title legend colorbar savefig tight_layout grid set_xlim set_ylim plot scatter hist boxplot imshow cmap alpha bins tick_params annotate quiver contour barh stackplot subplots_adjust axhline axvline semilogx semilogy loglog polar streamplot hexbin pcolor tricontour errorbar clabel set_aspect violinplot set_axis_off spines text hatch plt axis plt.bar() plt.axis import figure pyplot highlight_text pypalettes plt.subplots() xlabel ylabel title legend colorbar savefig tight_layout grid set_xlim set_ylim plot scatter hist boxplot imshow cmap alpha bins tick_params annotate quiver contour barh stackplot subplots_adjust axhline axvline semilogx semilogy loglog polar streamplot hexbin pcolor tricontour errorbar clabel set_aspect violinplot set_axis_off spines text hatch plt axis plt.bar() plt.axis import figure pyplot highlight_text pypalettes plt.subplots() xlabel ylabel title legend colorbar savefig tight_layout grid set_xlim set_ylim plot scatter hist boxplot imshow cmap alpha bins tick_params annotate quiver contour barh stackplot subplots_adjust axhline axvline semilogx semilogy loglog polar streamplot hexbin pcolor tricontour errorbar clabel set_aspect violinplot set_axis_off spines text hatch plt axis plt.bar() plt.axis import figure pyplot highlight_text pypalettes plt.subplots() xlabel ylabel title legend colorbar savefig tight_layout grid set_xlim set_ylim plot scatter hist boxplot imshow cmap alpha bins tick_params annotate quiver contour barh stackplot subplots_adjust axhline axvline semilogx semilogy loglog polar streamplot hexbin pcolor tricontour errorbar clabel set_aspect violinplot set_axis_off spines text hatch plt axis plt.bar() plt.axis import figure pyplot highlight_text pypalettes plt.subplots() xlabel ylabel title legend colorbar savefig tight_layout grid set_xlim set_ylim plot scatter hist boxplot imshow cmap alpha bins tick_params annotate quiver contour barh stackplot subplots_adjust axhline axvline semilogx semilogy loglog polar streamplot hexbin pcolor tricontour errorbar clabel set_aspect violinplot set_axis_off spines text hatch plt axis plt.bar() plt.axis import figure pyplot highlight_text pypalettes plt.subplots() xlabel ylabel title legend colorbar savefig tight_layout grid set_xlim set_ylim plot scatter hist boxplot imshow cmap alpha bins tick_params annotate quiver contour barh stackplot subplots_adjust axhline axvline semilogx semilogy loglog polar streamplot hexbin pcolor tricontour errorbar clabel set_aspect violinplot set_axis_off spines text hatch plt axis plt.bar() plt.axis import figure pyplot highlight_text pypalettes plt.subplots() xlabel ylabel title legend colorbar savefig tight_layout grid set_xlim set_ylim plot scatter hist boxplot imshow cmap alpha bins tick_params annotate quiver contour barh stackplot subplots_adjust axhline axvline semilogx semilogy loglog polar streamplot hexbin pcolor tricontour errorbar clabel set_aspect violinplot set_axis_off spines text hatch plt axis plt.bar() plt.axis import figure pyplot highlight_text pypalettes plt.subplots() xlabel ylabel title legend colorbar savefig tight_layout grid set_xlim set_ylim plot scatter hist boxplot imshow cmap alpha bins tick_params annotate quiver contour barh stackplot subplots_adjust axhline axvline semilogx semilogy loglog polar streamplot hexbin pcolor tricontour errorbar clabel set_aspect violinplot set_axis_off spines text hatch plt axis plt.bar() plt.axis import figure pyplot highlight_text pypalettes plt.subplots() xlabel ylabel title legend colorbar savefig tight_layout grid set_xlim set_ylim plot scatter hist boxplot imshow cmap alpha bins tick_params annotate quiver contour barh stackplot subplots_adjust axhline axvline semilogx semilogy loglog polar streamplot hexbin pcolor tricontour errorbar clabel set_aspect violinplot set_axis_off spines text hatch plt axis plt.bar() plt.axis import figure pyplot highlight_text pypalettes plt.subplots() xlabel ylabel title legend colorbar savefig tight_layout grid set_xlim set_ylim plot scatter hist boxplot imshow cmap alpha bins tick_params annotate quiver contour barh stackplot subplots_adjust axhline axvline semilogx semilogy loglog polar streamplot hexbin pcolor tricontour errorbar clabel set_aspect violinplot set_axis_off spines text hatch plt axis plt.bar() plt.axis import figure pyplot highlight_text pypalettes plt.subplots() xlabel ylabel title legend colorbar savefig tight_layout grid set_xlim set_ylim plot scatter hist boxplot imshow cmap alpha bins tick_params annotate quiver contour barh stackplot subplots_adjust axhline axvline semilogx semilogy loglog polar streamplot hexbin pcolor tricontour errorbar clabel set_aspect violinplot set_axis_off spines text hatch plt axis plt.bar() plt.axis import figure pyplot highlight_text pypalettes plt.subplots() xlabel ylabel title legend colorbar savefig tight_layout grid set_xlim set_ylim plot scatter hist boxplot imshow cmap alpha bins tick_params annotate quiver contour barh stackplot subplots_adjust axhline axvline semilogx semilogy loglog polar streamplot hexbin pcolor tricontour errorbar clabel set_aspect violinplot set_axis_off spines text hatch plt axis plt.bar() plt.axis import figure pyplot highlight_text pypalettes plt.subplots() xlabel ylabel title legend colorbar savefig tight_layout grid set_xlim set_ylim plot scatter hist boxplot imshow cmap alpha bins tick_params annotate quiver contour barh stackplot subplots_adjust axhline axvline semilogx semilogy loglog polar streamplot hexbin pcolor tricontour errorbar clabel set_aspect violinplot set_axis_off spines text hatch plt axis plt.bar() plt.axis import figure pyplot highlight_text pypalettes plt.subplots() xlabel ylabel title legend colorbar savefig tight_layout grid set_xlim set_ylim plot scatter hist boxplot imshow cmap alpha bins tick_params annotate quiver contour barh stackplot subplots_adjust axhline axvline semilogx semilogy loglog polar streamplot hexbin pcolor tricontour errorbar clabel set_aspect violinplot set_axis_off spines text hatch plt axis plt.bar() plt.axis import figure pyplot highlight_text pypalettes plt.subplots() xlabel ylabel title legend colorbar savefig tight_layout grid set_xlim set_ylim plot scatter hist boxplot imshow cmap alpha bins tick_params annotate quiver contour barh stackplot subplots_adjust axhline axvline semilogx semilogy loglog polar streamplot hexbin pcolor tricontour errorbar clabel set_aspect violinplot set_axis_off spines text hatch plt axis plt.bar() plt.axis import figure pyplot highlight_text pypalettes plt.subplots() xlabel ylabel title legend colorbar savefig tight_layout grid set_xlim set_ylim plot scatter hist boxplot imshow cmap alpha bins tick_params annotate quiver contour barh stackplot subplots_adjust axhline axvline semilogx semilogy loglog polar streamplot hexbin pcolor tricontour errorbar clabel set_aspect violinplot set_axis_off spines text hatch plt axis plt.bar() plt.axis import figure pyplot highlight_text pypalettes plt.subplots() xlabel ylabel title legend colorbar savefig tight_layout grid set_xlim set_ylim plot scatter hist boxplot imshow cmap alpha bins tick_params annotate quiver contour barh stackplot subplots_adjust axhline axvline semilogx semilogy loglog polar streamplot hexbin pcolor tricontour errorbar clabel set_aspect violinplot set_axis_off spines text hatch plt axis plt.bar() plt.axis import figure pyplot highlight_text pypalettes plt.subplots() xlabel ylabel title legend colorbar savefig tight_layout grid set_xlim set_ylim plot scatter hist boxplot imshow cmap alpha bins tick_params annotate quiver contour barh stackplot subplots_adjust axhline axvline semilogx semilogy loglog polar streamplot hexbin pcolor tricontour errorbar clabel set_aspect violinplot set_axis_off spines text hatch plt axis plt.bar() plt.axis import figure pyplot highlight_text pypalettes plt.subplots() xlabel ylabel title legend colorbar savefig tight_layout grid set_xlim set_ylim plot scatter hist boxplot imshow cmap alpha bins tick_params annotate quiver contour barh stackplot subplots_adjust axhline axvline semilogx semilogy loglog polar streamplot hexbin pcolor tricontour errorbar clabel set_aspect violinplot set_axis_off spines text hatch plt axis plt.bar() plt.axis import figure pyplot highlight_text pypalettes plt.subplots() xlabel ylabel title legend colorbar savefig tight_layout grid set_xlim set_ylim plot scatter hist boxplot imshow cmap alpha bins tick_params annotate quiver contour barh stackplot subplots_adjust axhline axvline semilogx semilogy loglog polar streamplot hexbin pcolor tricontour errorbar clabel set_aspect violinplot set_axis_off spines text hatch plt axis plt.bar() plt.axis import figure pyplot highlight_text pypalettes plt.subplots() xlabel ylabel title legend colorbar savefig tight_layout grid set_xlim set_ylim plot scatter hist boxplot imshow cmap alpha bins tick_params annotate quiver contour barh stackplot subplots_adjust axhline axvline semilogx semilogy loglog polar streamplot hexbin pcolor tricontour errorbar clabel set_aspect violinplot set_axis_off spines text hatch plt axis plt.bar() plt.axis import figure pyplot highlight_text pypalettes plt.subplots() xlabel ylabel title legend colorbar savefig tight_layout grid set_xlim set_ylim plot scatter hist boxplot imshow cmap alpha bins tick_params annotate quiver contour barh stackplot subplots_adjust axhline axvline semilogx semilogy loglog polar streamplot hexbin pcolor tricontour errorbar clabel set_aspect violinplot set_axis_off spines text hatch plt axis plt.bar() plt.axis import figure pyplot highlight_text pypalettes plt.subplots() xlabel ylabel title legend colorbar savefig tight_layout grid set_xlim set_ylim plot scatter hist boxplot imshow cmap alpha bins tick_params annotate quiver contour barh stackplot subplots_adjust axhline axvline semilogx semilogy loglog polar streamplot hexbin pcolor tricontour errorbar clabel set_aspect violinplot set_axis_off spines text hatch plt axis plt.bar() plt.axis import figure pyplot highlight_text pypalettes plt.subplots() xlabel ylabel title legend colorbar savefig tight_layout grid set_xlim set_ylim plot scatter hist boxplot imshow cmap alpha bins tick_params annotate quiver contour barh stackplot subplots_adjust axhline axvline semilogx semilogy loglog polar streamplot hexbin pcolor tricontour errorbar clabel set_aspect violinplot set_axis_off spines text hatch plt axis plt.bar() plt.axis import figure pyplot highlight_text pypalettes plt.subplots() xlabel ylabel title legend colorbar savefig tight_layout grid set_xlim set_ylim plot scatter hist boxplot imshow cmap alpha bins tick_params annotate quiver contour barh stackplot subplots_adjust axhline axvline semilogx semilogy loglog polar streamplot hexbin pcolor tricontour errorbar clabel set_aspect violinplot set_axis_off spines text hatch plt axis plt.bar() plt.axis import figure pyplot highlight_text pypalettes plt.subplots() xlabel ylabel title legend colorbar savefig tight_layout grid set_xlim set_ylim plot scatter hist boxplot imshow cmap alpha bins tick_params annotate quiver contour barh stackplot subplots_adjust axhline axvline semilogx semilogy loglog polar streamplot hexbin pcolor tricontour errorbar clabel set_aspect violinplot set_axis_off spines text hatch plt axis plt.bar() plt.axis import figure pyplot highlight_text pypalettes plt.subplots() xlabel ylabel title legend colorbar savefig tight_layout grid set_xlim set_ylim plot scatter hist boxplot imshow cmap alpha bins tick_params annotate quiver contour barh stackplot subplots_adjust axhline axvline semilogx semilogy loglog polar streamplot hexbin pcolor tricontour errorbar clabel set_aspect violinplot set_axis_off spines text hatch plt axis plt.bar() plt.axis import figure pyplot highlight_text pypalettes plt.subplots() xlabel ylabel title legend colorbar savefig tight_layout grid set_xlim set_ylim plot scatter hist boxplot imshow cmap alpha bins tick_params annotate quiver contour barh stackplot subplots_adjust axhline axvline semilogx semilogy loglog polar streamplot hexbin pcolor tricontour errorbar clabel set_aspect violinplot set_axis_off spines text hatch plt axis plt.bar() plt.axis import figure pyplot highlight_text pypalettes plt.subplots() xlabel ylabel title legend colorbar savefig tight_layout grid set_xlim set_ylim plot scatter hist boxplot imshow cmap alpha bins tick_params annotate quiver contour barh stackplot subplots_adjust axhline axvline semilogx semilogy loglog polar streamplot hexbin pcolor tricontour errorbar clabel set_aspect violinplot set_axis_off spines text hatch plt axis plt.bar() plt.axis import figure pyplot highlight_text pypalettes plt.subplots() xlabel ylabel title legend colorbar savefig tight_layout grid set_xlim set_ylim plot scatter hist boxplot imshow cmap alpha bins tick_params annotate quiver contour barh stackplot subplots_adjust axhline axvline semilogx semilogy loglog polar streamplot hexbin pcolor tricontour errorbar clabel set_aspect violinplot set_axis_off spines text hatch plt axis plt.bar() plt.axis import figure pyplot highlight_text pypalettes plt.subplots() xlabel ylabel title legend colorbar savefig tight_layout grid set_xlim set_ylim plot scatter hist boxplot imshow cmap alpha bins tick_params annotate quiver contour barh stackplot subplots_adjust axhline axvline semilogx semilogy loglog polar streamplot hexbin pcolor tricontour errorbar clabel set_aspect violinplot set_axis_off spines text hatch plt axis plt.bar() plt.axis import figure pyplot highlight_text pypalettes plt.subplots() xlabel ylabel title legend colorbar savefig tight_layout grid set_xlim set_ylim plot scatter hist boxplot imshow cmap alpha bins tick_params annotate quiver contour barh stackplot subplots_adjust axhline axvline semilogx semilogy loglog polar streamplot hexbin pcolor tricontour errorbar clabel set_aspect violinplot set_axis_off spines text hatch plt axis plt.bar() plt.axis import figure pyplot highlight_text pypalettes plt.subplots() xlabel ylabel title legend colorbar savefig tight_layout grid set_xlim set_ylim plot scatter hist boxplot imshow cmap alpha bins tick_params annotate quiver contour barh stackplot subplots_adjust axhline axvline semilogx semilogy loglog polar streamplot hexbin pcolor tricontour errorbar clabel set_aspect violinplot set_axis_off spines text hatch plt axis plt.bar() plt.axis import figure pyplot highlight_text pypalettes plt.subplots() xlabel ylabel title legend colorbar savefig tight_layout grid set_xlim set_ylim plot scatter hist boxplot imshow cmap alpha bins tick_params annotate quiver contour barh stackplot subplots_adjust axhline axvline semilogx semilogy loglog polar streamplot hexbin pcolor tricontour errorbar clabel set_aspect violinplot set_axis_off spines text hatch plt axis plt.bar() plt.axis import figure pyplot highlight_text pypalettes plt.subplots() xlabel ylabel title legend colorbar savefig tight_layout grid set_xlim set_ylim plot scatter hist boxplot imshow cmap alpha bins tick_params annotate quiver contour barh stackplot subplots_adjust axhline axvline semilogx semilogy loglog polar streamplot hexbin pcolor tricontour errorbar clabel set_aspect violinplot set_axis_off spines text hatch plt axis plt.bar() plt.axis import figure pyplot highlight_text pypalettes plt.subplots() xlabel ylabel title legend colorbar savefig tight_layout grid set_xlim set_ylim plot scatter hist boxplot imshow cmap alpha bins tick_params annotate quiver contour barh stackplot subplots_adjust axhline axvline semilogx semilogy loglog polar streamplot hexbin pcolor tricontour errorbar clabel set_aspect violinplot set_axis_off spines text hatch plt axis plt.bar() plt.axis import figure pyplot highlight_text pypalettes plt.subplots() xlabel ylabel title legend colorbar savefig tight_layout grid set_xlim set_ylim plot scatter hist boxplot imshow cmap alpha bins tick_params annotate quiver contour barh stackplot subplots_adjust axhline axvline semilogx semilogy loglog polar streamplot hexbin pcolor tricontour errorbar clabel set_aspect violinplot set_axis_off spines text hatch plt axis plt.bar() plt.axis import figure pyplot highlight_text pypalettes plt.subplots() xlabel ylabel title legend colorbar savefig tight_layout grid set_xlim set_ylim plot scatter hist boxplot imshow cmap alpha bins tick_params annotate quiver contour barh stackplot subplots_adjust axhline axvline semilogx semilogy loglog polar streamplot hexbin pcolor tricontour errorbar clabel set_aspect violinplot set_axis_off spines text hatch plt axis plt.bar() plt.axis import figure pyplot highlight_text pypalettes plt.subplots() xlabel ylabel title legend colorbar savefig tight_layout grid set_xlim set_ylim plot scatter hist boxplot imshow cmap alpha bins tick_params annotate quiver contour barh stackplot subplots_adjust axhline axvline semilogx semilogy loglog polar streamplot hexbin pcolor tricontour errorbar clabel set_aspect violinplot set_axis_off spines text hatch plt axis plt.bar() plt.axis import figure pyplot highlight_text pypalettes plt.subplots() xlabel ylabel title legend colorbar savefig tight_layout grid set_xlim set_ylim plot scatter hist boxplot imshow cmap alpha bins tick_params annotate quiver contour barh stackplot subplots_adjust axhline axvline semilogx semilogy loglog polar streamplot hexbin pcolor tricontour errorbar clabel set_aspect violinplot set_axis_off spines text hatch plt axis plt.bar() plt.axis import figure pyplot highlight_text pypalettes plt.subplots() xlabel ylabel title legend colorbar savefig tight_layout grid set_xlim set_ylim plot scatter hist boxplot imshow cmap alpha bins tick_params annotate quiver contour barh stackplot subplots_adjust axhline axvline semilogx semilogy loglog polar streamplot hexbin pcolor tricontour errorbar clabel set_aspect violinplot set_axis_off spines text hatch plt axis plt.bar() plt.axis import figure pyplot highlight_text pypalettes plt.subplots() xlabel ylabel title legend colorbar savefig tight_layout grid set_xlim set_ylim plot scatter hist boxplot imshow cmap alpha bins tick_params annotate quiver contour barh stackplot subplots_adjust axhline axvline semilogx semilogy loglog polar streamplot hexbin pcolor tricontour errorbar clabel set_aspect violinplot set_axis_off spines text hatch plt axis plt.bar() plt.axis import figure pyplot highlight_text pypalettes plt.subplots() xlabel ylabel title legend colorbar savefig tight_layout grid set_xlim set_ylim plot scatter hist boxplot imshow cmap alpha bins tick_params annotate quiver contour barh stackplot subplots_adjust axhline axvline semilogx semilogy loglog polar streamplot hexbin pcolor tricontour errorbar clabel set_aspect violinplot set_axis_off spines text hatch plt axis plt.bar() plt.axis import figure pyplot highlight_text pypalettes plt.subplots() xlabel ylabel title legend colorbar savefig tight_layout grid set_xlim set_ylim plot scatter hist boxplot imshow cmap alpha bins tick_params annotate quiver contour barh stackplot subplots_adjust axhline axvline semilogx semilogy loglog polar streamplot hexbin pcolor tricontour errorbar clabel set_aspect violinplot set_axis_off spines text hatch plt axis plt.bar() plt.axis import figure pyplot highlight_text pypalettes plt.subplots() xlabel ylabel title legend colorbar savefig tight_layout grid set_xlim set_ylim plot scatter hist boxplot imshow cmap alpha bins tick_params annotate quiver contour barh stackplot subplots_adjust axhline axvline semilogx semilogy loglog polar streamplot hexbin pcolor tricontour errorbar clabel set_aspect violinplot set_axis_off spines text hatch plt axis plt.bar() plt.axis import figure pyplot highlight_text pypalettes plt.subplots() xlabel ylabel title legend colorbar savefig tight_layout grid set_xlim set_ylim plot scatter hist boxplot imshow cmap alpha bins tick_params annotate quiver contour barh stackplot subplots_adjust axhline axvline semilogx semilogy loglog polar streamplot hexbin pcolor tricontour errorbar clabel set_aspect violinplot set_axis_off spines text hatch plt axis plt.bar() plt.axis import figure pyplot highlight_text pypalettes plt.subplots() xlabel ylabel title legend colorbar savefig tight_layout grid set_xlim set_ylim plot scatter hist boxplot imshow cmap alpha bins tick_params annotate quiver contour barh stackplot subplots_adjust axhline axvline semilogx semilogy loglog polar streamplot hexbin pcolor tricontour errorbar clabel set_aspect violinplot set_axis_off spines text hatch plt axis plt.bar() plt.axis import figure pyplot highlight_text pypalettes plt.subplots() xlabel ylabel title legend colorbar savefig tight_layout grid set_xlim set_ylim plot scatter hist boxplot imshow cmap alpha bins tick_params annotate quiver contour barh stackplot subplots_adjust axhline axvline semilogx semilogy loglog polar streamplot hexbin pcolor tricontour errorbar clabel set_aspect violinplot set_axis_off spines text hatch plt axis plt.bar() plt.axis import figure pyplot highlight_text pypalettes plt.subplots() xlabel ylabel title legend colorbar savefig tight_layout grid set_xlim set_ylim plot scatter hist boxplot imshow cmap alpha bins tick_params annotate quiver contour barh stackplot subplots_adjust axhline axvline semilogx semilogy loglog polar streamplot hexbin pcolor tricontour errorbar clabel set_aspect violinplot set_axis_off spines text hatch plt axis plt.bar() plt.axis import figure pyplot highlight_text pypalettes plt.subplots() xlabel ylabel title legend colorbar savefig tight_layout grid set_xlim set_ylim plot scatter hist boxplot imshow cmap alpha bins tick_params annotate quiver contour barh stackplot subplots_adjust axhline axvline semilogx semilogy loglog polar streamplot hexbin pcolor tricontour errorbar clabel set_aspect violinplot set_axis_off spines text hatch plt axis plt.bar() plt.axis import figure pyplot highlight_text pypalettes plt.subplots() xlabel ylabel title legend colorbar savefig tight_layout grid set_xlim set_ylim plot scatter hist boxplot imshow cmap alpha bins tick_params annotate quiver contour barh stackplot subplots_adjust axhline axvline semilogx semilogy loglog polar streamplot hexbin pcolor tricontour errorbar clabel set_aspect violinplot set_axis_off spines text hatch plt axis plt.bar() plt.axis import figure pyplot highlight_text pypalettes plt.subplots() xlabel ylabel title legend colorbar savefig tight_layout grid set_xlim set_ylim plot scatter hist boxplot imshow cmap alpha bins tick_params annotate quiver contour barh stackplot subplots_adjust axhline axvline semilogx semilogy loglog polar streamplot hexbin pcolor tricontour errorbar clabel set_aspect violinplot set_axis_off spines text hatch plt axis plt.bar() plt.axis import figure pyplot highlight_text pypalettes plt.subplots() xlabel ylabel title legend colorbar savefig tight_layout grid set_xlim set_ylim plot scatter hist boxplot imshow cmap alpha bins tick_params annotate quiver contour barh stackplot subplots_adjust axhline axvline semilogx semilogy loglog polar streamplot hexbin pcolor tricontour errorbar clabel set_aspect violinplot set_axis_off spines text hatch plt axis plt.bar() plt.axis import figure pyplot highlight_text pypalettes plt.subplots() xlabel ylabel title legend colorbar savefig tight_layout grid set_xlim set_ylim plot scatter hist boxplot imshow cmap alpha bins tick_params annotate quiver contour barh stackplot subplots_adjust axhline axvline semilogx semilogy loglog polar streamplot hexbin pcolor tricontour errorbar clabel set_aspect violinplot set_axis_off spines text hatch plt axis plt.bar() plt.axis import figure pyplot highlight_text pypalettes plt.subplots() xlabel ylabel title legend colorbar savefig tight_layout grid set_xlim set_ylim plot scatter hist boxplot imshow cmap alpha bins tick_params annotate quiver contour barh stackplot subplots_adjust axhline axvline semilogx semilogy loglog polar streamplot hexbin pcolor tricontour errorbar clabel set_aspect violinplot set_axis_off spines text hatch plt axis plt.bar() plt.axis import figure pyplot highlight_text pypalettes plt.subplots() xlabel ylabel title legend colorbar savefig tight_layout grid set_xlim set_ylim plot scatter hist boxplot imshow cmap alpha bins tick_params annotate quiver contour barh stackplot subplots_adjust axhline axvline semilogx semilogy loglog polar streamplot hexbin pcolor tricontour errorbar clabel set_aspect violinplot set_axis_off spines text hatch plt axis plt.bar() plt.axis import figure pyplot highlight_text pypalettes plt.subplots() xlabel ylabel title legend colorbar savefig tight_layout grid set_xlim set_ylim plot scatter hist boxplot imshow cmap alpha bins tick_params annotate quiver contour barh stackplot subplots_adjust axhline axvline semilogx semilogy loglog polar streamplot hexbin pcolor tricontour errorbar clabel set_aspect violinplot set_axis_off spines text hatch plt axis plt.bar() plt.axis import figure pyplot highlight_text pypalettes plt.subplots() xlabel ylabel title legend colorbar savefig tight_layout grid set_xlim set_ylim plot scatter hist boxplot imshow cmap alpha bins tick_params annotate quiver contour barh stackplot subplots_adjust axhline axvline semilogx semilogy loglog polar streamplot hexbin pcolor tricontour errorbar clabel set_aspect violinplot set_axis_off spines text hatch plt axis plt.bar() plt.axis import figure pyplot highlight_text pypalettes plt.subplots() xlabel ylabel title legend colorbar savefig tight_layout grid set_xlim set_ylim plot scatter hist boxplot imshow cmap alpha bins tick_params annotate quiver contour barh stackplot subplots_adjust axhline axvline semilogx semilogy loglog polar streamplot hexbin pcolor tricontour errorbar clabel set_aspect violinplot set_axis_off spines text hatch plt axis plt.bar() plt.axis import figure pyplot highlight_text pypalettes plt.subplots() xlabel ylabel title legend colorbar savefig tight_layout grid set_xlim set_ylim plot scatter hist boxplot imshow cmap alpha bins tick_params annotate quiver contour barh stackplot subplots_adjust axhline axvline semilogx semilogy loglog polar streamplot hexbin pcolor tricontour errorbar clabel set_aspect violinplot set_axis_off spines text hatch plt axis plt.bar() plt.axis import figure pyplot highlight_text pypalettes plt.subplots() xlabel ylabel title legend colorbar savefig tight_layout grid set_xlim set_ylim plot scatter hist boxplot imshow cmap alpha bins tick_params annotate quiver contour barh stackplot subplots_adjust axhline axvline semilogx semilogy loglog polar streamplot hexbin pcolor tricontour errorbar clabel set_aspect violinplot set_axis_off spines text hatch plt axis plt.bar() plt.axis import figure pyplot highlight_text pypalettes plt.subplots() xlabel ylabel title legend colorbar savefig tight_layout grid set_xlim set_ylim plot scatter hist boxplot imshow cmap alpha bins tick_params annotate quiver contour barh stackplot subplots_adjust axhline axvline semilogx semilogy loglog polar streamplot hexbin pcolor tricontour errorbar clabel set_aspect violinplot set_axis_off spines text hatch plt axis plt.bar() plt.axis import figure pyplot highlight_text pypalettes plt.subplots() xlabel ylabel title legend colorbar savefig tight_layout grid set_xlim set_ylim plot scatter hist boxplot imshow cmap alpha bins tick_params annotate quiver contour barh stackplot subplots_adjust axhline axvline semilogx semilogy loglog polar streamplot hexbin pcolor tricontour errorbar clabel set_aspect violinplot set_axis_off spines text hatch plt axis plt.bar() plt.axis import figure pyplot highlight_text pypalettes plt.subplots() xlabel ylabel title legend colorbar savefig tight_layout grid set_xlim set_ylim plot scatter hist boxplot imshow cmap alpha bins tick_params annotate quiver contour barh stackplot subplots_adjust axhline axvline semilogx semilogy loglog polar streamplot hexbin pcolor tricontour errorbar clabel set_aspect violinplot set_axis_off spines text hatch plt axis plt.bar() plt.axis import figure pyplot highlight_text pypalettes plt.subplots() xlabel ylabel title legend colorbar savefig tight_layout grid set_xlim set_ylim plot scatter hist boxplot imshow cmap alpha bins tick_params annotate quiver contour barh stackplot subplots_adjust axhline axvline semilogx semilogy loglog polar streamplot hexbin pcolor tricontour errorbar clabel set_aspect violinplot set_axis_off spines text hatch plt axis plt.bar() plt.axis import figure pyplot highlight_text pypalettes plt.subplots() xlabel ylabel title legend colorbar savefig tight_layout grid set_xlim set_ylim plot scatter hist boxplot imshow cmap alpha bins tick_params annotate quiver contour barh stackplot subplots_adjust axhline axvline semilogx semilogy loglog polar streamplot hexbin pcolor tricontour errorbar clabel set_aspect violinplot set_axis_off spines text hatch plt axis plt.bar() plt.axis import figure pyplot highlight_text pypalettes plt.subplots() xlabel ylabel title legend colorbar savefig tight_layout grid set_xlim set_ylim plot scatter hist boxplot imshow cmap alpha bins tick_params annotate quiver contour barh stackplot subplots_adjust axhline axvline semilogx semilogy loglog polar streamplot hexbin pcolor tricontour errorbar clabel set_aspect violinplot set_axis_off spines text hatch plt axis plt.bar() plt.axis import figure pyplot highlight_text pypalettes plt.subplots() xlabel ylabel title legend colorbar savefig tight_layout grid set_xlim set_ylim plot scatter hist boxplot imshow cmap alpha bins tick_params annotate quiver contour barh stackplot subplots_adjust axhline axvline semilogx semilogy loglog polar streamplot hexbin pcolor tricontour errorbar clabel set_aspect violinplot set_axis_off spines text hatch plt axis plt.bar() plt.axis import figure pyplot highlight_text pypalettes plt.subplots() xlabel ylabel title legend colorbar savefig tight_layout grid set_xlim set_ylim plot scatter hist boxplot imshow cmap alpha bins tick_params annotate quiver contour barh stackplot subplots_adjust axhline axvline semilogx semilogy loglog polar streamplot hexbin pcolor tricontour errorbar clabel set_aspect violinplot set_axis_off spines text hatch plt axis plt.bar() plt.axis import figure pyplot highlight_text pypalettes plt.subplots() xlabel ylabel title legend colorbar savefig tight_layout grid set_xlim set_ylim plot scatter hist boxplot imshow cmap alpha bins tick_params annotate quiver contour barh stackplot subplots_adjust axhline axvline semilogx semilogy loglog polar streamplot hexbin pcolor tricontour errorbar clabel set_aspect violinplot set_axis_off spines text hatch plt axis plt.bar() plt.axis import figure pyplot highlight_text pypalettes plt.subplots() xlabel ylabel title legend colorbar savefig tight_layout grid set_xlim set_ylim plot scatter hist boxplot imshow cmap alpha bins tick_params annotate quiver contour barh stackplot subplots_adjust axhline axvline semilogx semilogy loglog polar streamplot hexbin pcolor tricontour errorbar clabel set_aspect violinplot set_axis_off spines text hatch plt axis plt.bar() plt.axis import figure pyplot highlight_text pypalettes plt.subplots() xlabel ylabel title legend colorbar savefig tight_layout grid set_xlim set_ylim plot scatter hist boxplot imshow cmap alpha bins tick_params annotate quiver contour barh stackplot subplots_adjust axhline axvline semilogx semilogy loglog polar streamplot hexbin pcolor tricontour errorbar clabel set_aspect violinplot set_axis_off spines text hatch plt axis plt.bar() plt.axis import figure pyplot highlight_text pypalettes plt.subplots() xlabel ylabel title legend colorbar savefig tight_layout grid set_xlim set_ylim plot scatter hist boxplot imshow cmap alpha bins tick_params annotate quiver contour barh stackplot subplots_adjust axhline axvline semilogx semilogy loglog polar streamplot hexbin pcolor tricontour errorbar clabel set_aspect violinplot set_axis_off spines text hatch plt axis plt.bar() plt.axis import figure pyplot highlight_text pypalettes plt.subplots() xlabel ylabel title legend colorbar savefig tight_layout grid set_xlim set_ylim plot scatter hist boxplot imshow cmap alpha bins tick_params annotate quiver contour barh stackplot subplots_adjust axhline axvline semilogx semilogy loglog polar streamplot hexbin pcolor tricontour errorbar clabel set_aspect violinplot set_axis_off spines text hatch plt axis plt.bar() plt.axis import figure pyplot highlight_text pypalettes plt.subplots() xlabel ylabel title legend colorbar savefig tight_layout grid set_xlim set_ylim plot scatter hist boxplot imshow cmap alpha bins tick_params annotate quiver contour barh stackplot subplots_adjust axhline axvline semilogx semilogy loglog polar streamplot hexbin pcolor tricontour errorbar clabel set_aspect violinplot set_axis_off spines text hatch plt axis plt.bar() plt.axis import figure pyplot highlight_text pypalettes plt.subplots() xlabel ylabel title legend colorbar savefig tight_layout grid set_xlim set_ylim plot scatter hist boxplot imshow cmap alpha bins tick_params annotate quiver contour barh stackplot subplots_adjust axhline axvline semilogx semilogy loglog polar streamplot hexbin pcolor tricontour errorbar clabel set_aspect violinplot set_axis_off spines text hatch plt axis plt.bar() plt.axis import figure pyplot highlight_text pypalettes plt.subplots() xlabel ylabel title legend colorbar savefig tight_layout grid set_xlim set_ylim plot scatter hist boxplot imshow cmap alpha bins tick_params annotate quiver contour barh stackplot subplots_adjust axhline axvline semilogx semilogy loglog polar streamplot hexbin pcolor tricontour errorbar clabel set_aspect violinplot set_axis_off spines text hatch plt axis plt.bar() plt.axis import figure pyplot highlight_text pypalettes plt.subplots() xlabel ylabel title legend colorbar savefig tight_layout grid set_xlim set_ylim plot scatter hist boxplot imshow cmap alpha bins tick_params annotate quiver contour barh stackplot subplots_adjust axhline axvline semilogx semilogy loglog polar streamplot hexbin pcolor tricontour errorbar clabel set_aspect violinplot set_axis_off spines text hatch plt axis plt.bar() plt.axis import figure pyplot highlight_text pypalettes plt.subplots() xlabel ylabel title legend colorbar savefig tight_layout grid set_xlim set_ylim plot scatter hist boxplot imshow cmap alpha bins tick_params annotate quiver contour barh stackplot subplots_adjust axhline axvline semilogx semilogy loglog polar streamplot hexbin pcolor tricontour errorbar clabel set_aspect violinplot set_axis_off spines text hatch plt axis plt.bar() plt.axis import figure pyplot highlight_text pypalettes plt.subplots() xlabel ylabel title legend colorbar savefig tight_layout grid set_xlim set_ylim plot scatter hist boxplot imshow cmap alpha bins tick_params annotate quiver contour barh stackplot subplots_adjust axhline axvline semilogx semilogy loglog polar streamplot hexbin pcolor tricontour errorbar clabel set_aspect violinplot set_axis_off spines text hatch plt axis plt.bar() plt.axis import figure pyplot highlight_text pypalettes plt.subplots() xlabel ylabel title legend colorbar savefig tight_layout grid set_xlim set_ylim plot scatter hist boxplot imshow cmap alpha bins tick_params annotate quiver contour barh stackplot subplots_adjust axhline axvline semilogx semilogy loglog polar streamplot hexbin pcolor tricontour errorbar clabel set_aspect violinplot set_axis_off spines text hatch plt axis plt.bar() plt.axis import figure pyplot highlight_text pypalettes plt.subplots() xlabel ylabel title legend colorbar savefig tight_layout grid set_xlim set_ylim plot scatter hist boxplot imshow cmap alpha bins tick_params annotate quiver contour barh stackplot subplots_adjust axhline axvline semilogx semilogy loglog polar streamplot hexbin pcolor tricontour errorbar clabel set_aspect violinplot set_axis_off spines text hatch plt axis plt.bar() plt.axis import figure pyplot highlight_text pypalettes plt.subplots() xlabel ylabel title legend colorbar savefig tight_layout grid set_xlim set_ylim plot scatter hist boxplot imshow cmap alpha bins tick_params annotate quiver contour barh stackplot subplots_adjust axhline axvline semilogx semilogy loglog polar streamplot hexbin pcolor tricontour errorbar clabel set_aspect violinplot set_axis_off spines text hatch plt axis plt.bar() plt.axis import figure pyplot highlight_text pypalettes plt.subplots() xlabel ylabel title legend colorbar savefig tight_layout grid set_xlim set_ylim plot scatter hist boxplot imshow cmap alpha bins tick_params annotate quiver contour barh stackplot subplots_adjust axhline axvline semilogx semilogy loglog polar streamplot hexbin pcolor tricontour errorbar clabel set_aspect violinplot set_axis_off spines text hatch plt axis plt.bar() plt.axis import figure pyplot highlight_text pypalettes plt.subplots() xlabel ylabel title legend colorbar savefig tight_layout grid set_xlim set_ylim plot scatter hist boxplot imshow cmap alpha bins tick_params annotate quiver contour barh stackplot subplots_adjust axhline axvline semilogx semilogy loglog polar streamplot hexbin pcolor tricontour errorbar clabel set_aspect violinplot set_axis_off spines text hatch plt axis plt.bar() plt.axis import figure pyplot highlight_text pypalettes plt.subplots() xlabel ylabel title legend colorbar savefig tight_layout grid set_xlim set_ylim plot scatter hist boxplot imshow cmap alpha bins tick_params annotate quiver contour barh stackplot subplots_adjust axhline axvline semilogx semilogy loglog polar streamplot hexbin pcolor tricontour errorbar clabel set_aspect violinplot set_axis_off spines text hatch plt axis plt.bar() plt.axis import figure pyplot highlight_text pypalettes plt.subplots() xlabel ylabel title legend colorbar savefig tight_layout grid set_xlim set_ylim plot scatter hist boxplot imshow cmap alpha bins tick_params annotate quiver contour barh stackplot subplots_adjust axhline axvline semilogx semilogy loglog polar streamplot hexbin pcolor tricontour errorbar clabel set_aspect violinplot set_axis_off spines text hatch plt axis plt.bar() plt.axis import figure pyplot highlight_text pypalettes plt.subplots() xlabel ylabel title legend colorbar savefig tight_layout grid set_xlim set_ylim plot scatter hist boxplot imshow cmap alpha bins tick_params annotate quiver contour barh stackplot subplots_adjust axhline axvline semilogx semilogy loglog polar streamplot hexbin pcolor tricontour errorbar clabel set_aspect violinplot set_axis_off spines text hatch plt axis plt.bar() plt.axis import figure pyplot highlight_text pypalettes plt.subplots() xlabel ylabel title legend colorbar savefig tight_layout grid set_xlim set_ylim plot scatter hist boxplot imshow cmap alpha bins tick_params annotate quiver contour barh stackplot subplots_adjust axhline axvline semilogx semilogy loglog polar streamplot hexbin pcolor tricontour errorbar clabel set_aspect violinplot set_axis_off spines text hatch plt axis plt.bar() plt.axis import figure pyplot highlight_text pypalettes plt.subplots() xlabel ylabel title legend colorbar savefig tight_layout grid set_xlim set_ylim plot scatter hist boxplot imshow cmap alpha bins tick_params annotate quiver contour barh stackplot subplots_adjust axhline axvline semilogx semilogy loglog polar streamplot hexbin pcolor tricontour errorbar clabel set_aspect violinplot set_axis_off spines text hatch plt axis plt.bar() plt.axis import figure pyplot highlight_text pypalettes plt.subplots() xlabel ylabel title legend colorbar savefig tight_layout grid set_xlim set_ylim plot scatter hist boxplot imshow cmap alpha bins tick_params annotate quiver contour barh stackplot subplots_adjust axhline axvline semilogx semilogy loglog polar streamplot hexbin pcolor tricontour errorbar clabel set_aspect violinplot set_axis_off spines text hatch plt axis plt.bar() plt.axis import figure pyplot highlight_text pypalettes plt.subplots() xlabel ylabel title legend colorbar savefig tight_layout grid set_xlim set_ylim plot scatter hist boxplot imshow cmap alpha bins tick_params annotate quiver contour barh stackplot subplots_adjust axhline axvline semilogx semilogy loglog polar streamplot hexbin pcolor tricontour errorbar clabel set_aspect violinplot set_axis_off spines text hatch plt axis plt.bar() plt.axis import figure pyplot highlight_text pypalettes plt.subplots() xlabel ylabel title legend colorbar savefig tight_layout grid set_xlim set_ylim plot scatter hist boxplot imshow cmap alpha bins tick_params annotate quiver contour barh stackplot subplots_adjust axhline axvline semilogx semilogy loglog polar streamplot hexbin pcolor tricontour errorbar clabel set_aspect violinplot set_axis_off spines text hatch plt axis plt.bar() plt.axis import figure pyplot highlight_text pypalettes plt.subplots() xlabel ylabel title legend colorbar savefig tight_layout grid set_xlim set_ylim plot scatter hist boxplot imshow cmap alpha bins tick_params annotate quiver contour barh stackplot subplots_adjust axhline axvline semilogx semilogy loglog polar streamplot hexbin pcolor tricontour errorbar clabel set_aspect violinplot set_axis_off spines text hatch plt axis plt.bar() plt.axis import figure pyplot highlight_text pypalettes plt.subplots() xlabel ylabel title legend colorbar savefig tight_layout grid set_xlim set_ylim plot scatter hist boxplot imshow cmap alpha bins tick_params annotate quiver contour barh stackplot subplots_adjust axhline axvline semilogx semilogy loglog polar streamplot hexbin pcolor tricontour errorbar clabel set_aspect violinplot set_axis_off spines text hatch plt axis plt.bar() plt.axis import figure pyplot highlight_text pypalettes plt.subplots() xlabel ylabel title legend colorbar savefig tight_layout grid set_xlim set_ylim plot scatter hist boxplot imshow cmap alpha bins tick_params annotate quiver contour barh stackplot subplots_adjust axhline axvline semilogx semilogy loglog polar streamplot hexbin pcolor tricontour errorbar clabel set_aspect violinplot set_axis_off spines text hatch plt axis plt.bar() plt.axis import figure pyplot highlight_text pypalettes plt.subplots() xlabel ylabel title legend colorbar savefig tight_layout grid set_xlim set_ylim plot scatter hist boxplot imshow cmap alpha bins tick_params annotate quiver contour barh stackplot subplots_adjust axhline axvline semilogx semilogy loglog polar streamplot hexbin pcolor tricontour errorbar clabel set_aspect violinplot set_axis_off spines text hatch plt axis plt.bar() plt.axis import figure pyplot highlight_text pypalettes plt.subplots() xlabel ylabel title legend colorbar savefig tight_layout grid set_xlim set_ylim plot scatter hist boxplot imshow cmap alpha bins tick_params annotate quiver contour barh stackplot subplots_adjust axhline axvline semilogx semilogy loglog polar streamplot hexbin pcolor tricontour errorbar clabel set_aspect violinplot set_axis_off spines text hatch plt axis plt.bar() plt.axis import figure pyplot highlight_text pypalettes plt.subplots() xlabel ylabel title legend colorbar savefig tight_layout grid set_xlim set_ylim plot scatter hist boxplot imshow cmap alpha bins tick_params annotate quiver contour barh stackplot subplots_adjust axhline axvline semilogx semilogy loglog polar streamplot hexbin pcolor tricontour errorbar clabel set_aspect violinplot set_axis_off spines text hatch plt axis plt.bar() plt.axis import figure pyplot highlight_text pypalettes plt.subplots() xlabel ylabel title legend colorbar savefig tight_layout grid set_xlim set_ylim plot scatter hist boxplot imshow cmap alpha bins tick_params annotate quiver contour barh stackplot subplots_adjust axhline axvline semilogx semilogy loglog polar streamplot hexbin pcolor tricontour errorbar clabel set_aspect violinplot set_axis_off spines text hatch plt axis plt.bar() plt.axis import figure pyplot highlight_text pypalettes plt.subplots() xlabel ylabel title legend colorbar savefig tight_layout grid set_xlim set_ylim plot scatter hist boxplot imshow cmap alpha bins tick_params annotate quiver contour barh stackplot subplots_adjust axhline axvline semilogx semilogy loglog polar streamplot hexbin pcolor tricontour errorbar clabel set_aspect violinplot set_axis_off spines text hatch plt axis plt.bar() plt.axis import figure pyplot highlight_text pypalettes plt.subplots() xlabel ylabel title legend colorbar savefig tight_layout grid set_xlim set_ylim plot scatter hist boxplot imshow cmap alpha bins tick_params annotate quiver contour barh stackplot subplots_adjust axhline axvline semilogx semilogy loglog polar streamplot hexbin pcolor tricontour errorbar clabel set_aspect violinplot set_axis_off spines text hatch plt axis plt.bar() plt.axis import figure pyplot highlight_text pypalettes plt.subplots() xlabel ylabel title legend colorbar savefig tight_layout grid set_xlim set_ylim plot scatter hist boxplot imshow cmap alpha bins tick_params annotate quiver contour barh stackplot subplots_adjust axhline axvline semilogx semilogy loglog polar streamplot hexbin pcolor tricontour errorbar clabel set_aspect violinplot set_axis_off spines text hatch plt axis plt.bar() plt.axis import figure pyplot highlight_text pypalettes plt.subplots() xlabel ylabel title legend colorbar savefig tight_layout grid set_xlim set_ylim plot scatter hist boxplot imshow cmap alpha bins tick_params annotate quiver contour barh stackplot subplots_adjust axhline axvline semilogx semilogy loglog polar streamplot hexbin pcolor tricontour errorbar clabel set_aspect violinplot set_axis_off spines text hatch plt axis plt.bar() plt.axis import figure pyplot highlight_text pypalettes plt.subplots() xlabel ylabel title legend colorbar savefig tight_layout grid set_xlim set_ylim plot scatter hist boxplot imshow cmap alpha bins tick_params annotate quiver contour barh stackplot subplots_adjust axhline axvline semilogx semilogy loglog polar streamplot hexbin pcolor tricontour errorbar clabel set_aspect violinplot set_axis_off spines text hatch plt axis plt.bar() plt.axis import figure pyplot highlight_text pypalettes plt.subplots() xlabel ylabel title legend colorbar savefig tight_layout grid set_xlim set_ylim plot scatter hist boxplot imshow cmap alpha bins tick_params annotate quiver contour barh stackplot subplots_adjust axhline axvline semilogx semilogy loglog polar streamplot hexbin pcolor tricontour errorbar clabel set_aspect violinplot set_axis_off spines text hatch plt axis plt.bar() plt.axis import figure pyplot highlight_text pypalettes plt.subplots() xlabel ylabel title legend colorbar savefig tight_layout grid set_xlim set_ylim plot scatter hist boxplot imshow cmap alpha bins tick_params annotate quiver contour barh stackplot subplots_adjust axhline axvline semilogx semilogy loglog polar streamplot hexbin pcolor tricontour errorbar clabel set_aspect violinplot set_axis_off spines text hatch plt axis plt.bar() plt.axis import figure pyplot highlight_text pypalettes plt.subplots() xlabel ylabel title legend colorbar savefig tight_layout grid set_xlim set_ylim plot scatter hist boxplot imshow cmap alpha bins tick_params annotate quiver contour barh stackplot subplots_adjust axhline axvline semilogx semilogy loglog polar streamplot hexbin pcolor tricontour errorbar clabel set_aspect violinplot set_axis_off spines text hatch plt axis plt.bar() plt.axis import figure pyplot highlight_text pypalettes plt.subplots() xlabel ylabel title legend colorbar savefig tight_layout grid set_xlim set_ylim plot scatter hist boxplot imshow cmap alpha bins tick_params annotate quiver contour barh stackplot subplots_adjust axhline axvline semilogx semilogy loglog polar streamplot hexbin pcolor tricontour errorbar clabel set_aspect violinplot set_axis_off spines text hatch plt axis plt.bar() plt.axis import figure pyplot highlight_text pypalettes plt.subplots() xlabel ylabel title legend colorbar savefig tight_layout grid set_xlim set_ylim plot scatter hist boxplot imshow cmap alpha bins tick_params annotate quiver contour barh stackplot subplots_adjust axhline axvline semilogx semilogy loglog polar streamplot hexbin pcolor tricontour errorbar clabel set_aspect violinplot set_axis_off spines text hatch plt axis plt.bar() plt.axis import figure pyplot highlight_text pypalettes plt.subplots() xlabel ylabel title legend colorbar savefig tight_layout grid set_xlim set_ylim plot scatter hist boxplot imshow cmap alpha bins tick_params annotate quiver contour barh stackplot subplots_adjust axhline axvline semilogx semilogy loglog polar streamplot hexbin pcolor tricontour errorbar clabel set_aspect violinplot set_axis_off spines text hatch plt axis plt.bar() plt.axis import figure pyplot highlight_text pypalettes plt.subplots() xlabel ylabel title legend colorbar savefig tight_layout grid set_xlim set_ylim plot scatter hist boxplot imshow cmap alpha bins tick_params annotate quiver contour barh stackplot subplots_adjust axhline axvline semilogx semilogy loglog polar streamplot hexbin pcolor tricontour errorbar clabel set_aspect violinplot set_axis_off spines text hatch plt axis plt.bar() plt.axis import figure pyplot highlight_text pypalettes plt.subplots() xlabel ylabel title legend colorbar savefig tight_layout grid set_xlim set_ylim plot scatter hist boxplot imshow cmap alpha bins tick_params annotate quiver contour barh stackplot subplots_adjust axhline axvline semilogx semilogy loglog polar streamplot hexbin pcolor tricontour errorbar clabel set_aspect violinplot set_axis_off spines text hatch plt axis plt.bar() plt.axis import figure pyplot highlight_text pypalettes plt.subplots() xlabel ylabel title legend colorbar savefig tight_layout grid set_xlim set_ylim plot scatter hist boxplot imshow cmap alpha bins tick_params annotate quiver contour barh stackplot subplots_adjust axhline axvline semilogx semilogy loglog polar streamplot hexbin pcolor tricontour errorbar clabel set_aspect violinplot set_axis_off spines text hatch plt axis plt.bar() plt.axis import figure pyplot highlight_text pypalettes plt.subplots() xlabel ylabel title legend colorbar savefig tight_layout grid set_xlim set_ylim plot scatter hist boxplot imshow cmap alpha bins tick_params annotate quiver contour barh stackplot subplots_adjust axhline axvline semilogx semilogy loglog polar streamplot hexbin pcolor tricontour errorbar clabel set_aspect violinplot set_axis_off spines text hatch plt axis plt.bar() plt.axis import figure pyplot highlight_text pypalettes plt.subplots() xlabel ylabel title legend colorbar savefig tight_layout grid set_xlim set_ylim plot scatter hist boxplot imshow cmap alpha bins tick_params annotate quiver contour barh stackplot subplots_adjust axhline axvline semilogx semilogy loglog polar streamplot hexbin pcolor tricontour errorbar clabel set_aspect violinplot set_axis_off spines text hatch plt axis plt.bar() plt.axis import figure pyplot highlight_text pypalettes plt.subplots() xlabel ylabel title legend colorbar savefig tight_layout grid set_xlim set_ylim plot scatter hist boxplot imshow cmap alpha bins tick_params annotate quiver contour barh stackplot subplots_adjust axhline axvline semilogx semilogy loglog polar streamplot hexbin pcolor tricontour errorbar clabel set_aspect violinplot set_axis_off spines text hatch plt axis plt.bar() plt.axis import figure pyplot highlight_text pypalettes plt.subplots() xlabel ylabel title legend colorbar savefig tight_layout grid set_xlim set_ylim plot scatter hist boxplot imshow cmap alpha bins tick_params annotate quiver contour barh stackplot subplots_adjust axhline axvline semilogx semilogy loglog polar streamplot hexbin pcolor tricontour errorbar clabel set_aspect violinplot set_axis_off spines text hatch plt axis plt.bar() plt.axis import figure pyplot highlight_text pypalettes plt.subplots() xlabel ylabel title legend colorbar savefig tight_layout grid set_xlim set_ylim plot scatter hist boxplot imshow cmap alpha bins tick_params annotate quiver contour barh stackplot subplots_adjust axhline axvline semilogx semilogy loglog polar streamplot hexbin pcolor tricontour errorbar clabel set_aspect violinplot set_axis_off spines text hatch plt axis plt.bar() plt.axis import figure pyplot highlight_text pypalettes plt.subplots() xlabel ylabel title legend colorbar savefig tight_layout grid set_xlim set_ylim plot scatter hist boxplot imshow cmap alpha bins tick_params annotate quiver contour barh stackplot subplots_adjust axhline axvline semilogx semilogy loglog polar streamplot hexbin pcolor tricontour errorbar clabel set_aspect violinplot set_axis_off spines text hatch plt axis plt.bar() plt.axis import figure pyplot highlight_text pypalettes plt.subplots() xlabel ylabel title legend colorbar savefig tight_layout grid set_xlim set_ylim plot scatter hist boxplot imshow cmap alpha bins tick_params annotate quiver contour barh stackplot subplots_adjust axhline axvline semilogx semilogy loglog polar streamplot hexbin pcolor tricontour errorbar clabel set_aspect violinplot set_axis_off spines text hatch plt axis plt.bar() plt.axis import figure pyplot highlight_text pypalettes plt.subplots() xlabel ylabel title legend colorbar savefig tight_layout grid set_xlim set_ylim plot scatter hist boxplot imshow cmap alpha bins tick_params annotate quiver contour barh stackplot subplots_adjust axhline axvline semilogx semilogy loglog polar streamplot hexbin pcolor tricontour errorbar clabel set_aspect violinplot set_axis_off spines text hatch plt axis plt.bar() plt.axis import figure pyplot highlight_text pypalettes plt.subplots() xlabel ylabel title legend colorbar savefig tight_layout grid set_xlim set_ylim plot scatter hist boxplot imshow cmap alpha bins tick_params annotate quiver contour barh stackplot subplots_adjust axhline axvline semilogx semilogy loglog polar streamplot hexbin pcolor tricontour errorbar clabel set_aspect violinplot set_axis_off spines text hatch plt axis plt.bar() plt.axis import figure pyplot highlight_text pypalettes plt.subplots() xlabel ylabel title legend colorbar savefig tight_layout grid set_xlim set_ylim plot scatter hist boxplot imshow cmap alpha bins tick_params annotate quiver contour barh stackplot subplots_adjust axhline axvline semilogx semilogy loglog polar streamplot hexbin pcolor tricontour errorbar clabel set_aspect violinplot set_axis_off spines text hatch plt axis plt.bar() plt.axis import figure pyplot highlight_text pypalettes plt.subplots() xlabel ylabel title legend colorbar savefig tight_layout grid set_xlim set_ylim plot scatter hist boxplot imshow cmap alpha bins tick_params annotate quiver contour barh stackplot subplots_adjust axhline axvline semilogx semilogy loglog polar streamplot hexbin pcolor tricontour errorbar clabel set_aspect violinplot set_axis_off spines text hatch plt axis plt.bar() plt.axis import figure pyplot highlight_text pypalettes plt.subplots() xlabel ylabel title legend colorbar savefig tight_layout grid set_xlim set_ylim plot scatter hist boxplot imshow cmap alpha bins tick_params annotate quiver contour barh stackplot subplots_adjust axhline axvline semilogx semilogy loglog polar streamplot hexbin pcolor tricontour errorbar clabel set_aspect violinplot set_axis_off spines text hatch plt axis plt.bar() plt.axis import figure pyplot highlight_text pypalettes plt.subplots() xlabel ylabel title legend colorbar savefig tight_layout grid set_xlim set_ylim plot scatter hist boxplot imshow cmap alpha bins tick_params annotate quiver contour barh stackplot subplots_adjust axhline axvline semilogx semilogy loglog polar streamplot hexbin pcolor tricontour errorbar clabel set_aspect violinplot set_axis_off spines text hatch plt axis plt.bar() plt.axis import figure pyplot highlight_text pypalettes plt.subplots() xlabel ylabel title legend colorbar savefig tight_layout grid set_xlim set_ylim plot scatter hist boxplot imshow cmap alpha bins tick_params annotate quiver contour barh stackplot subplots_adjust axhline axvline semilogx semilogy loglog polar streamplot hexbin pcolor tricontour errorbar clabel set_aspect violinplot set_axis_off spines text hatch plt axis plt.bar() plt.axis import figure pyplot highlight_text pypalettes plt.subplots() xlabel ylabel title legend colorbar savefig tight_layout grid set_xlim set_ylim plot scatter hist boxplot imshow cmap alpha bins tick_params annotate quiver contour barh stackplot subplots_adjust axhline axvline semilogx semilogy loglog polar streamplot hexbin pcolor tricontour errorbar clabel set_aspect violinplot set_axis_off spines text hatch plt axis plt.bar() plt.axis import figure pyplot highlight_text pypalettes plt.subplots() xlabel ylabel title legend colorbar savefig tight_layout grid set_xlim set_ylim plot scatter hist boxplot imshow cmap alpha bins tick_params annotate quiver contour barh stackplot subplots_adjust axhline axvline semilogx semilogy loglog polar streamplot hexbin pcolor tricontour errorbar clabel set_aspect violinplot set_axis_off spines text hatch plt axis plt.bar() plt.axis import figure pyplot highlight_text pypalettes plt.subplots() xlabel ylabel title legend colorbar savefig tight_layout grid set_xlim set_ylim plot scatter hist boxplot imshow cmap alpha bins tick_params annotate quiver contour barh stackplot subplots_adjust axhline axvline semilogx semilogy loglog polar streamplot hexbin pcolor tricontour errorbar clabel set_aspect violinplot set_axis_off spines text hatch plt axis plt.bar() plt.axis import figure pyplot highlight_text pypalettes plt.subplots() xlabel ylabel title legend colorbar savefig tight_layout grid set_xlim set_ylim plot scatter hist boxplot imshow cmap alpha bins tick_params annotate quiver contour barh stackplot subplots_adjust axhline axvline semilogx semilogy loglog polar streamplot hexbin pcolor tricontour errorbar clabel set_aspect violinplot set_axis_off spines text hatch plt axis plt.bar() plt.axis import figure pyplot highlight_text pypalettes plt.subplots() xlabel ylabel title legend colorbar savefig tight_layout grid set_xlim set_ylim plot scatter hist boxplot imshow cmap alpha bins tick_params annotate quiver contour barh stackplot subplots_adjust axhline axvline semilogx semilogy loglog polar streamplot hexbin pcolor tricontour errorbar clabel set_aspect violinplot set_axis_off spines text hatch plt axis plt.bar() plt.axis import figure pyplot highlight_text pypalettes plt.subplots() xlabel ylabel title legend colorbar savefig tight_layout grid set_xlim set_ylim plot scatter hist boxplot imshow cmap alpha bins tick_params annotate quiver contour barh stackplot subplots_adjust axhline axvline semilogx semilogy loglog polar streamplot hexbin pcolor tricontour errorbar clabel set_aspect violinplot set_axis_off spines text hatch plt axis plt.bar() plt.axis import figure pyplot highlight_text pypalettes plt.subplots() xlabel ylabel title legend colorbar savefig tight_layout grid set_xlim set_ylim plot scatter hist boxplot imshow cmap alpha bins tick_params annotate quiver contour barh stackplot subplots_adjust axhline axvline semilogx semilogy loglog polar streamplot hexbin pcolor tricontour errorbar clabel set_aspect violinplot set_axis_off spines text hatch plt axis plt.bar() plt.axis import figure pyplot highlight_text pypalettes plt.subplots() xlabel ylabel title legend colorbar savefig tight_layout grid set_xlim set_ylim plot scatter hist boxplot imshow cmap alpha bins tick_params annotate quiver contour barh stackplot subplots_adjust axhline axvline semilogx semilogy loglog polar streamplot hexbin pcolor tricontour errorbar clabel set_aspect violinplot set_axis_off spines text hatch plt axis plt.bar() plt.axis import figure pyplot highlight_text pypalettes plt.subplots() xlabel ylabel title legend colorbar savefig tight_layout grid set_xlim set_ylim plot scatter hist boxplot imshow cmap alpha bins tick_params annotate quiver contour barh stackplot subplots_adjust axhline axvline semilogx semilogy loglog polar streamplot hexbin pcolor tricontour errorbar clabel set_aspect violinplot set_axis_off spines text hatch plt axis plt.bar() plt.axis import figure pyplot highlight_text pypalettes plt.subplots() xlabel ylabel title legend colorbar savefig tight_layout grid set_xlim set_ylim plot scatter hist boxplot imshow cmap alpha bins tick_params annotate quiver contour barh stackplot subplots_adjust axhline axvline semilogx semilogy loglog polar streamplot hexbin pcolor tricontour errorbar clabel set_aspect violinplot set_axis_off spines text hatch plt axis plt.bar() plt.axis import figure pyplot highlight_text pypalettes plt.subplots() xlabel ylabel title legend colorbar savefig tight_layout grid set_xlim set_ylim plot scatter hist boxplot imshow cmap alpha bins tick_params annotate quiver contour barh stackplot subplots_adjust axhline axvline semilogx semilogy loglog polar streamplot hexbin pcolor tricontour errorbar clabel set_aspect violinplot set_axis_off spines text hatch plt axis plt.bar() plt.axis import figure pyplot highlight_text pypalettes plt.subplots() xlabel ylabel title legend colorbar savefig tight_layout grid set_xlim set_ylim plot scatter hist boxplot imshow cmap alpha bins tick_params annotate quiver contour barh stackplot subplots_adjust axhline axvline semilogx semilogy loglog polar streamplot hexbin pcolor tricontour errorbar clabel set_aspect violinplot set_axis_off spines text hatch plt axis plt.bar() plt.axis import figure pyplot highlight_text pypalettes plt.subplots() xlabel ylabel title legend colorbar savefig tight_layout grid set_xlim set_ylim plot scatter hist boxplot imshow cmap alpha bins tick_params annotate quiver contour barh stackplot subplots_adjust axhline axvline semilogx semilogy loglog polar streamplot hexbin pcolor tricontour errorbar clabel set_aspect violinplot set_axis_off spines text hatch plt axis plt.bar() plt.axis import figure pyplot highlight_text pypalettes plt.subplots() xlabel ylabel title legend colorbar savefig tight_layout grid set_xlim set_ylim plot scatter hist boxplot imshow cmap alpha bins tick_params annotate quiver contour barh stackplot subplots_adjust axhline axvline semilogx semilogy loglog polar streamplot hexbin pcolor tricontour errorbar clabel set_aspect violinplot set_axis_off spines text hatch plt axis plt.bar() plt.axis import figure pyplot highlight_text pypalettes plt.subplots() xlabel ylabel title legend colorbar savefig tight_layout grid set_xlim set_ylim plot scatter hist boxplot imshow cmap alpha bins tick_params annotate quiver contour barh stackplot subplots_adjust axhline axvline semilogx semilogy loglog polar streamplot hexbin pcolor tricontour errorbar clabel set_aspect violinplot set_axis_off spines text hatch plt axis plt.bar() plt.axis import figure pyplot highlight_text pypalettes plt.subplots() xlabel ylabel title legend colorbar savefig tight_layout grid set_xlim set_ylim plot scatter hist boxplot imshow cmap alpha bins tick_params annotate quiver contour barh stackplot subplots_adjust axhline axvline semilogx semilogy loglog polar streamplot hexbin pcolor tricontour errorbar clabel set_aspect violinplot set_axis_off spines text hatch plt axis plt.bar() plt.axis import figure pyplot highlight_text pypalettes plt.subplots() xlabel ylabel title legend colorbar savefig tight_layout grid set_xlim set_ylim plot scatter hist boxplot imshow cmap alpha bins tick_params annotate quiver contour barh stackplot subplots_adjust axhline axvline semilogx semilogy loglog polar streamplot hexbin pcolor tricontour errorbar clabel set_aspect violinplot set_axis_off spines text hatch plt axis plt.bar() plt.axis import figure pyplot highlight_text pypalettes plt.subplots() xlabel ylabel title legend colorbar savefig tight_layout grid set_xlim set_ylim plot scatter hist boxplot imshow cmap alpha bins tick_params annotate quiver contour barh stackplot subplots_adjust axhline axvline semilogx semilogy loglog polar streamplot hexbin pcolor tricontour errorbar clabel set_aspect violinplot set_axis_off spines text hatch plt axis plt.bar() plt.axis import figure pyplot highlight_text pypalettes plt.subplots() xlabel ylabel title legend colorbar savefig tight_layout grid set_xlim set_ylim plot scatter hist boxplot imshow cmap alpha bins tick_params annotate quiver contour barh stackplot subplots_adjust axhline axvline semilogx semilogy loglog polar streamplot hexbin pcolor tricontour errorbar clabel set_aspect violinplot set_axis_off spines text hatch plt axis plt.bar() plt.axis import figure pyplot highlight_text pypalettes plt.subplots() xlabel ylabel title legend colorbar savefig tight_layout grid set_xlim set_ylim plot scatter hist boxplot imshow cmap alpha bins tick_params annotate quiver contour barh stackplot subplots_adjust axhline axvline semilogx semilogy loglog polar streamplot hexbin pcolor tricontour errorbar clabel set_aspect violinplot set_axis_off spines text hatch plt axis plt.bar() plt.axis import figure pyplot highlight_text pypalettes plt.subplots() xlabel ylabel title legend colorbar savefig tight_layout grid set_xlim set_ylim plot scatter hist boxplot imshow cmap alpha bins tick_params annotate quiver contour barh stackplot subplots_adjust axhline axvline semilogx semilogy loglog polar streamplot hexbin pcolor tricontour errorbar clabel set_aspect violinplot set_axis_off spines text hatch plt axis plt.bar() plt.axis import figure pyplot highlight_text pypalettes plt.subplots() xlabel ylabel title legend colorbar savefig tight_layout grid set_xlim set_ylim plot scatter hist boxplot imshow cmap alpha bins tick_params annotate quiver contour barh stackplot subplots_adjust axhline axvline semilogx semilogy loglog polar streamplot hexbin pcolor tricontour errorbar clabel set_aspect violinplot set_axis_off spines text hatch plt axis plt.bar() plt.axis import figure pyplot highlight_text pypalettes plt.subplots() xlabel ylabel title legend colorbar savefig tight_layout grid set_xlim set_ylim plot scatter hist boxplot imshow cmap alpha bins tick_params annotate quiver contour barh stackplot subplots_adjust axhline axvline semilogx semilogy loglog polar streamplot hexbin pcolor tricontour errorbar clabel set_aspect violinplot set_axis_off spines text hatch plt axis plt.bar() plt.axis import figure pyplot highlight_text pypalettes plt.subplots() xlabel ylabel title legend colorbar savefig tight_layout grid set_xlim set_ylim plot scatter hist boxplot imshow cmap alpha bins tick_params annotate quiver contour barh stackplot subplots_adjust axhline axvline semilogx semilogy loglog polar streamplot hexbin pcolor tricontour errorbar clabel set_aspect violinplot set_axis_off spines text hatch plt axis plt.bar() plt.axis import figure pyplot highlight_text pypalettes plt.subplots() xlabel ylabel title legend colorbar savefig tight_layout grid set_xlim set_ylim plot scatter hist boxplot imshow cmap alpha bins tick_params annotate quiver contour barh stackplot subplots_adjust axhline axvline semilogx semilogy loglog polar streamplot hexbin pcolor tricontour errorbar clabel set_aspect violinplot set_axis_off spines text hatch plt axis plt.bar() plt.axis import figure pyplot highlight_text pypalettes plt.subplots() xlabel ylabel title legend colorbar savefig tight_layout grid set_xlim set_ylim plot scatter hist boxplot imshow cmap alpha bins tick_params annotate quiver contour barh stackplot subplots_adjust axhline axvline semilogx semilogy loglog polar streamplot hexbin pcolor tricontour errorbar clabel set_aspect violinplot set_axis_off spines text hatch plt axis plt.bar() plt.axis import figure pyplot highlight_text pypalettes plt.subplots() xlabel ylabel title legend colorbar savefig tight_layout grid set_xlim set_ylim plot scatter hist boxplot imshow cmap alpha bins tick_params annotate quiver contour barh stackplot subplots_adjust axhline axvline semilogx semilogy loglog polar streamplot hexbin pcolor tricontour errorbar clabel set_aspect violinplot set_axis_off spines text hatch plt axis plt.bar() plt.axis import figure pyplot highlight_text pypalettes plt.subplots() xlabel ylabel title legend colorbar savefig tight_layout grid set_xlim set_ylim plot scatter hist boxplot imshow cmap alpha bins tick_params annotate quiver contour barh stackplot subplots_adjust axhline axvline semilogx semilogy loglog polar streamplot hexbin pcolor tricontour errorbar clabel set_aspect violinplot set_axis_off spines text hatch plt axis plt.bar() plt.axis import figure pyplot highlight_text pypalettes plt.subplots() xlabel ylabel title legend colorbar savefig tight_layout grid set_xlim set_ylim plot scatter hist boxplot imshow cmap alpha bins tick_params annotate quiver contour barh stackplot subplots_adjust axhline axvline semilogx semilogy loglog polar streamplot hexbin pcolor tricontour errorbar clabel set_aspect violinplot set_axis_off spines text hatch plt axis plt.bar() plt.axis import figure pyplot highlight_text pypalettes plt.subplots() xlabel ylabel title legend colorbar savefig tight_layout grid set_xlim set_ylim plot scatter hist boxplot imshow cmap alpha bins tick_params annotate quiver contour barh stackplot subplots_adjust axhline axvline semilogx semilogy loglog polar streamplot hexbin pcolor tricontour errorbar clabel set_aspect violinplot set_axis_off spines text hatch plt axis plt.bar() plt.axis import figure pyplot highlight_text pypalettes plt.subplots() xlabel ylabel title legend colorbar savefig tight_layout grid set_xlim set_ylim plot scatter hist boxplot imshow cmap alpha bins tick_params annotate quiver contour barh stackplot subplots_adjust axhline axvline semilogx semilogy loglog polar streamplot hexbin pcolor tricontour errorbar clabel set_aspect violinplot set_axis_off spines text hatch plt axis plt.bar() plt.axis import figure pyplot highlight_text pypalettes plt.subplots() xlabel ylabel title legend colorbar savefig tight_layout grid set_xlim set_ylim plot scatter hist boxplot imshow cmap alpha bins tick_params annotate quiver contour barh stackplot subplots_adjust axhline axvline semilogx semilogy loglog polar streamplot hexbin pcolor tricontour errorbar clabel set_aspect violinplot set_axis_off spines text hatch plt axis plt.bar() plt.axis import figure pyplot highlight_text pypalettes plt.subplots() xlabel ylabel title legend colorbar savefig tight_layout grid set_xlim set_ylim plot scatter hist boxplot imshow cmap alpha bins tick_params annotate quiver contour barh stackplot subplots_adjust axhline axvline semilogx semilogy loglog polar streamplot hexbin pcolor tricontour errorbar clabel set_aspect violinplot set_axis_off spines text hatch plt axis plt.bar() plt.axis import figure pyplot highlight_text pypalettes plt.subplots() xlabel ylabel title legend colorbar savefig tight_layout grid set_xlim set_ylim plot scatter hist boxplot imshow cmap alpha bins tick_params annotate quiver contour barh stackplot subplots_adjust axhline axvline semilogx semilogy loglog polar streamplot hexbin pcolor tricontour errorbar clabel set_aspect violinplot set_axis_off spines text hatch plt axis plt.bar() plt.axis import figure pyplot highlight_text pypalettes plt.subplots() xlabel ylabel title legend colorbar savefig tight_layout grid set_xlim set_ylim plot scatter hist boxplot imshow cmap alpha bins tick_params annotate quiver contour barh stackplot subplots_adjust axhline axvline semilogx semilogy loglog polar streamplot hexbin pcolor tricontour errorbar clabel set_aspect violinplot set_axis_off spines text hatch plt axis plt.bar() plt.axis import figure pyplot highlight_text pypalettes plt.subplots() xlabel ylabel title legend colorbar savefig tight_layout grid set_xlim set_ylim plot scatter hist boxplot imshow cmap alpha bins tick_params annotate quiver contour barh stackplot subplots_adjust axhline axvline semilogx semilogy loglog polar streamplot hexbin pcolor tricontour errorbar clabel set_aspect violinplot set_axis_off spines text hatch plt axis plt.bar() plt.axis import figure pyplot highlight_text pypalettes plt.subplots() xlabel ylabel title legend colorbar savefig tight_layout grid set_xlim set_ylim plot scatter hist boxplot imshow cmap alpha bins tick_params annotate quiver contour barh stackplot subplots_adjust axhline axvline semilogx semilogy loglog polar streamplot hexbin pcolor tricontour errorbar clabel set_aspect violinplot set_axis_off spines text hatch plt axis plt.bar() plt.axis import figure pyplot highlight_text pypalettes plt.subplots() xlabel ylabel title legend colorbar savefig tight_layout grid set_xlim set_ylim plot scatter hist boxplot imshow cmap alpha bins tick_params annotate quiver contour barh stackplot subplots_adjust axhline axvline semilogx semilogy loglog polar streamplot hexbin pcolor tricontour errorbar clabel set_aspect violinplot set_axis_off spines text hatch plt axis plt.bar() plt.axis import figure pyplot highlight_text pypalettes plt.subplots() xlabel ylabel title legend colorbar savefig tight_layout grid set_xlim set_ylim plot scatter hist boxplot imshow cmap alpha bins tick_params annotate quiver contour barh stackplot subplots_adjust axhline axvline semilogx semilogy loglog polar streamplot hexbin pcolor tricontour errorbar clabel set_aspect violinplot set_axis_off spines text hatch plt axis plt.bar() plt.axis import figure pyplot highlight_text pypalettes plt.subplots() xlabel ylabel title legend colorbar savefig tight_layout grid set_xlim set_ylim plot scatter hist boxplot imshow cmap alpha bins tick_params annotate quiver contour barh stackplot subplots_adjust axhline axvline semilogx semilogy loglog polar streamplot hexbin pcolor tricontour errorbar clabel set_aspect violinplot set_axis_off spines text hatch plt axis plt.bar() plt.axis import figure pyplot highlight_text pypalettes plt.subplots() xlabel ylabel title legend colorbar savefig tight_layout grid set_xlim set_ylim plot scatter hist boxplot imshow cmap alpha bins tick_params annotate quiver contour barh stackplot subplots_adjust axhline axvline semilogx semilogy loglog polar streamplot hexbin pcolor tricontour errorbar clabel set_aspect violinplot set_axis_off spines text hatch plt axis plt.bar() plt.axis import figure pyplot highlight_text pypalettes plt.subplots() xlabel ylabel title legend colorbar savefig tight_layout grid set_xlim set_ylim plot scatter hist boxplot imshow cmap alpha bins tick_params annotate quiver contour barh stackplot subplots_adjust axhline axvline semilogx semilogy loglog polar streamplot hexbin pcolor tricontour errorbar clabel set_aspect violinplot set_axis_off spines text hatch plt axis plt.bar() plt.axis import figure pyplot highlight_text pypalettes plt.subplots() xlabel ylabel title legend colorbar savefig tight_layout grid set_xlim set_ylim plot scatter hist boxplot imshow cmap alpha bins tick_params annotate quiver contour barh stackplot subplots_adjust axhline axvline semilogx semilogy loglog polar streamplot hexbin pcolor tricontour errorbar clabel set_aspect violinplot set_axis_off spines text hatch plt axis plt.bar() plt.axis import figure pyplot highlight_text pypalettes plt.subplots() xlabel ylabel title legend colorbar savefig tight_layout grid set_xlim set_ylim plot scatter hist boxplot imshow cmap alpha bins tick_params annotate quiver contour barh stackplot subplots_adjust axhline axvline semilogx semilogy loglog polar streamplot hexbin pcolor tricontour errorbar clabel set_aspect violinplot set_axis_off spines text hatch plt axis plt.bar() plt.axis import figure pyplot highlight_text pypalettes plt.subplots() xlabel ylabel title legend colorbar savefig tight_layout grid set_xlim set_ylim plot scatter hist boxplot imshow cmap alpha bins tick_params annotate quiver contour barh stackplot subplots_adjust axhline axvline semilogx semilogy loglog polar streamplot hexbin pcolor tricontour errorbar clabel set_aspect violinplot set_axis_off spines text hatch plt axis plt.bar() plt.axis import figure pyplot highlight_text pypalettes plt.subplots() xlabel ylabel title legend colorbar savefig tight_layout grid set_xlim set_ylim plot scatter hist boxplot imshow cmap alpha bins tick_params annotate quiver contour barh stackplot subplots_adjust axhline axvline semilogx semilogy loglog polar streamplot hexbin pcolor tricontour errorbar clabel set_aspect violinplot set_axis_off spines text hatch plt axis plt.bar() plt.axis import figure pyplot highlight_text pypalettes plt.subplots() xlabel ylabel title legend colorbar savefig tight_layout grid set_xlim set_ylim plot scatter hist boxplot imshow cmap alpha bins tick_params annotate quiver contour barh stackplot subplots_adjust axhline axvline semilogx semilogy loglog polar streamplot hexbin pcolor tricontour errorbar clabel set_aspect violinplot set_axis_off spines text hatch plt axis plt.bar() plt.axis import figure pyplot highlight_text pypalettes plt.subplots() xlabel ylabel title legend colorbar savefig tight_layout grid set_xlim set_ylim plot scatter hist boxplot imshow cmap alpha bins tick_params annotate quiver contour barh stackplot subplots_adjust axhline axvline semilogx semilogy loglog polar streamplot hexbin pcolor tricontour errorbar clabel set_aspect violinplot set_axis_off spines text hatch plt axis plt.bar() plt.axis import figure pyplot highlight_text pypalettes plt.subplots() xlabel ylabel title legend colorbar savefig tight_layout grid set_xlim set_ylim plot scatter hist boxplot imshow cmap alpha bins tick_params annotate quiver contour barh stackplot subplots_adjust axhline axvline semilogx semilogy loglog polar streamplot hexbin pcolor tricontour errorbar clabel set_aspect violinplot set_axis_off spines text hatch plt axis plt.bar() plt.axis import figure pyplot highlight_text pypalettes plt.subplots() xlabel ylabel title legend colorbar savefig tight_layout grid set_xlim set_ylim plot scatter hist boxplot imshow cmap alpha bins tick_params annotate quiver contour barh stackplot subplots_adjust axhline axvline semilogx semilogy loglog polar streamplot hexbin pcolor tricontour errorbar clabel set_aspect violinplot set_axis_off spines text hatch plt axis plt.bar() plt.axis import figure pyplot highlight_text pypalettes plt.subplots() xlabel ylabel title legend colorbar savefig tight_layout grid set_xlim set_ylim plot scatter hist boxplot imshow cmap alpha bins tick_params annotate quiver contour barh stackplot subplots_adjust axhline axvline semilogx semilogy loglog polar streamplot hexbin pcolor tricontour errorbar clabel set_aspect violinplot set_axis_off spines text hatch plt axis plt.bar() plt.axis import figure pyplot highlight_text pypalettes plt.subplots() xlabel ylabel title legend colorbar savefig tight_layout grid set_xlim set_ylim plot scatter hist boxplot imshow cmap alpha bins tick_params annotate quiver contour barh stackplot subplots_adjust axhline axvline semilogx semilogy loglog polar streamplot hexbin pcolor tricontour errorbar clabel set_aspect violinplot set_axis_off spines text hatch plt axis plt.bar() plt.axis import figure pyplot highlight_text pypalettes plt.subplots() xlabel ylabel title legend colorbar savefig tight_layout grid set_xlim set_ylim plot scatter hist boxplot imshow cmap alpha bins tick_params annotate quiver contour barh stackplot subplots_adjust axhline axvline semilogx semilogy loglog polar streamplot hexbin pcolor tricontour errorbar clabel set_aspect violinplot set_axis_off spines text hatch plt axis plt.bar() plt.axis import figure pyplot highlight_text pypalettes plt.subplots() xlabel ylabel title legend colorbar savefig tight_layout grid set_xlim set_ylim plot scatter hist boxplot imshow cmap alpha bins tick_params annotate quiver contour barh stackplot subplots_adjust axhline axvline semilogx semilogy loglog polar streamplot hexbin pcolor tricontour errorbar clabel set_aspect violinplot set_axis_off spines text hatch plt axis plt.bar() plt.axis import figure pyplot highlight_text pypalettes plt.subplots() xlabel ylabel title legend colorbar savefig tight_layout grid set_xlim set_ylim plot scatter hist boxplot imshow cmap alpha bins tick_params annotate quiver contour barh stackplot subplots_adjust axhline axvline semilogx semilogy loglog polar streamplot hexbin pcolor tricontour errorbar clabel set_aspect violinplot set_axis_off spines text hatch plt axis plt.bar() plt.axis import figure pyplot highlight_text pypalettes plt.subplots() xlabel ylabel title legend colorbar savefig tight_layout grid set_xlim set_ylim plot scatter hist boxplot imshow cmap alpha bins tick_params annotate quiver contour barh stackplot subplots_adjust axhline axvline semilogx semilogy loglog polar streamplot hexbin pcolor tricontour errorbar clabel set_aspect violinplot set_axis_off spines text hatch plt axis plt.bar() plt.axis import figure pyplot highlight_text pypalettes plt.subplots() xlabel ylabel title legend colorbar savefig tight_layout grid set_xlim set_ylim plot scatter hist boxplot imshow cmap alpha bins tick_params annotate quiver contour barh stackplot subplots_adjust axhline axvline semilogx semilogy loglog polar streamplot hexbin pcolor tricontour errorbar clabel set_aspect violinplot set_axis_off spines text hatch plt axis plt.bar() plt.axis import figure pyplot highlight_text pypalettes plt.subplots() xlabel ylabel title legend colorbar savefig tight_layout grid set_xlim set_ylim plot scatter hist boxplot imshow cmap alpha bins tick_params annotate quiver contour barh stackplot subplots_adjust axhline axvline semilogx semilogy loglog polar streamplot hexbin pcolor tricontour errorbar clabel set_aspect violinplot set_axis_off spines text hatch plt axis plt.bar() plt.axis import figure pyplot highlight_text pypalettes plt.subplots() xlabel ylabel title legend colorbar savefig tight_layout grid set_xlim set_ylim plot scatter hist boxplot imshow cmap alpha bins tick_params annotate quiver contour barh stackplot subplots_adjust axhline axvline semilogx semilogy loglog polar streamplot hexbin pcolor tricontour errorbar clabel set_aspect violinplot set_axis_off spines text hatch plt axis plt.bar() plt.axis import figure pyplot highlight_text pypalettes plt.subplots() xlabel ylabel title legend colorbar savefig tight_layout grid set_xlim set_ylim plot scatter hist boxplot imshow cmap alpha bins tick_params annotate quiver contour barh stackplot subplots_adjust axhline axvline semilogx semilogy loglog polar streamplot hexbin pcolor tricontour errorbar clabel set_aspect violinplot set_axis_off spines text hatch plt axis plt.bar() plt.axis import figure pyplot highlight_text pypalettes plt.subplots() xlabel ylabel title legend colorbar savefig tight_layout grid set_xlim set_ylim plot scatter hist boxplot imshow cmap alpha bins tick_params annotate quiver contour barh stackplot subplots_adjust axhline axvline semilogx semilogy loglog polar streamplot hexbin pcolor tricontour errorbar clabel set_aspect violinplot set_axis_off spines text hatch plt axis plt.bar() plt.axis import figure pyplot highlight_text pypalettes plt.subplots() xlabel ylabel title legend colorbar savefig tight_layout grid set_xlim set_ylim plot scatter hist boxplot imshow cmap alpha bins tick_params annotate quiver contour barh stackplot subplots_adjust axhline axvline semilogx semilogy loglog polar streamplot hexbin pcolor tricontour errorbar clabel set_aspect violinplot set_axis_off spines text hatch plt axis plt.bar() plt.axis import figure pyplot highlight_text pypalettes plt.subplots() xlabel ylabel title legend colorbar savefig tight_layout grid set_xlim set_ylim plot scatter hist boxplot imshow cmap alpha bins tick_params annotate quiver contour barh stackplot subplots_adjust axhline axvline semilogx semilogy loglog polar streamplot hexbin pcolor tricontour errorbar clabel set_aspect violinplot set_axis_off spines text hatch plt axis plt.bar() plt.axis import figure pyplot highlight_text pypalettes plt.subplots() xlabel ylabel title legend colorbar savefig tight_layout grid set_xlim set_ylim plot scatter hist boxplot imshow cmap alpha bins tick_params annotate quiver contour barh stackplot subplots_adjust axhline axvline semilogx semilogy loglog polar streamplot hexbin pcolor tricontour errorbar clabel set_aspect violinplot set_axis_off spines text hatch plt axis plt.bar() plt.axis import figure pyplot highlight_text pypalettes plt.subplots() xlabel ylabel title legend colorbar savefig tight_layout grid set_xlim set_ylim plot scatter hist boxplot imshow cmap alpha bins tick_params annotate quiver contour barh stackplot subplots_adjust axhline axvline semilogx semilogy loglog polar streamplot hexbin pcolor tricontour errorbar clabel set_aspect violinplot set_axis_off spines text hatch plt axis plt.bar() plt.axis import figure pyplot highlight_text pypalettes plt.subplots() xlabel ylabel title legend colorbar savefig tight_layout grid set_xlim set_ylim plot scatter hist boxplot imshow cmap alpha bins tick_params annotate quiver contour barh stackplot subplots_adjust axhline axvline semilogx semilogy loglog polar streamplot hexbin pcolor tricontour errorbar clabel set_aspect violinplot set_axis_off spines text hatch plt axis plt.bar() plt.axis import figure pyplot highlight_text pypalettes plt.subplots() xlabel ylabel title legend colorbar savefig tight_layout grid set_xlim set_ylim plot scatter hist boxplot imshow cmap alpha bins tick_params annotate quiver contour barh stackplot subplots_adjust axhline axvline semilogx semilogy loglog polar streamplot hexbin pcolor tricontour errorbar clabel set_aspect violinplot set_axis_off spines text hatch plt axis plt.bar() plt.axis import figure pyplot highlight_text pypalettes plt.subplots() xlabel ylabel title legend colorbar savefig tight_layout grid set_xlim set_ylim plot scatter hist boxplot imshow cmap alpha bins tick_params annotate quiver contour barh stackplot subplots_adjust axhline axvline semilogx semilogy loglog polar streamplot hexbin pcolor tricontour errorbar clabel set_aspect violinplot set_axis_off spines text hatch plt axis plt.bar() plt.axis import figure pyplot highlight_text pypalettes plt.subplots() xlabel ylabel title legend colorbar savefig tight_layout grid set_xlim set_ylim plot scatter hist boxplot imshow cmap alpha bins tick_params annotate quiver contour barh stackplot subplots_adjust axhline axvline semilogx semilogy loglog polar streamplot hexbin pcolor tricontour errorbar clabel set_aspect violinplot set_axis_off spines text hatch plt axis plt.bar() plt.axis import figure pyplot highlight_text pypalettes plt.subplots() xlabel ylabel title legend colorbar savefig tight_layout grid set_xlim set_ylim plot scatter hist boxplot imshow cmap alpha bins tick_params annotate quiver contour barh stackplot subplots_adjust axhline axvline semilogx semilogy loglog polar streamplot hexbin pcolor tricontour errorbar clabel set_aspect violinplot set_axis_off spines text hatch plt axis plt.bar() plt.axis import figure pyplot highlight_text pypalettes plt.subplots() xlabel ylabel title legend colorbar savefig tight_layout grid set_xlim set_ylim plot scatter hist boxplot imshow cmap alpha bins tick_params annotate quiver contour barh stackplot subplots_adjust axhline axvline semilogx semilogy loglog polar streamplot hexbin pcolor tricontour errorbar clabel set_aspect violinplot set_axis_off spines text hatch plt axis plt.bar() plt.axis import figure pyplot highlight_text pypalettes plt.subplots() xlabel ylabel title legend colorbar savefig tight_layout grid set_xlim set_ylim plot scatter hist boxplot imshow cmap alpha bins tick_params annotate quiver contour barh stackplot subplots_adjust axhline axvline semilogx semilogy loglog polar streamplot hexbin pcolor tricontour errorbar clabel set_aspect violinplot set_axis_off spines text hatch plt axis plt.bar() plt.axis import figure pyplot highlight_text pypalettes plt.subplots() xlabel ylabel title legend colorbar savefig tight_layout grid set_xlim set_ylim plot scatter hist boxplot imshow cmap alpha bins tick_params annotate quiver contour barh stackplot subplots_adjust axhline axvline semilogx semilogy loglog polar streamplot hexbin pcolor tricontour errorbar clabel set_aspect violinplot set_axis_off spines text hatch plt axis plt.bar() plt.axis import figure pyplot highlight_text pypalettes plt.subplots() xlabel ylabel title legend colorbar savefig tight_layout grid set_xlim set_ylim plot scatter hist boxplot imshow cmap alpha bins tick_params annotate quiver contour barh stackplot subplots_adjust axhline axvline semilogx semilogy loglog polar streamplot hexbin pcolor tricontour errorbar clabel set_aspect violinplot set_axis_off spines text hatch plt axis plt.bar() plt.axis import figure pyplot highlight_text pypalettes plt.subplots() xlabel ylabel title legend colorbar savefig tight_layout grid set_xlim set_ylim plot scatter hist boxplot imshow cmap alpha bins tick_params annotate quiver contour barh stackplot subplots_adjust axhline axvline semilogx semilogy loglog polar streamplot hexbin pcolor tricontour errorbar clabel set_aspect violinplot set_axis_off spines text hatch plt axis plt.bar() plt.axis import figure pyplot highlight_text pypalettes plt.subplots() xlabel ylabel title legend colorbar savefig tight_layout grid set_xlim set_ylim plot scatter hist boxplot imshow cmap alpha bins tick_params annotate quiver contour barh stackplot subplots_adjust axhline axvline semilogx semilogy loglog polar streamplot hexbin pcolor tricontour errorbar clabel set_aspect violinplot set_axis_off spines text hatch plt axis plt.bar() plt.axis import figure pyplot highlight_text pypalettes plt.subplots() xlabel ylabel title legend colorbar savefig tight_layout grid set_xlim set_ylim plot scatter hist boxplot imshow cmap alpha bins tick_params annotate quiver contour barh stackplot subplots_adjust axhline axvline semilogx semilogy loglog polar streamplot hexbin pcolor tricontour errorbar clabel set_aspect violinplot set_axis_off spines text hatch plt axis plt.bar() plt.axis import figure pyplot highlight_text pypalettes plt.subplots() xlabel ylabel title legend colorbar savefig tight_layout grid set_xlim set_ylim plot scatter hist boxplot imshow cmap alpha bins tick_params annotate quiver contour barh stackplot subplots_adjust axhline axvline semilogx semilogy loglog polar streamplot hexbin pcolor tricontour errorbar clabel set_aspect violinplot set_axis_off spines text hatch plt axis plt.bar() plt.axis import figure pyplot highlight_text pypalettes plt.subplots() xlabel ylabel title legend colorbar savefig tight_layout grid set_xlim set_ylim plot scatter hist boxplot imshow cmap alpha bins tick_params annotate quiver contour barh stackplot subplots_adjust axhline axvline semilogx semilogy loglog polar streamplot hexbin pcolor tricontour errorbar clabel set_aspect violinplot set_axis_off spines text hatch plt axis plt.bar() plt.axis import figure pyplot highlight_text pypalettes plt.subplots() xlabel ylabel title legend colorbar savefig tight_layout grid set_xlim set_ylim plot scatter hist boxplot imshow cmap alpha bins tick_params annotate quiver contour barh stackplot subplots_adjust axhline axvline semilogx semilogy loglog polar streamplot hexbin pcolor tricontour errorbar clabel set_aspect violinplot set_axis_off spines text hatch plt axis plt.bar() plt.axis import figure pyplot highlight_text pypalettes plt.subplots() xlabel ylabel title legend colorbar savefig tight_layout grid set_xlim set_ylim plot scatter hist boxplot imshow cmap alpha bins tick_params annotate quiver contour barh stackplot subplots_adjust axhline axvline semilogx semilogy loglog polar streamplot hexbin pcolor tricontour errorbar clabel set_aspect violinplot set_axis_off spines text hatch plt axis plt.bar() plt.axis import figure pyplot highlight_text pypalettes plt.subplots() xlabel ylabel title legend colorbar savefig tight_layout grid set_xlim set_ylim plot scatter hist boxplot imshow cmap alpha bins tick_params annotate quiver contour barh stackplot subplots_adjust axhline axvline semilogx semilogy loglog polar streamplot hexbin pcolor tricontour errorbar clabel set_aspect violinplot set_axis_off spines text hatch plt axis plt.bar() plt.axis import figure pyplot highlight_text pypalettes plt.subplots() xlabel ylabel title legend colorbar savefig tight_layout grid set_xlim set_ylim plot scatter hist boxplot imshow cmap alpha bins tick_params annotate quiver contour barh stackplot subplots_adjust axhline axvline semilogx semilogy loglog polar streamplot hexbin pcolor tricontour errorbar clabel set_aspect violinplot set_axis_off spines text hatch plt axis plt.bar() plt.axis import figure pyplot highlight_text pypalettes plt.subplots() xlabel ylabel title legend colorbar savefig tight_layout grid set_xlim set_ylim plot scatter hist boxplot imshow cmap alpha bins tick_params annotate quiver contour barh stackplot subplots_adjust axhline axvline semilogx semilogy loglog polar streamplot hexbin pcolor tricontour errorbar clabel set_aspect violinplot set_axis_off spines text hatch plt axis plt.bar() plt.axis import figure pyplot highlight_text pypalettes plt.subplots() xlabel ylabel title legend colorbar savefig tight_layout grid set_xlim set_ylim plot scatter hist boxplot imshow cmap alpha bins tick_params annotate quiver contour barh stackplot subplots_adjust axhline axvline semilogx semilogy loglog polar streamplot hexbin pcolor tricontour errorbar clabel set_aspect violinplot set_axis_off spines text hatch plt axis plt.bar() plt.axis import figure pyplot highlight_text pypalettes plt.subplots() xlabel ylabel title legend colorbar savefig tight_layout grid set_xlim set_ylim plot scatter hist boxplot imshow cmap alpha bins tick_params annotate quiver contour barh stackplot subplots_adjust axhline axvline semilogx semilogy loglog polar streamplot hexbin pcolor tricontour errorbar clabel set_aspect violinplot set_axis_off spines text hatch plt axis plt.bar() plt.axis import figure pyplot highlight_text pypalettes plt.subplots() xlabel ylabel title legend colorbar savefig tight_layout grid set_xlim set_ylim plot scatter hist boxplot imshow cmap alpha bins tick_params annotate quiver contour barh stackplot subplots_adjust axhline axvline semilogx semilogy loglog polar streamplot hexbin pcolor tricontour errorbar clabel set_aspect violinplot set_axis_off spines text hatch plt axis plt.bar() plt.axis import figure pyplot highlight_text pypalettes plt.subplots() xlabel ylabel title legend colorbar savefig tight_layout grid set_xlim set_ylim plot scatter hist boxplot imshow cmap alpha bins tick_params annotate quiver contour barh stackplot subplots_adjust axhline axvline semilogx semilogy loglog polar streamplot hexbin pcolor tricontour errorbar clabel set_aspect violinplot set_axis_off spines text hatch plt axis plt.bar() plt.axis import figure pyplot highlight_text pypalettes plt.subplots() xlabel ylabel title legend colorbar savefig tight_layout grid set_xlim set_ylim plot scatter hist boxplot imshow cmap alpha bins tick_params annotate quiver contour barh stackplot subplots_adjust axhline axvline semilogx semilogy loglog polar streamplot hexbin pcolor tricontour errorbar clabel set_aspect violinplot set_axis_off spines text hatch plt axis plt.bar() plt.axis import figure pyplot highlight_text pypalettes plt.subplots() xlabel ylabel title legend colorbar savefig tight_layout grid set_xlim set_ylim plot scatter hist boxplot imshow cmap alpha bins tick_params annotate quiver contour barh stackplot subplots_adjust axhline axvline semilogx semilogy loglog polar streamplot hexbin pcolor tricontour errorbar clabel set_aspect violinplot set_axis_off spines text hatch plt axis plt.bar() plt.axis import figure pyplot highlight_text pypalettes plt.subplots() xlabel ylabel title legend colorbar savefig tight_layout grid set_xlim set_ylim plot scatter hist boxplot imshow cmap alpha bins tick_params annotate quiver contour barh stackplot subplots_adjust axhline axvline semilogx semilogy loglog polar streamplot hexbin pcolor tricontour errorbar clabel set_aspect violinplot set_axis_off spines text hatch plt axis plt.bar() plt.axis import figure pyplot highlight_text pypalettes plt.subplots() xlabel ylabel title legend colorbar savefig tight_layout grid set_xlim set_ylim plot scatter hist boxplot imshow cmap alpha bins tick_params annotate quiver contour barh stackplot subplots_adjust axhline axvline semilogx semilogy loglog polar streamplot hexbin pcolor tricontour errorbar clabel set_aspect violinplot set_axis_off spines text hatch plt axis plt.bar() plt.axis import figure pyplot highlight_text pypalettes plt.subplots() xlabel ylabel title legend colorbar savefig tight_layout grid set_xlim set_ylim plot scatter hist boxplot imshow cmap alpha bins tick_params annotate quiver contour barh stackplot subplots_adjust axhline axvline semilogx semilogy loglog polar streamplot hexbin pcolor tricontour errorbar clabel set_aspect violinplot set_axis_off spines text hatch plt axis plt.bar() plt.axis import figure pyplot highlight_text pypalettes plt.subplots() xlabel ylabel title legend colorbar savefig tight_layout grid set_xlim set_ylim plot scatter hist boxplot imshow cmap alpha bins tick_params annotate quiver contour barh stackplot subplots_adjust axhline axvline semilogx semilogy loglog polar streamplot hexbin pcolor tricontour errorbar clabel set_aspect violinplot set_axis_off spines text hatch plt axis plt.bar() plt.axis import figure pyplot highlight_text pypalettes plt.subplots() xlabel ylabel title legend colorbar savefig tight_layout grid set_xlim set_ylim plot scatter hist boxplot imshow cmap alpha bins tick_params annotate quiver contour barh stackplot subplots_adjust axhline axvline semilogx semilogy loglog polar streamplot hexbin pcolor tricontour errorbar clabel set_aspect violinplot set_axis_off spines text hatch plt axis plt.bar() plt.axis import figure pyplot highlight_text pypalettes plt.subplots() xlabel ylabel title legend colorbar savefig tight_layout grid set_xlim set_ylim plot scatter hist boxplot imshow cmap alpha bins tick_params annotate quiver contour barh stackplot subplots_adjust axhline axvline semilogx semilogy loglog polar streamplot hexbin pcolor tricontour errorbar clabel set_aspect violinplot set_axis_off spines text hatch plt axis plt.bar() plt.axis import figure pyplot highlight_text pypalettes plt.subplots() xlabel ylabel title legend colorbar savefig tight_layout grid set_xlim set_ylim plot scatter hist boxplot imshow cmap alpha bins tick_params annotate quiver contour barh stackplot subplots_adjust axhline axvline semilogx semilogy loglog polar streamplot hexbin pcolor tricontour errorbar clabel set_aspect violinplot set_axis_off spines text hatch plt axis plt.bar() plt.axis import figure pyplot highlight_text pypalettes plt.subplots() xlabel ylabel title legend colorbar savefig tight_layout grid set_xlim set_ylim plot scatter hist boxplot imshow cmap alpha bins tick_params annotate quiver contour barh stackplot subplots_adjust axhline axvline semilogx semilogy loglog polar streamplot hexbin pcolor tricontour errorbar clabel set_aspect violinplot set_axis_off spines text hatch plt axis plt.bar() plt.axis import figure pyplot highlight_text pypalettes plt.subplots() xlabel ylabel title legend colorbar savefig tight_layout grid set_xlim set_ylim plot scatter hist boxplot imshow cmap alpha bins tick_params annotate quiver contour barh stackplot subplots_adjust axhline axvline semilogx semilogy loglog polar streamplot hexbin pcolor tricontour errorbar clabel set_aspect violinplot set_axis_off spines text hatch plt axis plt.bar() plt.axis import figure pyplot highlight_text pypalettes plt.subplots() xlabel ylabel title legend colorbar savefig tight_layout grid set_xlim set_ylim plot scatter hist boxplot imshow cmap alpha bins tick_params annotate quiver contour barh stackplot subplots_adjust axhline axvline semilogx semilogy loglog polar streamplot hexbin pcolor tricontour errorbar clabel set_aspect violinplot set_axis_off spines text hatch plt axis plt.bar() plt.axis import figure pyplot highlight_text pypalettes plt.subplots() xlabel ylabel title legend colorbar savefig tight_layout grid set_xlim set_ylim plot scatter hist boxplot imshow cmap alpha bins tick_params annotate quiver contour barh stackplot subplots_adjust axhline axvline semilogx semilogy loglog polar streamplot hexbin pcolor tricontour errorbar clabel set_aspect violinplot set_axis_off spines text hatch plt axis plt.bar() plt.axis import figure pyplot highlight_text pypalettes plt.subplots() xlabel ylabel title legend colorbar savefig tight_layout grid set_xlim set_ylim plot scatter hist boxplot imshow cmap alpha bins tick_params annotate quiver contour barh stackplot subplots_adjust axhline axvline semilogx semilogy loglog polar streamplot hexbin pcolor tricontour errorbar clabel set_aspect violinplot set_axis_off spines text hatch plt axis plt.bar() plt.axis import figure pyplot highlight_text pypalettes plt.subplots() xlabel ylabel title legend colorbar savefig tight_layout grid set_xlim set_ylim plot scatter hist boxplot imshow cmap alpha bins tick_params annotate quiver contour barh stackplot subplots_adjust axhline axvline semilogx semilogy loglog polar streamplot hexbin pcolor tricontour errorbar clabel set_aspect violinplot set_axis_off spines text hatch plt axis plt.bar() plt.axis import figure pyplot highlight_text pypalettes plt.subplots() xlabel ylabel title legend colorbar savefig tight_layout grid set_xlim set_ylim plot scatter hist boxplot imshow cmap alpha bins tick_params annotate quiver contour barh stackplot subplots_adjust axhline axvline semilogx semilogy loglog polar streamplot hexbin pcolor tricontour errorbar clabel set_aspect violinplot set_axis_off spines text hatch plt axis plt.bar() plt.axis import figure pyplot highlight_text pypalettes plt.subplots() xlabel ylabel title legend colorbar savefig tight_layout grid set_xlim set_ylim plot scatter hist boxplot imshow cmap alpha bins tick_params annotate quiver contour barh stackplot subplots_adjust axhline axvline semilogx semilogy loglog polar streamplot hexbin pcolor tricontour errorbar clabel set_aspect violinplot set_axis_off spines text hatch plt axis plt.bar() plt.axis import figure pyplot highlight_text pypalettes plt.subplots() xlabel ylabel title legend colorbar savefig tight_layout grid set_xlim set_ylim plot scatter hist boxplot imshow cmap alpha bins tick_params annotate quiver contour barh stackplot subplots_adjust axhline axvline semilogx semilogy loglog polar streamplot hexbin pcolor tricontour errorbar clabel set_aspect violinplot set_axis_off spines text hatch plt axis plt.bar() plt.axis import figure pyplot highlight_text pypalettes plt.subplots() xlabel ylabel title legend colorbar savefig tight_layout grid set_xlim set_ylim plot scatter hist boxplot imshow cmap alpha bins tick_params annotate quiver contour barh stackplot subplots_adjust axhline axvline semilogx semilogy loglog polar streamplot hexbin pcolor tricontour errorbar clabel set_aspect violinplot set_axis_off spines text hatch plt axis plt.bar() plt.axis import figure pyplot highlight_text pypalettes plt.subplots() xlabel ylabel title legend colorbar savefig tight_layout grid set_xlim set_ylim plot scatter hist boxplot imshow cmap alpha bins tick_params annotate quiver contour barh stackplot subplots_adjust axhline axvline semilogx semilogy loglog polar streamplot hexbin pcolor tricontour errorbar clabel set_aspect violinplot set_axis_off spines text hatch plt axis plt.bar() plt.axis import figure pyplot highlight_text pypalettes plt.subplots() xlabel ylabel title legend colorbar savefig tight_layout grid set_xlim set_ylim plot scatter hist boxplot imshow cmap alpha bins tick_params annotate quiver contour barh stackplot subplots_adjust axhline axvline semilogx semilogy loglog polar streamplot hexbin pcolor tricontour errorbar clabel set_aspect violinplot set_axis_off spines text hatch plt axis plt.bar() plt.axis import figure pyplot highlight_text pypalettes plt.subplots() xlabel ylabel title legend colorbar savefig tight_layout grid set_xlim set_ylim plot scatter hist boxplot imshow cmap alpha bins tick_params annotate quiver contour barh stackplot subplots_adjust axhline axvline semilogx semilogy loglog polar streamplot hexbin pcolor tricontour errorbar clabel set_aspect violinplot set_axis_off spines text hatch plt axis plt.bar() plt.axis import figure pyplot highlight_text pypalettes plt.subplots() xlabel ylabel title legend colorbar savefig tight_layout grid set_xlim set_ylim plot scatter hist boxplot imshow cmap alpha bins tick_params annotate quiver contour barh stackplot subplots_adjust axhline axvline semilogx semilogy loglog polar streamplot hexbin pcolor tricontour errorbar clabel set_aspect violinplot set_axis_off spines text hatch plt axis plt.bar() plt.axis import figure pyplot highlight_text pypalettes plt.subplots() xlabel ylabel title legend colorbar savefig tight_layout grid set_xlim set_ylim plot scatter hist boxplot imshow cmap alpha bins tick_params annotate quiver contour barh stackplot subplots_adjust axhline axvline semilogx semilogy loglog polar streamplot hexbin pcolor tricontour errorbar clabel set_aspect violinplot set_axis_off spines text hatch plt axis plt.bar() plt.axis import figure pyplot highlight_text pypalettes plt.subplots() xlabel ylabel title legend colorbar savefig tight_layout grid set_xlim set_ylim plot scatter hist boxplot imshow cmap alpha bins tick_params annotate quiver contour barh stackplot subplots_adjust axhline axvline semilogx semilogy loglog polar streamplot hexbin pcolor tricontour errorbar clabel set_aspect violinplot set_axis_off spines text hatch plt axis plt.bar() plt.axis import figure pyplot highlight_text pypalettes plt.subplots() xlabel ylabel title legend colorbar savefig tight_layout grid set_xlim set_ylim plot scatter hist boxplot imshow cmap alpha bins tick_params annotate quiver contour barh stackplot subplots_adjust axhline axvline semilogx semilogy loglog polar streamplot hexbin pcolor tricontour errorbar clabel set_aspect violinplot set_axis_off spines text hatch plt axis plt.bar() plt.axis import figure pyplot highlight_text pypalettes plt.subplots() xlabel ylabel title legend colorbar savefig tight_layout grid set_xlim set_ylim plot scatter hist boxplot imshow cmap alpha bins tick_params annotate quiver contour barh stackplot subplots_adjust axhline axvline semilogx semilogy loglog polar streamplot hexbin pcolor tricontour errorbar clabel set_aspect violinplot set_axis_off spines text hatch plt axis plt.bar() plt.axis import figure pyplot highlight_text pypalettes plt.subplots() xlabel ylabel title legend colorbar savefig tight_layout grid set_xlim set_ylim plot scatter hist boxplot imshow cmap alpha bins tick_params annotate quiver contour barh stackplot subplots_adjust axhline axvline semilogx semilogy loglog polar streamplot hexbin pcolor tricontour errorbar clabel set_aspect violinplot set_axis_off spines text hatch plt axis plt.bar() plt.axis import figure pyplot highlight_text pypalettes plt.subplots() xlabel ylabel title legend colorbar savefig tight_layout grid set_xlim set_ylim plot scatter hist boxplot imshow cmap alpha bins tick_params annotate quiver contour barh stackplot subplots_adjust axhline axvline semilogx semilogy loglog polar streamplot hexbin pcolor tricontour errorbar clabel set_aspect violinplot set_axis_off spines text hatch plt axis plt.bar() plt.axis import figure pyplot highlight_text pypalettes plt.subplots() xlabel ylabel title legend colorbar savefig tight_layout grid set_xlim set_ylim plot scatter hist boxplot imshow cmap alpha bins tick_params annotate quiver contour barh stackplot subplots_adjust axhline axvline semilogx semilogy loglog polar streamplot hexbin pcolor tricontour errorbar clabel set_aspect violinplot set_axis_off spines text hatch plt axis plt.bar() plt.axis import figure pyplot highlight_text pypalettes plt.subplots() xlabel ylabel title legend colorbar savefig tight_layout grid set_xlim set_ylim plot scatter hist boxplot imshow cmap alpha bins tick_params annotate quiver contour barh stackplot subplots_adjust axhline axvline semilogx semilogy loglog polar streamplot hexbin pcolor tricontour errorbar clabel set_aspect violinplot set_axis_off spines text hatch plt axis plt.bar() plt.axis import figure pyplot highlight_text pypalettes plt.subplots() xlabel ylabel title legend colorbar savefig tight_layout grid set_xlim set_ylim plot scatter hist boxplot imshow cmap alpha bins tick_params annotate quiver contour barh stackplot subplots_adjust axhline axvline semilogx semilogy loglog polar streamplot hexbin pcolor tricontour errorbar clabel set_aspect violinplot set_axis_off spines text hatch plt axis plt.bar() plt.axis import figure pyplot highlight_text pypalettes plt.subplots() xlabel ylabel title legend colorbar savefig tight_layout grid set_xlim set_ylim plot scatter hist boxplot imshow cmap alpha bins tick_params annotate quiver contour barh stackplot subplots_adjust axhline axvline semilogx semilogy loglog polar streamplot hexbin pcolor tricontour errorbar clabel set_aspect violinplot set_axis_off spines text hatch plt axis plt.bar() plt.axis import figure pyplot highlight_text pypalettes plt.subplots() xlabel ylabel title legend colorbar savefig tight_layout grid set_xlim set_ylim plot scatter hist boxplot imshow cmap alpha bins tick_params annotate quiver contour barh stackplot subplots_adjust axhline axvline semilogx semilogy loglog polar streamplot hexbin pcolor tricontour errorbar clabel set_aspect violinplot set_axis_off spines text hatch plt axis plt.bar() plt.axis import figure pyplot highlight_text pypalettes plt.subplots() xlabel ylabel title legend colorbar savefig tight_layout grid set_xlim set_ylim plot scatter hist boxplot imshow cmap alpha bins tick_params annotate quiver contour barh stackplot subplots_adjust axhline axvline semilogx semilogy loglog polar streamplot hexbin pcolor tricontour errorbar clabel set_aspect violinplot set_axis_off spines text hatch plt axis plt.bar() plt.axis import figure pyplot highlight_text pypalettes plt.subplots() xlabel ylabel title legend colorbar savefig tight_layout grid set_xlim set_ylim plot scatter hist boxplot imshow cmap alpha bins tick_params annotate quiver contour barh stackplot subplots_adjust axhline axvline semilogx semilogy loglog polar streamplot hexbin pcolor tricontour errorbar clabel set_aspect violinplot set_axis_off spines text hatch plt axis plt.bar() plt.axis import figure pyplot highlight_text pypalettes plt.subplots() xlabel ylabel title legend colorbar savefig tight_layout grid set_xlim set_ylim plot scatter hist boxplot imshow cmap alpha bins tick_params annotate quiver contour barh stackplot subplots_adjust axhline axvline semilogx semilogy loglog polar streamplot hexbin pcolor tricontour errorbar clabel set_aspect violinplot set_axis_off spines text hatch plt axis plt.bar() plt.axis import figure pyplot highlight_text pypalettes plt.subplots() xlabel ylabel title legend colorbar savefig tight_layout grid set_xlim set_ylim plot scatter hist boxplot imshow cmap alpha bins tick_params annotate quiver contour barh stackplot subplots_adjust axhline axvline semilogx semilogy loglog polar streamplot hexbin pcolor tricontour errorbar clabel set_aspect violinplot set_axis_off spines text hatch plt axis plt.bar() plt.axis import figure pyplot highlight_text pypalettes plt.subplots() xlabel ylabel title legend colorbar savefig tight_layout grid set_xlim set_ylim plot scatter hist boxplot imshow cmap alpha bins tick_params annotate quiver contour barh stackplot subplots_adjust axhline axvline semilogx semilogy loglog polar streamplot hexbin pcolor tricontour errorbar clabel set_aspect violinplot set_axis_off spines text hatch plt axis plt.bar() plt.axis import figure pyplot highlight_text pypalettes plt.subplots() xlabel ylabel title legend colorbar savefig tight_layout grid set_xlim set_ylim plot scatter hist boxplot imshow cmap alpha bins tick_params annotate quiver contour barh stackplot subplots_adjust axhline axvline semilogx semilogy loglog polar streamplot hexbin pcolor tricontour errorbar clabel set_aspect violinplot set_axis_off spines text hatch plt axis plt.bar() plt.axis import figure pyplot highlight_text pypalettes plt.subplots() xlabel ylabel title legend colorbar savefig tight_layout grid set_xlim set_ylim plot scatter hist boxplot imshow cmap alpha bins tick_params annotate quiver contour barh stackplot subplots_adjust axhline axvline semilogx semilogy loglog polar streamplot hexbin pcolor tricontour errorbar clabel set_aspect violinplot set_axis_off spines text hatch plt axis plt.bar() plt.axis import figure pyplot highlight_text pypalettes plt.subplots() xlabel ylabel title legend colorbar savefig tight_layout grid set_xlim set_ylim plot scatter hist boxplot imshow cmap alpha bins tick_params annotate quiver contour barh stackplot subplots_adjust axhline axvline semilogx semilogy loglog polar streamplot hexbin pcolor tricontour errorbar clabel set_aspect violinplot set_axis_off spines text hatch plt axis plt.bar() plt.axis import figure pyplot highlight_text pypalettes plt.subplots() xlabel ylabel title legend colorbar savefig tight_layout grid set_xlim set_ylim plot scatter hist boxplot imshow cmap alpha bins tick_params annotate quiver contour barh stackplot subplots_adjust axhline axvline semilogx semilogy loglog polar streamplot hexbin pcolor tricontour errorbar clabel set_aspect violinplot set_axis_off spines text hatch plt axis plt.bar() plt.axis import figure pyplot highlight_text pypalettes plt.subplots() xlabel ylabel title legend colorbar savefig tight_layout grid set_xlim set_ylim plot scatter hist boxplot imshow cmap alpha bins tick_params annotate quiver contour barh stackplot subplots_adjust axhline axvline semilogx semilogy loglog polar streamplot hexbin pcolor tricontour errorbar clabel set_aspect violinplot set_axis_off spines text hatch
Introduction to Python
Matplotlib Journey is all about data visualization in Python. It assumes you already have a little experience with Python.
If you're brand new to the language, this lesson will get you up to speed. In just a few minutes, you'll learn the Python basics. Essential concepts like variables, comments, loops, and if statements.
What is Python?
Python is like a supercharged calculator. You can tell it 2 + 3, and it will give you 5. But that’s just the beginning!
Loading...
In Python, you write lines of code called commands in a console. A group of commands forms a script (e.g. a file), like the one you see on the left side of the sandbox below. You can execute this script by clicking the "Run" button.
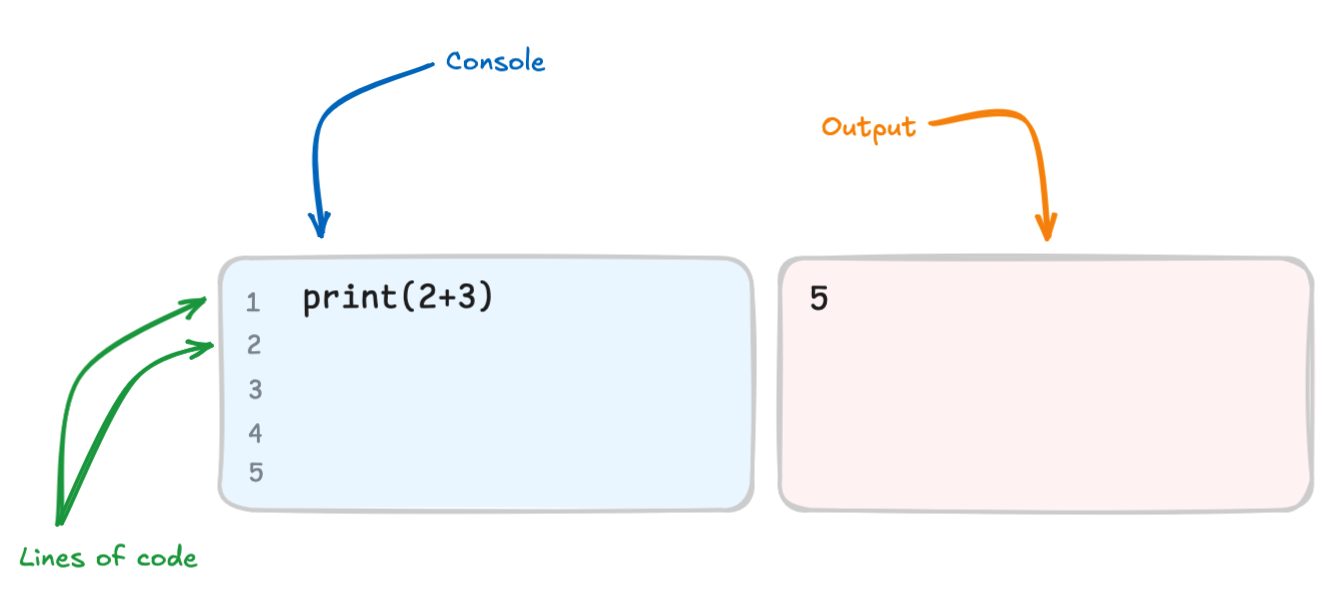
To display something you have calculated, it's advised to use the print() function. And if you make a mistake, Python will show you an error to help you figure out what went wrong.
Your turn! Try these 3 quick exercises to start practicing.
Create Variables
One of the most convenient features in Python is the use of variables. They allow you to assign a name to a value, so you can reuse it multiple times throughout your script.
Here's a simple example:
Loading...
Note that the name x is arbitrary: you could have written yo_soy_Joseph = 5 or hello = 5 (but you also should have changed yo_soy_Joseph + 3 and hello + 3, respectively).
The only rule is it should only contain letters, underscores (_) and digits.
Here is a slightly more advanced example, using several variables in an expression:
Loading...
You can also define a variable based on its previous value. In this case, the variable is updated (or mutated). Take your time to read the following code carefully and understand what’s happening:
Loading...
Your turn!
Operators
Operators are symbols used to perform operations. So far, we have used the + and - operators, but there are many others:
Loading...
These operators are called arithmetic operators because they allow us to perform math operations. Note that we also used the assignment operator (=) many times, when doing stuff like x = 5 for instance..
Oh no! 😱
It seems like you haven’t enrolled in the course yet!
Join many other students today and become the matplotlib expert your company needs!
Or Login