🔪 Sharpen your design eye 👀
Which version of each chart looks best?
Design principles matter in data visualization too. Ignore them, and your chart won’t look polished or trustworthy. Let’s see what you’ve got ⏱️!
A little dataviz game brought to you by Yan Holtz and Diana MacDonald
Easy
0/17
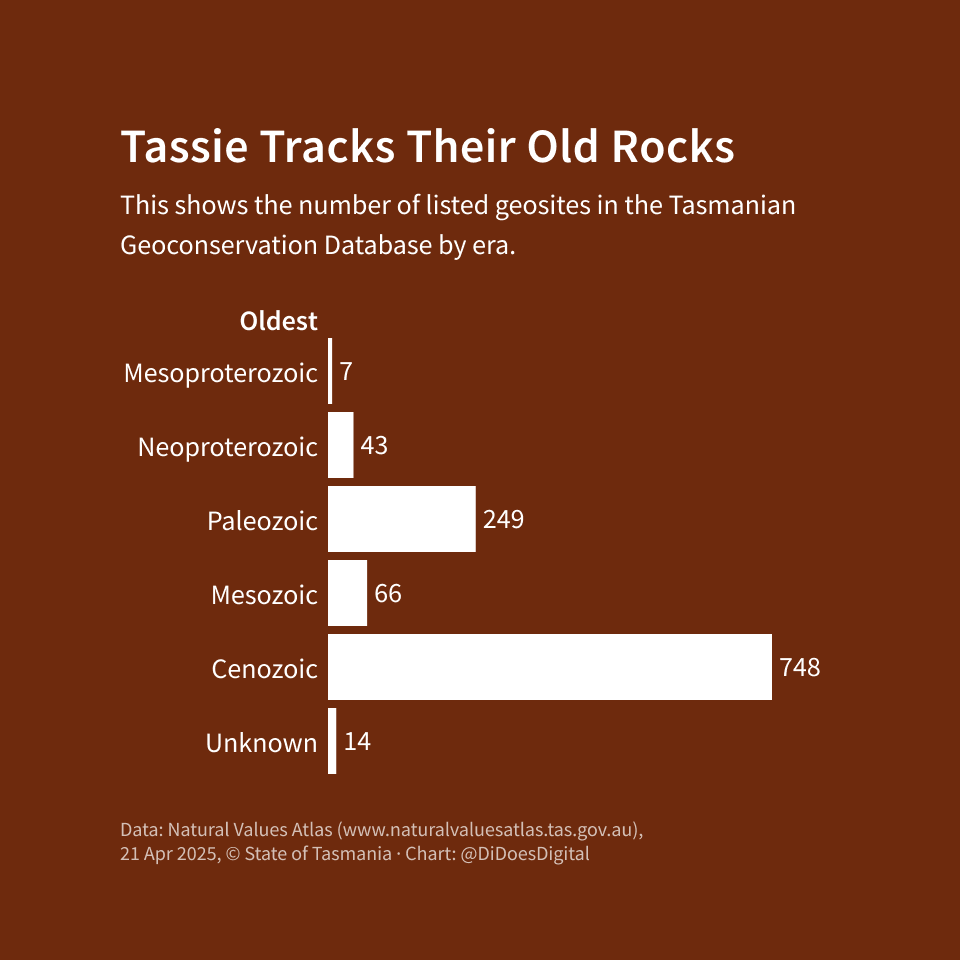
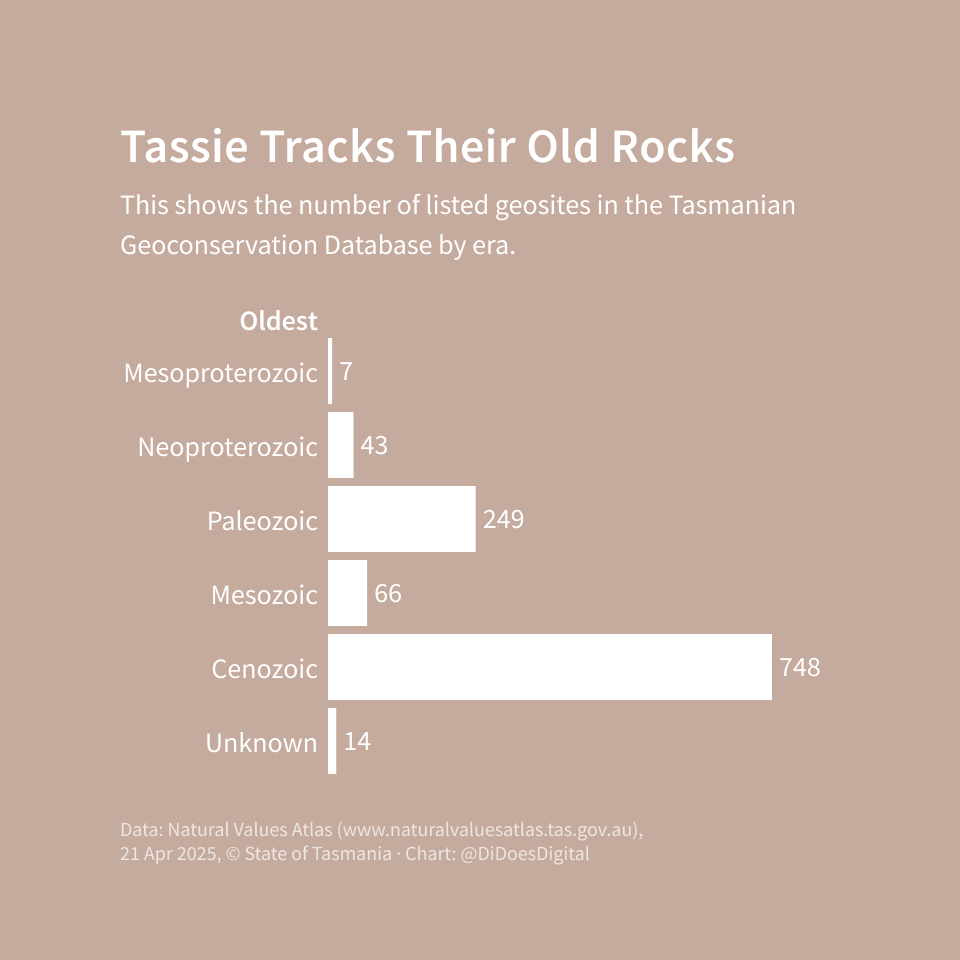
Which image looks best?
Click the better-looking image
You can also press 1 or 2 to select the left or right image respectively
You can also press 1 or 2 to select the left or right image respectively
You can also press 1 or 2 to select the left or right image respectively
You can also press 1 or 2 to select the left or right image respectively


You can also press 1 or 2 to select the left or right image respectively


You can also press 1 or 2 to select the left or right image respectively


You can also press 1 or 2 to select the left or right image respectively
You can also press 1 or 2 to select the left or right image respectively
You can also press 1 or 2 to select the left or right image respectively
You can also press 1 or 2 to select the left or right image respectively
You can also press 1 or 2 to select the left or right image respectively
You can also press 1 or 2 to select the left or right image respectively
You can also press 1 or 2 to select the left or right image respectively

You can also press 1 or 2 to select the left or right image respectively
You can also press 1 or 2 to select the left or right image respectively
You can also press 1 or 2 to select the left or right image respectively
You can also press 1 or 2 to select the left or right image respectively